



Abstract
BACKGROUND:
There is consumer interest in berries due to their nutritional properties, especially biologically active compounds. Spray drying technologies improve products stability and shelf life, and the agglomeration process subsequently enhances powder instantaneousness and flow properties.
OBJECTIVE:
The aim was to evaluate the effect of the fluidized bed agglomeration process on flow, reconstitution, and antioxidant properties of cape gooseberry, strawberry, and blackberry powder mix obtained by spray drying and a water and vitamin C binding solution.
METHODS:
A face-centered central composite design with 15 experiments was used; independent variables were fluidization temperature (T), binder solution atomization pressure (P), and process time (t), while dependent variables were moisture, solubility, wettability, particle size, antioxidant capacity, total phenols, Vit. C, β-carotenes (β-car), and total anthocyanins.
RESULTS:
The best process conditions from experimental optimization were T = 70 °C, P = 1.1 bar, and t = 29.1 min. This agglomerated product had low moisture values, good solubility, and 0.5 min wettability; the values for Vit. C = 246.4±3.4 mg/100 g db, β-car = 4.0±0.5 mg/100 g db, and total anthocyanins = 230.7±3.0 mg C3G/100 g db were noteworthy.
CONCLUSIONS:
An agglomerate berry-based powder product was obtained with 100% Vit. C RDA (Recommended Dietary Allowances) and 15% vitamin A RDA. Flow and instantaneousness properties of the agglomerated powder also significantly improved with the applied process.
Keywords
Introduction
Current consumers are increasingly turning their attention to berries because they are rich in bioactive compounds. These include fruits such as cape gooseberry (Physalis peruviana L.) that is rich in β-carotene (β-car), tocopherols, and other compounds [1–3], strawberry (Fragaria ananassa Duch) that is high in vitamin C (Vit. C), polyphenols, anthocyanins, flavonols, and ellagitannins [4, 5], and blackberry (Rubus glaucus Benth) that is abundant in phenolic acids, flavonoids, anthocyanins, flavonols, and tannins [6–8]. These compounds are beneficial to the individual because of such potential antioxidant, chemopreventive, anti-inflammatory, antimicrobial, antiallergic, antihypertensive, and cardioprotective properties [1–10].
Technologies have been developed that increase the shelf life of berries, while preserving native bioactive compounds and facilitating their use in gastronomy or as raw materials, primarily in the food, pharmaceutical, and cosmetics industries. Spray drying (SD) is one of the most widely used technologies to produce powders. It provides its products with high physicochemical and microbiological stability at a low cost and easy transportation; however, it generates fine particles, which usually have poor flow and instantaneousness properties [11]. In fruits with high sugar content or low molecular weight compounds, there is a decrease in the glass transition temperature (Tg) that produces sticky, adhesive, and compact powders [12]. The agglomeration processes have been applied in the chemical, pharmaceutical, and food industries to address these deficiencies [13].
The agglomeration process induces particle aggregation and channel formation between particles after evaporation of the binding fluid (usually water); this promotes water diffusion and wettability of the powders during reconstitution [14, 15]. Different types of agglomeration have been used; dry processes compact the powder using a pressurized roller system, the advantage of the method is that the final product does not require a drying process after agglomeration [14]. On the other hand, wet systems use a fluidized bed that generates the agglomerates from a binding solution that is atomized in the fluidization chamber; this type of agglomeration is widely used in the food industry to improve the instant properties of dairy products, cocoa powders, and other ingredients (Fig. 1) [14–17].
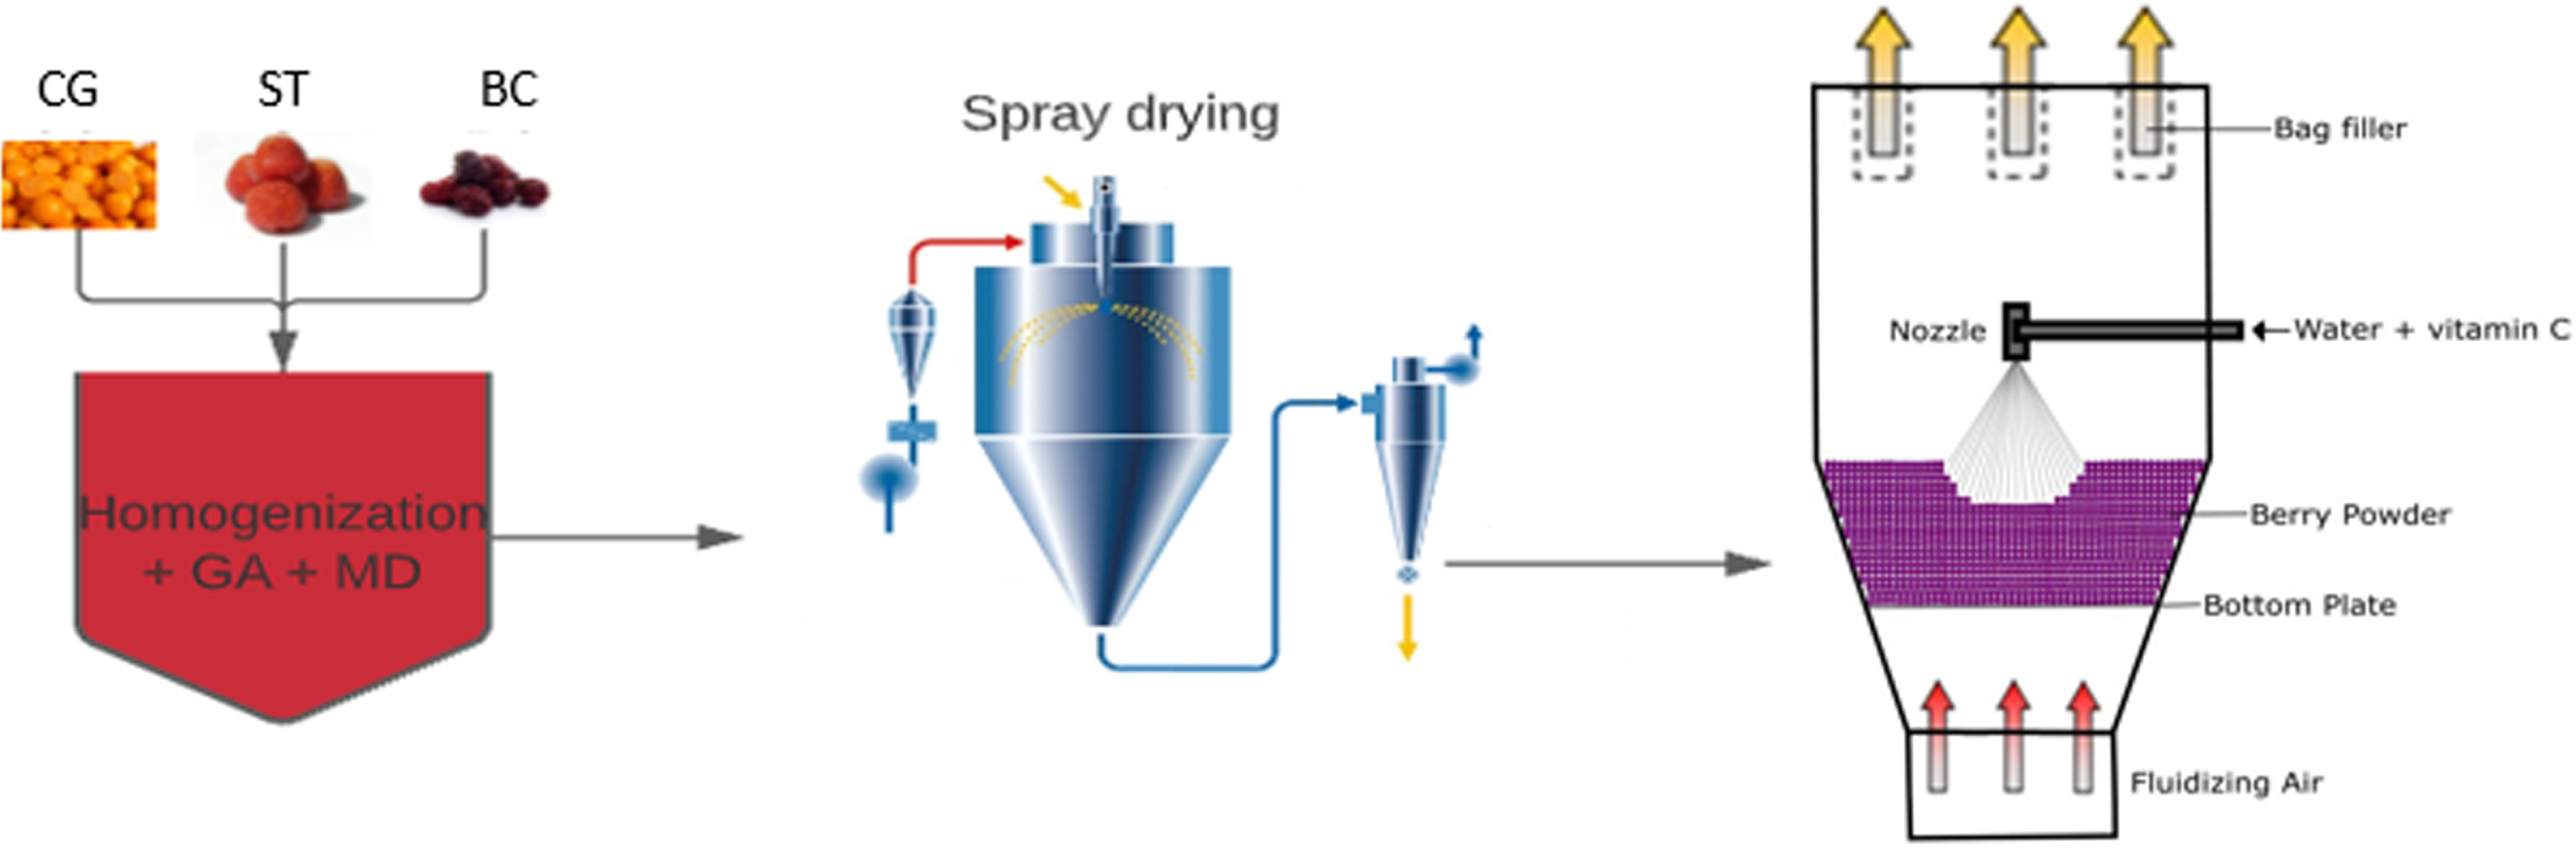
Schema of the wet agglomeration process of powders by fluidized bed using CG: cape gooseberry, ST: strawberry; BC: blackberry concentrate, GA: gum arabic, and MD: maltodextrin.
Examples of the main binders that have been used in agglomeration processes are pure water, ionic solutions, mono- and disaccharide solutions, fruit pulps, and maltodextrin solutions [18–22]. Among the independent variables that affect the quality of fluidized bed agglomerated products are: a) those directly associated with the process such as speed, temperature (T) and pressure of the fluidization air, the flow, type, and composition of the binding solution, atomization pressure (P), location of the system, and process time [17, 20]; and b) variables associated with the raw material or powder to be agglomerated include load, flow properties, fluidizing agent requirements, and water-holding capacity [19, 24].
Among the published studies on agglomeration processes, there are very few related to fruits and vegetables and none for berries or berry mixes. consisting of cape gooseberry, strawberry, and blackberry. Most of the studies have been published for gums and hydrocolloids such as galactomannan [25], xanthan [22], and pectin [26]. Others have focused on dairy products or protein matrices such as skim yoghurt powder [18, 23], oil and milk protein powder [27], whey protein isolated powder, other dairy protein powders [28–30], and soymilk powders [31]. Some authors have used plant and fungal matrices such as spinach juice powder [32], curcumin [21], acerola powder [33], and Agaricus bisporus mushroom [13].
In this context, the present study aimed to evaluate the effect of the fluidized bed agglomeration process on the flow, instant, and antioxidant properties of a berry powder mix (cape gooseberry, strawberry, and blackberry) obtained by SD.
Raw material
Cape gooseberry (CG) and strawberry (ST) fruits were harvested in the Department of Antioquia, Colombia. The CGs were selected at the 4-5 maturity stage according to the Colombian Technical Norm (NTC 4580, 1999; yellow-orange) and ST fruits according to the 4-5 color scale (NTC 4103, 1997; deep pink). In addition, a blackberry concentrate (BC) (Nutrium, Tuluá, Colombia) with °Brix (13% –15% at 20°C), citric acid (3.1% –5.1%), and pH (2.5–3.5 at 20°C) was used. Maltodextrin (MD) (6.35%) with a dextrose equivalent (DE) of 19–20 (Shandong Baolingbao Biotechnology Co., Ltd., China) and gum arabic (GA) (0.6%) (Tic Pretested Gum Arabic FT Powder, Tic Gums, Belcamp, MD, USA) were used for encapsulation. The formulation of the spray drying (SD) base suspension was previously described by [34] and adjusted with MD to be used in SD. The feeding to the agglomerator was a berry powder mix (BPM) (CG, ST, and BC) prepared in an industrial spray dryer (LPG200, Lemar, Changzhou, China) purchased from Proexcar SAS, Medellin, Colombia. The industrial spray dryer was operated at subatmospheric pressure (0.25–0.5 kPa) and under the following conditions: 140°C air inlet temperature, 82°C air outlet temperature, and 15000 rpm atomizing disk speed. The BPM exhibited the following properties of moisture (M) (2.9±0.9%), water activity (aw) (0.199±0.003), solubility (S) (82.6±0.4%), wettability (WE) (1.2±0.2 min), hygroscopicity (Hy) (18.2±1.0%), apparent density (ρa) (0.462±0.031 g/mL), compacted density (ρC) (0.535±0.039 g/mL), angle of repose (AR) (36.8±0.7°), particle size (D [3,2] ) (9.21±1.38μm), total phenols (TP) (1585.8±46.6 mg GAE/100 g db), 2,2′-Azino-bis-(3-ethylbenzothiazoline-6-sulfonic acid) diammonium salt (ABTS) (1508.4±70.9 mg TE/100 g db) and 2,2-diphenyl-1-picrylhydrazyl (DPPH) (1582.5±65.7 mg TE/100 g db) antioxidant capacity tests, Vit. C (130.9±10.0 mg/100 g db), β-car (9.65±0.44 mg /100 g db), and total anthocyanins (410.7±2.10 mg equivalent cyd-3-glu (C3GE)/100 g db). Due to fluidization problems of the BPM, silicon dioxide (1% w/w) (Pirosil PS-200, Glassven Yangzhong Additives J.V. Ltd., Yangzhong, China) was used to reduce material cohesiveness; this material was identified as the load in the agglomerator or non-agglomerated BPM.
Agglomeration process
The operation was carried out in a pilot agglomerator-encapsulator (Changzhou Zhiyang Machine Equipment Co., Ltd., Changzhou, China) reference DLP1.5 with a 350–1500 g capacity. An increasing airflow (80 ⟶ 120 m3/h) was used to ensure the fluidization of the load (400 g) in the chamber because of the increasing agglomerate size. The binding solution flow was designed with water and Vit. C at a concentration that allowed the agglomerated berry mix product to reach 100% of the recommended daily value (RDV) according to the requirements of the World Health Organization (WHO). The binding solution was incorporated at a constant flow of 1.3 mL/min during the processing time (t) established for the experimental design; however, the operation continued for an additional 5 min at the process temperature (T) to evaporate the final residual water in the product. The agglomeration process was evaluated by the response surface methodology based on a central composite design (α= 1) (15 experiments with 4 central points), three independent variables: T (50–70 °C), t (20–40 min), and atomization pressure (P) (1-2 bar), and the dependent variables: M, S, WE, D [3,2] , TP, ABTS, ABTS, Vit. C, β-car, and total anthocyanins.
Characterization of BPM and agglomerated berry powder mix (APB)
Moisture was determined according to the AOAC official method 930.15/90 [35] and S by the methodology described by [36], which modified the sample size (0.5 g) and distilled water volume (50 mL). The methodology explained by [37] and modified by [38] was used to determine WE; a 1 g sample was taken and the time in which the total mass was completely wetted was determined. The D [3,2] was determined with Mastersizer 3000 equipment (Malvern Instruments Ltd., Malvern, United Kingdom). The TP content and ABTS and DPPH free radical scavenging activity were determined from a methanolic extract obtained according to the methodology described by [34]. The TP were calculated with Folin-Ciocalteu reagent and from a calibration curve of gallic acid equivalent (GAE) between 0 and 300μg GAE/mL (R2 = 0.989) expressed as mg GAE/100 g APB db [39]. The ABTS was measured by a calibration curve of Trolox equivalent (TE) between 50 and 250μM (R2 = 0.998), while DPPH was between 0.02 and 0.12 mg/mL (R2 = 0.997) and both were expressed as mg TE/100 g APB db [40].
Vitamin C
Vitamin C extraction was determined according to the methodology by [41] with modifications. A 1.5 g sample of APB was placed in a graduated test tube and a KH2PO4 0.02M buffer solution, adjusted to pH 3.0 with 85% orthophosphoric acid, was added to a 20 mL volume. The mixture was vortexed for 2 min and centrifuged at 5000 rpm at 4 °C for 15 min; the supernatant was passed through a 0.45μm acetate-cellulose membrane filter and collected in an amber vial. Vitamin C was measured by high-performance liquid chromatography (HPLC) (Prominence 20A, Shimadzu Latin America S.A., Montevideo, Uruguay) using a Luna C18(2) 100A 250×4.6 mm×5μm column, KH2PO4 0.02M mobile phase, 3.06 pH, 1 mL/min flow, 1172 psi pressure, 4.317–4.456 min retention times, 5μL injection volume, and 244 nm wavelength. An L-Ascorbic acid (Lot LRAC1812, Sigma-Aldrich Inc., Saint Louis, MO, USA) analytical standard was used and results were expressed as mg/100 g APB db.
Carotenoids
Carotenoid extraction was performed based on the methodology by [42, 43]. A 2 g sample was weighed and 10 mL of a hexane:acetone mixture (60:40 v/v) was added; this sample was vortexed for 2 min, followed by an ultrasonic bath for 15 min, and centrifuged at 8000 rpm at 4 °C for 15 min. The supernatant was filtered with a Whatman 1 filter paper, and the collected sample was volumetrically diluted with the hexane-acetone mixture to a 10 mL volume. This new mixture was filtered in a 0.45μm acetate-cellulose membrane system and the new supernatant was collected in an amber vial. Carotenoids were measured by HPLC (Prominence 20A, Shimadzu Latin America S.A., Montevideo, Uruguay) using a Luna C18(2) 100A 250×4.6 mm×5μm S/N:773708-28 Phenomenex column, acetonitrile:methanol:acetone (60:30:10 v/v) mobile phase, 1.2 mL/min flow, 19.52 min retention time, and 450 nm wavelength. A calibration curve (1–30μg/mL) was used with the β-car standard (C4582-10MG Lot # SLBX4055, Sigma-Aldrich Inc., Saint Louis, MO, USA) and the results were expressed as mg de β-car/100 g APB db.
Total anthocyanins
Anthocyanin extraction was performed according to the methodology proposed by [44] with modifications. A 0.25 g sample was weighed and 30 mL of a methanol (99.0 % v/v) and HCl (1% v/v) mixture was added; this sample was vortexed for 2 min, followed by an ultrasonic bath for 15 min, and centrifuged at 8000 rpm at 4 °C for 15 min. The supernatant was filtered with a Whatman 1 filter paper, the sample was collected in a 50 mL volumetric balloon, 25 mL of the initial methanol-HCl mixture was added to the precipitate, and the process was repeated. The anthocyanin extract was filtered in a 0.45μm acetate-cellulose membrane system and the new supernatant was collected in an amber vial. Total anthocyanins were measured by HPLC (Prominence 20A, Shimadzu Latin America S.A., Montevideo, Uruguay) using a Luna C18(2) 100A 250×4.6 mm×5μm S/N:773708-28 Phenomenex column, 2% formic acid mobile phase A, acetonitrile:water:formic acid mixture (80:18:2 v/v) mobile phase B, 0.5 mL/min flow, 41.08 min retention time, and 515 nm wavelength. A calibration curve was used with the cyanidin-3-glucoside standard (0.5–50 ug/mL) and the results were expressed as mg C3GE/100 g APB db.
The morphology of the BPM and of the APB was determined with a scanning electron microscope (SEM) (JSM-5910, JEOL Ltd., Tokyo, Japan) and the samples were coated with gold. The micrograph analysis was performed under a high vacuum, 10 kV accelerating voltage, and at magnifications from 100X to 1000X [45, 46]. The glass transition temperature (Tg) for the products was determined with differential scanning calorimetry (DSC) (DSC Q20, TA Instruments, New Castle, DE, USA) equipment in modulated mode, –90 °C equilibrium, 1 min isotherm, and heating to 100 °C at a rate of 10 °C/min.
Data analysis
The results were analyzed with the Statgraphics Centurion XVI software using analysis of variance (ANOVA) with a 95% confidence interval. The dependent variables were modeled from a second-order polynomial model (Eq. 1) where Y is the dependent variable, β0 is constant, βT, βt, and βP are the coefficients for each factor, βThboxt, βThboxP, and βthboxP are the linear interaction coefficients of the factors, and βT2, βt2, and βP2 are the quadratic interaction coefficients. The mathematical models were fitted using the lack of fit method and the regression coefficient (R2). The dependent variables for each experiment were obtained from three replicates at different process times, and the experimental values at the optimal condition were derived from three replicates, which were compared with the theoretical value of the mathematical model to verify model accuracy. Meanwhile, the relative mean error (RME) between the theoretical and experimental values was determined by Equation 2.
Tables 1 2 provide the mean values and p-values of the dependent variables for the APB according to the experimental design and ANOVA results, respectively.
Results of the APB dependent variables according to the experimental design
Results of the APB dependent variables according to the experimental design
T: Temperature; t: process time; P: atomization pressure; M: moisture; S: solubility; WE: wettability; D [3,2] : particle size; TP: total phenols; Vit. C: vitamin C; β-car: β-carotenes.
p-values of analysis of variance (ANOVA) for APB
*Significant at p < 0.05. T: temperature; t: time; P: pressure; M: moisture; S: solubility; WE: wettability; D [3,2] : particle size; TP: total phenols; Vit. C: vitamin C; β-car: β-carotenes.
The M values of APB fluctuated between 4.3±1.9% and 7.1±0.0%; however, an important effect of the process was observed that was statistically significant (p < 0.05) compared to all the independent variables and their linear and quadratic interactions. The volume response graph in Fig. 2 illustrates the zone in which the M values are lower (blue zone). It indicates binding points where binding water has partially evaporated, which enhances the mechanical stiffness of the structure and confers higher binding strength between the particles [14]. This zone identifies the most favorable conditions of the independent variables with high t (> 28 min), high P (1.5–2.0 bar), and T > 56 °C.

Volume response of moisture for agglomerated berry powder mix (APB).
The reason for this behavior is that finer particles of the binding solution are reached at higher P, which eventually generates greater nucleation and adhesion of particles with one another. Likewise, the loading mass/binding solution mass ratio is lower with prolonged times; therefore, the binding solution injection into the powder is larger [14].
As T increases, the evaporation rate of the binding water increases; therefore, M of the APB decreases [20]. In addition, this higher driving force increases the binding force between particles and reduces the agglomeration process [14]. The M results were similar to those reported by [31] for agglomerated soy milk powder (3.70% –5.02%), while they were slightly less than those obtained by [23] for agglomerated yogurt powder (5.8% –9.1%) and by [47] for agglomerated bayberry powder (5.1% –10.8%).
Solubility varied between 58.5±2.1% and 77.7±3.6% and showed significant differences (p < 0.05) for t, P, the P-t and T-t linear interactions, and the P-P quadratic interaction. The volume response graph in Fig. 3 illustrates that the most favorable zone (> S) (red zone) is reached when the system operates at high P (2 bar), t (20–32 min), and T (over the entire range). The P-t interaction effect was negative, while the T-t interaction was positive with the highest S values located in the elliptical shapes depicted in the graphs.

Volume response of solubility for agglomerated berry powder mix (APB).
The behavior of S is attributed to different factors. Firstly, high P contributes to the formation of smaller binding solution droplets, which provides a better droplet distribution on the surface of the particles that are agglomerated in the chamber. This results in a greater number of hydrophilic contact points (highly polar binding solution), which finally improves the S of APB [24]. Secondly, S of the APB was lower than that of the BPM (82.6±0.4% with ρb = 0.46 g/mL); this would explain the behavior observed in the P-t interaction in which S remains high at the beginning of the process, and as t increases, the APB tends to densify, which decreases its porosity (ρb: 0.47–0.54 g/mL > ρb BPM) and S. Thirdly, the decrease in S when T and t increase is due to increased binding forces in the solid bridges of APB (> particle-particle interaction), which can lead to volumetric shrinkage or decreased porosity that it makes difficult to rehydrate the product [17].
There is no information about S in agglomerated berry powder mixes; however, the values obtained in the APB were similar to those reported by [18] for yogurt powder (54.2±0.12% to 64.0±0.0 %) and lower than values indicated by [33] for acerola powder (94.0% –98.0%).
Wettability is a very important property in the quality of APB because it represents the surface capacity to absorb the reconstitution water by capillary forces, which breaks the surface tension between the two [15]. The WE values for the APB fluctuated between 0.10±0.01 and 1.44±0.05 min, which provided good reconstitution characteristics. In addition, the agglomeration process contributed to reducing WE compared with values obtained in the BPM (1.2±0.2 min). The ANOVA showed significant statistical differences of WE (p < 0.05) for t and P, the T-P and t-P linear interactions, and the t-t and P-P quadratic interactions. This fact identifies this property as a critical variable because its response is highly conditioned by the prevailing process variables.
The WE volume response graph in Fig. 4 identifies two operative zones in which the WE values are favorable (very low WE) (blue zone). Values are P = 1.0–1.5 bar, T = 70 °C, and t = 20–30 min for zone 1 and P = 1.8–2.0 bar, T = 50–64 °C, and t = 32–40 min for zone 2. The WE was strongly influenced by the size of the formed agglomerate and its porosity. Overall, when the agglomerates have a larger particle size, the structure behaves with increased porosity; this promotes the absorption of the reconstitution solvent because of the larger generated surface area that increases the capillary forces (very low WE) [24].
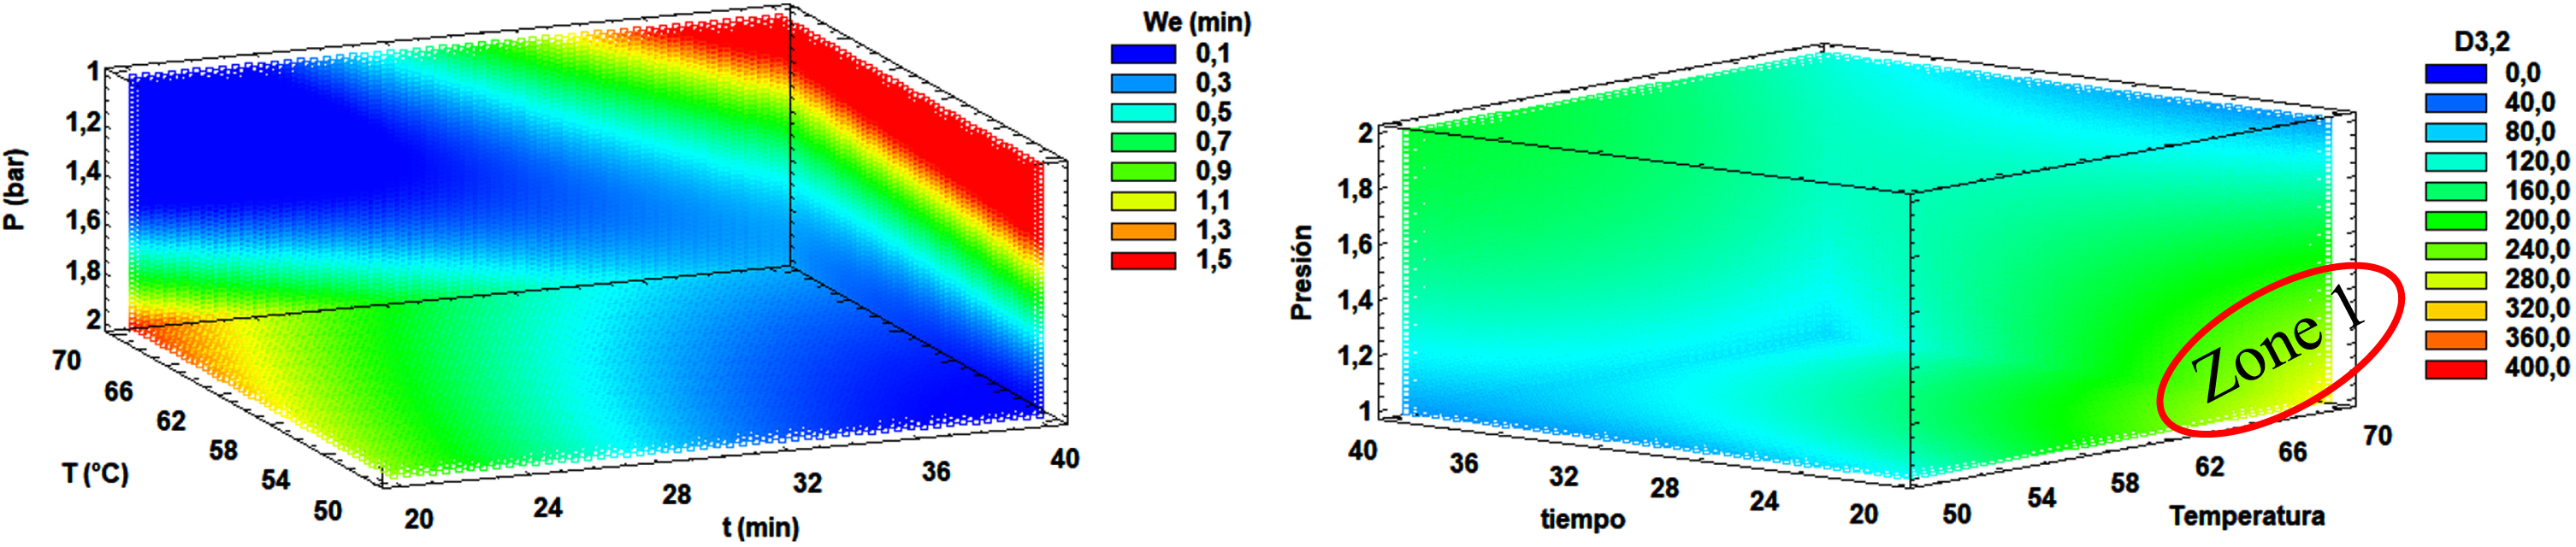
This behavior was observed in the present study in which the largest D [3,2] coincided with the two previously mentioned zones (Fig. 4A). The D [3,2] values varied between 37.63±0.45 and 384.77±34.73μm and with high heterogeneity among the different agglomerate sizes. This variable showed no significant differences for none of the factors.
The literature reports few results for WE in food products. Values indicated by [48] were between 0.01 and 3.0 min in different agglomerated products for babies. Higher values in oil agglomerated powder with milk protein and trehalose (0.6–5.0 min) and milk protein agglomerates (5.3–23.3 min) were obtained by [38] and [39], respectively. For D [3,2] , values were within the ranges reported by [47] for a bayberry agglomerate and [49] for agglomerated carrot concentrate.
The antioxidant activity of APB determined by DPPH and ABTS varied between 1590.7±72.2 and 2326.2±106.0 and between 1150.8±40.9 and 1606.1±69.7 mg TE/100 g APB db, respectively. Overall, the agglomeration process provided good antioxidant activity of the APBand reached higher values than those of the BPM for DPPH (1582.5±65.7 mg TE/100 g db) and ABTS (1508.4±70.9 mg TE/100 g db). This is mainly attributed to the addition of Vit. C in the binding solution, which primarily influenced the increase in DPPH, caused by its free radical scavenging activity [50]. In addition, agglomeration T could promote non-enzymatic browning reactions by the generation of compounds that interact with the radicals used in antioxidant activity tests [51].
The ANOVA showed significant differences (p < 0.05) in both variables for the T-T and t-t quadratic interactions. In addition, ABTS exhibited significant differences (p < 0.05) for the T-t and T-P linear interactions. The volume response graph in Fig. 5A shows that the highest DPPH values are reached when the system operates at low T (50–57 °C) (red zone), high t (28–40 min), and high P (1.5–2.0 bar). Figure 5B for ABTS shows that the highest values are reached when the system operates at high T (58.0–70.0 °C), t (22–40 min), and high P (1.7–2.0 bar).
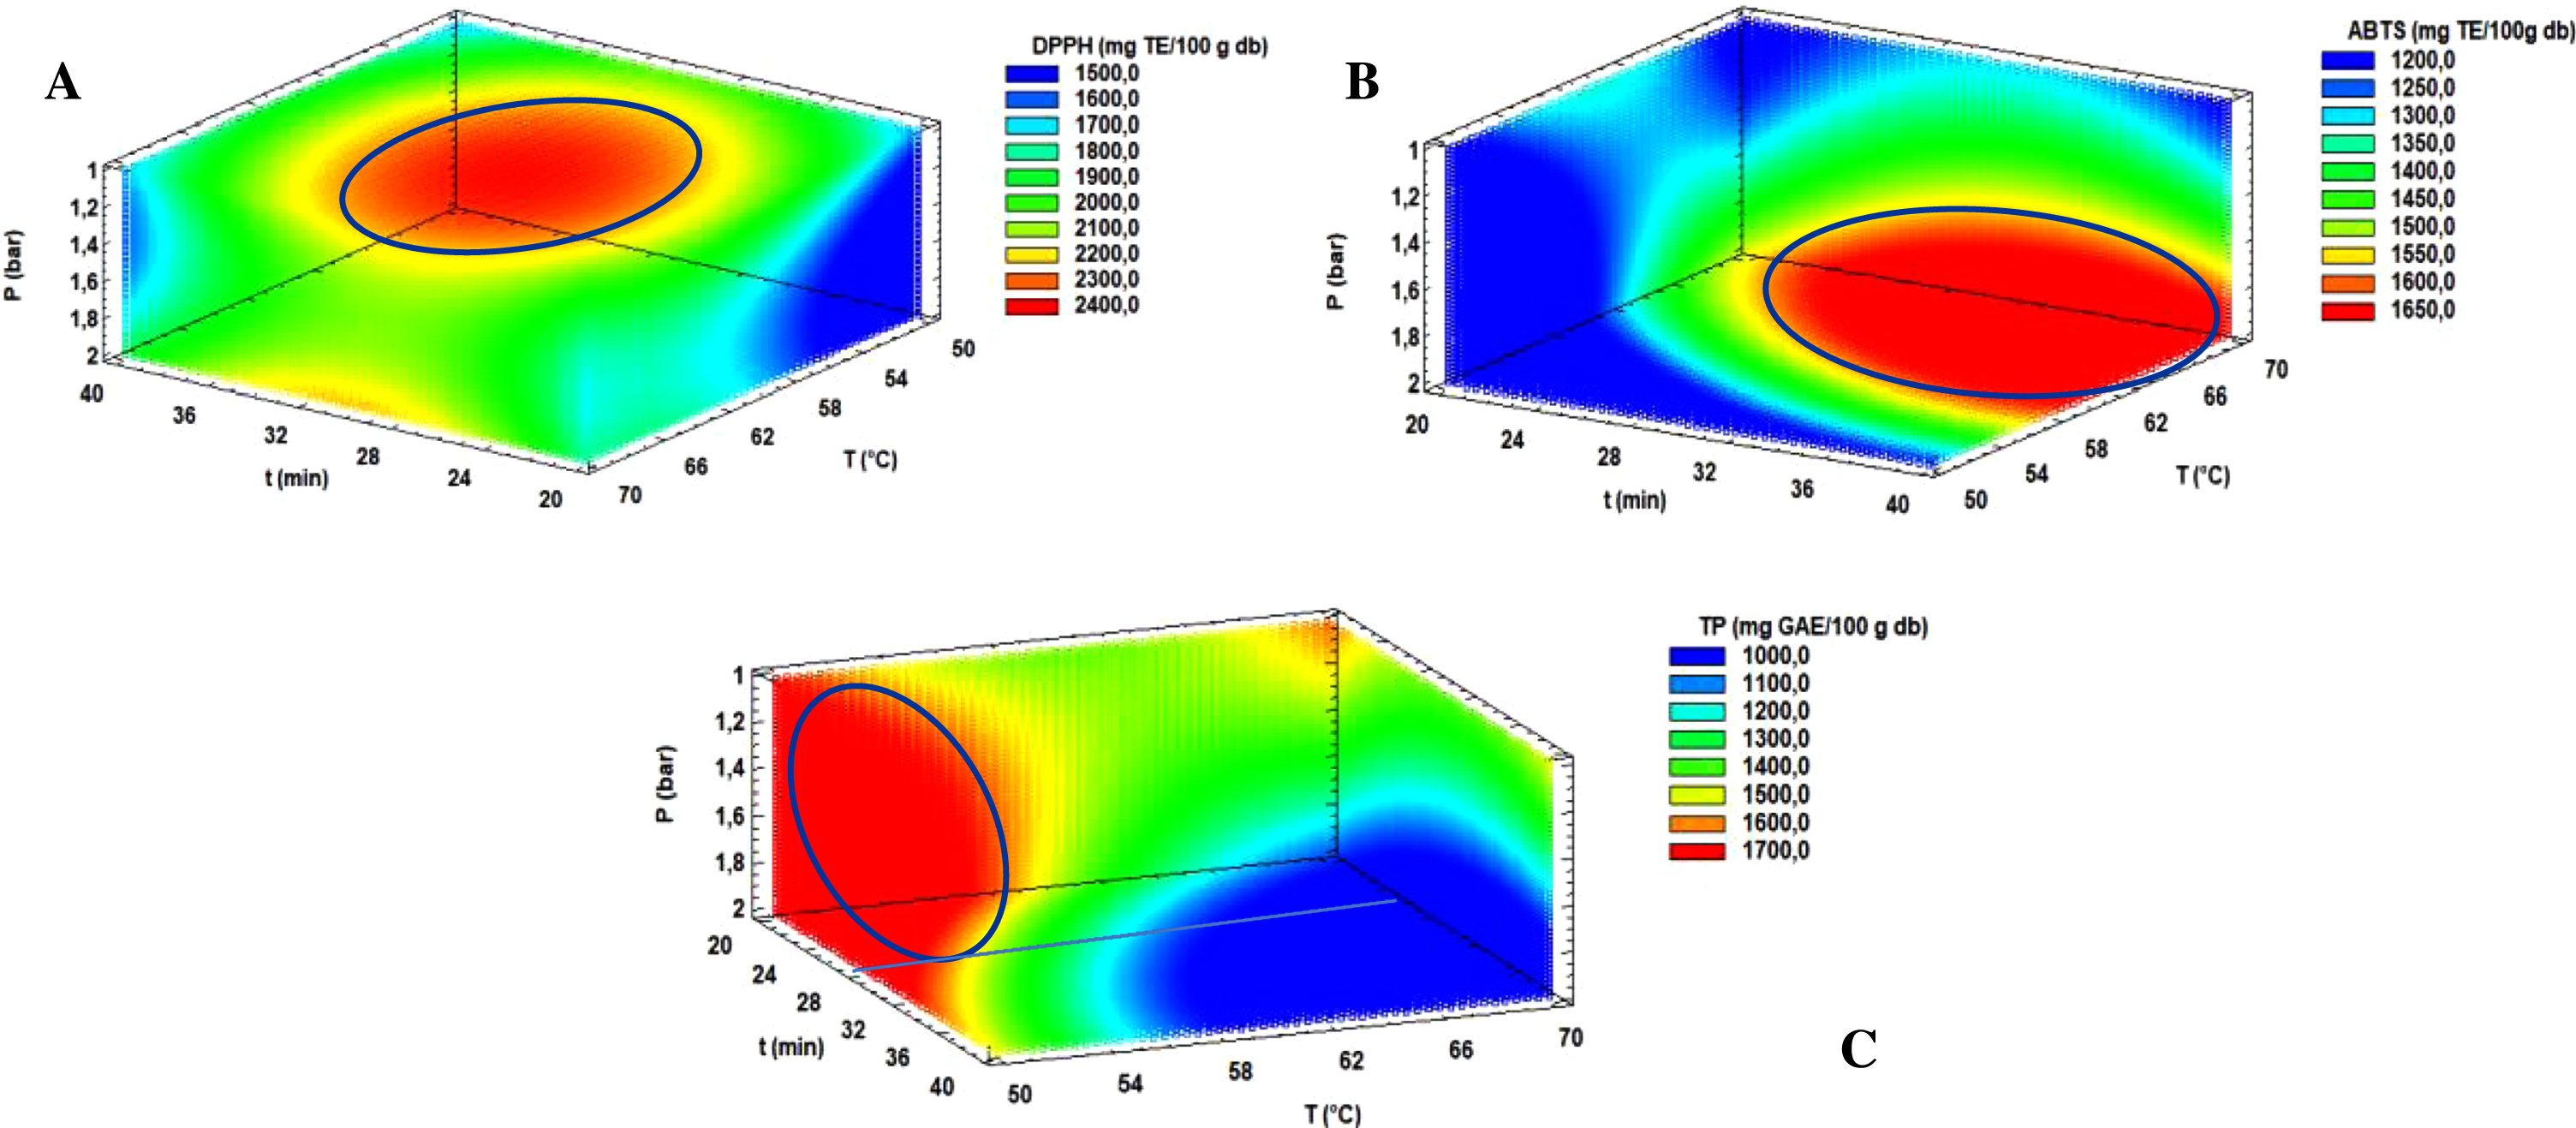
Volume response of antioxidant activity (DPPH and ABTS) and total phenols (TP) for agglomerated berry powder mix (APB).
The literature reports no antioxidant activity and TP values in agglomerated food products; however, there are some results for berries obtained by different drying technologies such as in blueberries by convective drying at 90 °C (TP: 1043.3±23.3 mg GAE/100 g) and microwave drying at 300W (TP: 1148.8±22.6 mg GAE/100 g) [52], in freeze-dried CG (DPPH: 98.5 mg TE/100 g) [53], and spray-dried acai powder (DPPH: 307.6 mg TE/100 g) [54].
The TP contents varied between 1089.9±8.2 and 1675.2±16.9 mg GAE/100 g APB db. Overall, these values were lower and higher than those determined for the BPM (1585.8±46.6 mg GAE/100 g db). This demonstrates two behaviors; firstly, at certain operating conditions, the agglomeration process contributes to phenolic compound degradation due to temperature [55, 56]. Secondly, there is an increase in TP content because of the Vit. C interaction (reducing compound) in the Folin-Ciocalteu reaction [57]. The ANOVA showed significant differences in TP (p < 0.05) for T, t, the T-P linear interaction, and the T-T and t-t quadratic interactions. The volume response graph in Fig. 5C shows the operation zone that provides the highest TP content (red zone) with T = 50–56 °C, t = 20–28 min, and P over the entire evaluated range. This behavior is explained by the fact that the TP are thermolabile compounds and are highly affected by high T; likewise, higher t implies a greater exposure of these compounds to high T and O2 present in the fluidization chamber, which contributes to the degradation and oxidation that finally decrease the TP content in APB [55, 56].
The mean values of Vit. C, β-car, and total anthocyanins of the APB ranged from 170.4 to 461.5 mg/100 g APB, 3.7 to 5.3 mg/100 g APB db, and 203.8 to 263.4 mg C3GE/100 g APB db, respectively. The process conditions evaluated in the agglomeration showed important changes, especially in Vit. C; however, these values adjusted to a 30 g serving to prepare a beverage reached Vit C and β-car levels of 48.89% –138.44% RDA (Recommended Dietary Allowances), and 10.6% –15.1% RDA, respectively, according to the WHO requirements [58].
The comparison of Vit. C in the BPM (130.9±10.0 mg/100 g db) versus APB showed a positive effect of the agglomeration process that is attributed to its addition in the binding solution. The β-car and anthocyanin contents in the BPM (9.6±0.4 mg/100 g db) and (410.7±2.10 mg C3GE/100 g db), respectively, were negatively affected by the agglomeration process; for β-car, this is explained by possible isomerization, oxidation, conversion, and other reactions that they undergo because of the effect of light, temperature, O2, and acidic media [59]. Several studies have reported anthocyanin degradation, especially due to the effect of temperature and process times [60, 61]. Possibly, the temperatures of the agglomeration process and the decrease in pH, due to the ascorbic acid present in the binding solution, contribute to the degradation of the anthocyanins. This consists mainly in the opening of the pyrilium ring and the formation of chalcones, in addition to the hydrolysis of the glycosidic bond [62].
The literature provides no data for active components in agglomerated berry-based products. Results for Vit. C found in the APB were higher than those reported by [52] in blueberries dehydrated by different methods (3.1–27.5 mg/100 g db) and lower than those indicated by [63] in camu-camu flour (9000 mg/100 g db). As for the other active compounds, results for β-car were higher than those mentioned by [64] in gojiberries (1.2 mg/100 g db). Meanwhile, for anthocyanins, results were higher than those reported by [65] in freeze-dried mao powder (347 mg/100 g) and lower than those in spray-dried acai powder (3436.8±79.1 mg/ 100 g) [54].
The ANOVA showed no significant differences (p < 0.05) for Vit. C and total anthocyanins compared with the evaluated independent variables or with their linear and quadratic interactions. The volume response graph in Fig. 6A for Vit. C shows a predominant zone in almost the entire graph (blue-green zone) for ranges from 190 to 340 mg /100 g APB db. This variability could be partly due to the BPM and partly to the thermolability of this vitamin to higher T [66]. The volume response graph in Fig. 6B for total anthocyanins illustrates their decrease caused by the effect of higher T and t, which are conditions that promote their degradation [60, 61].
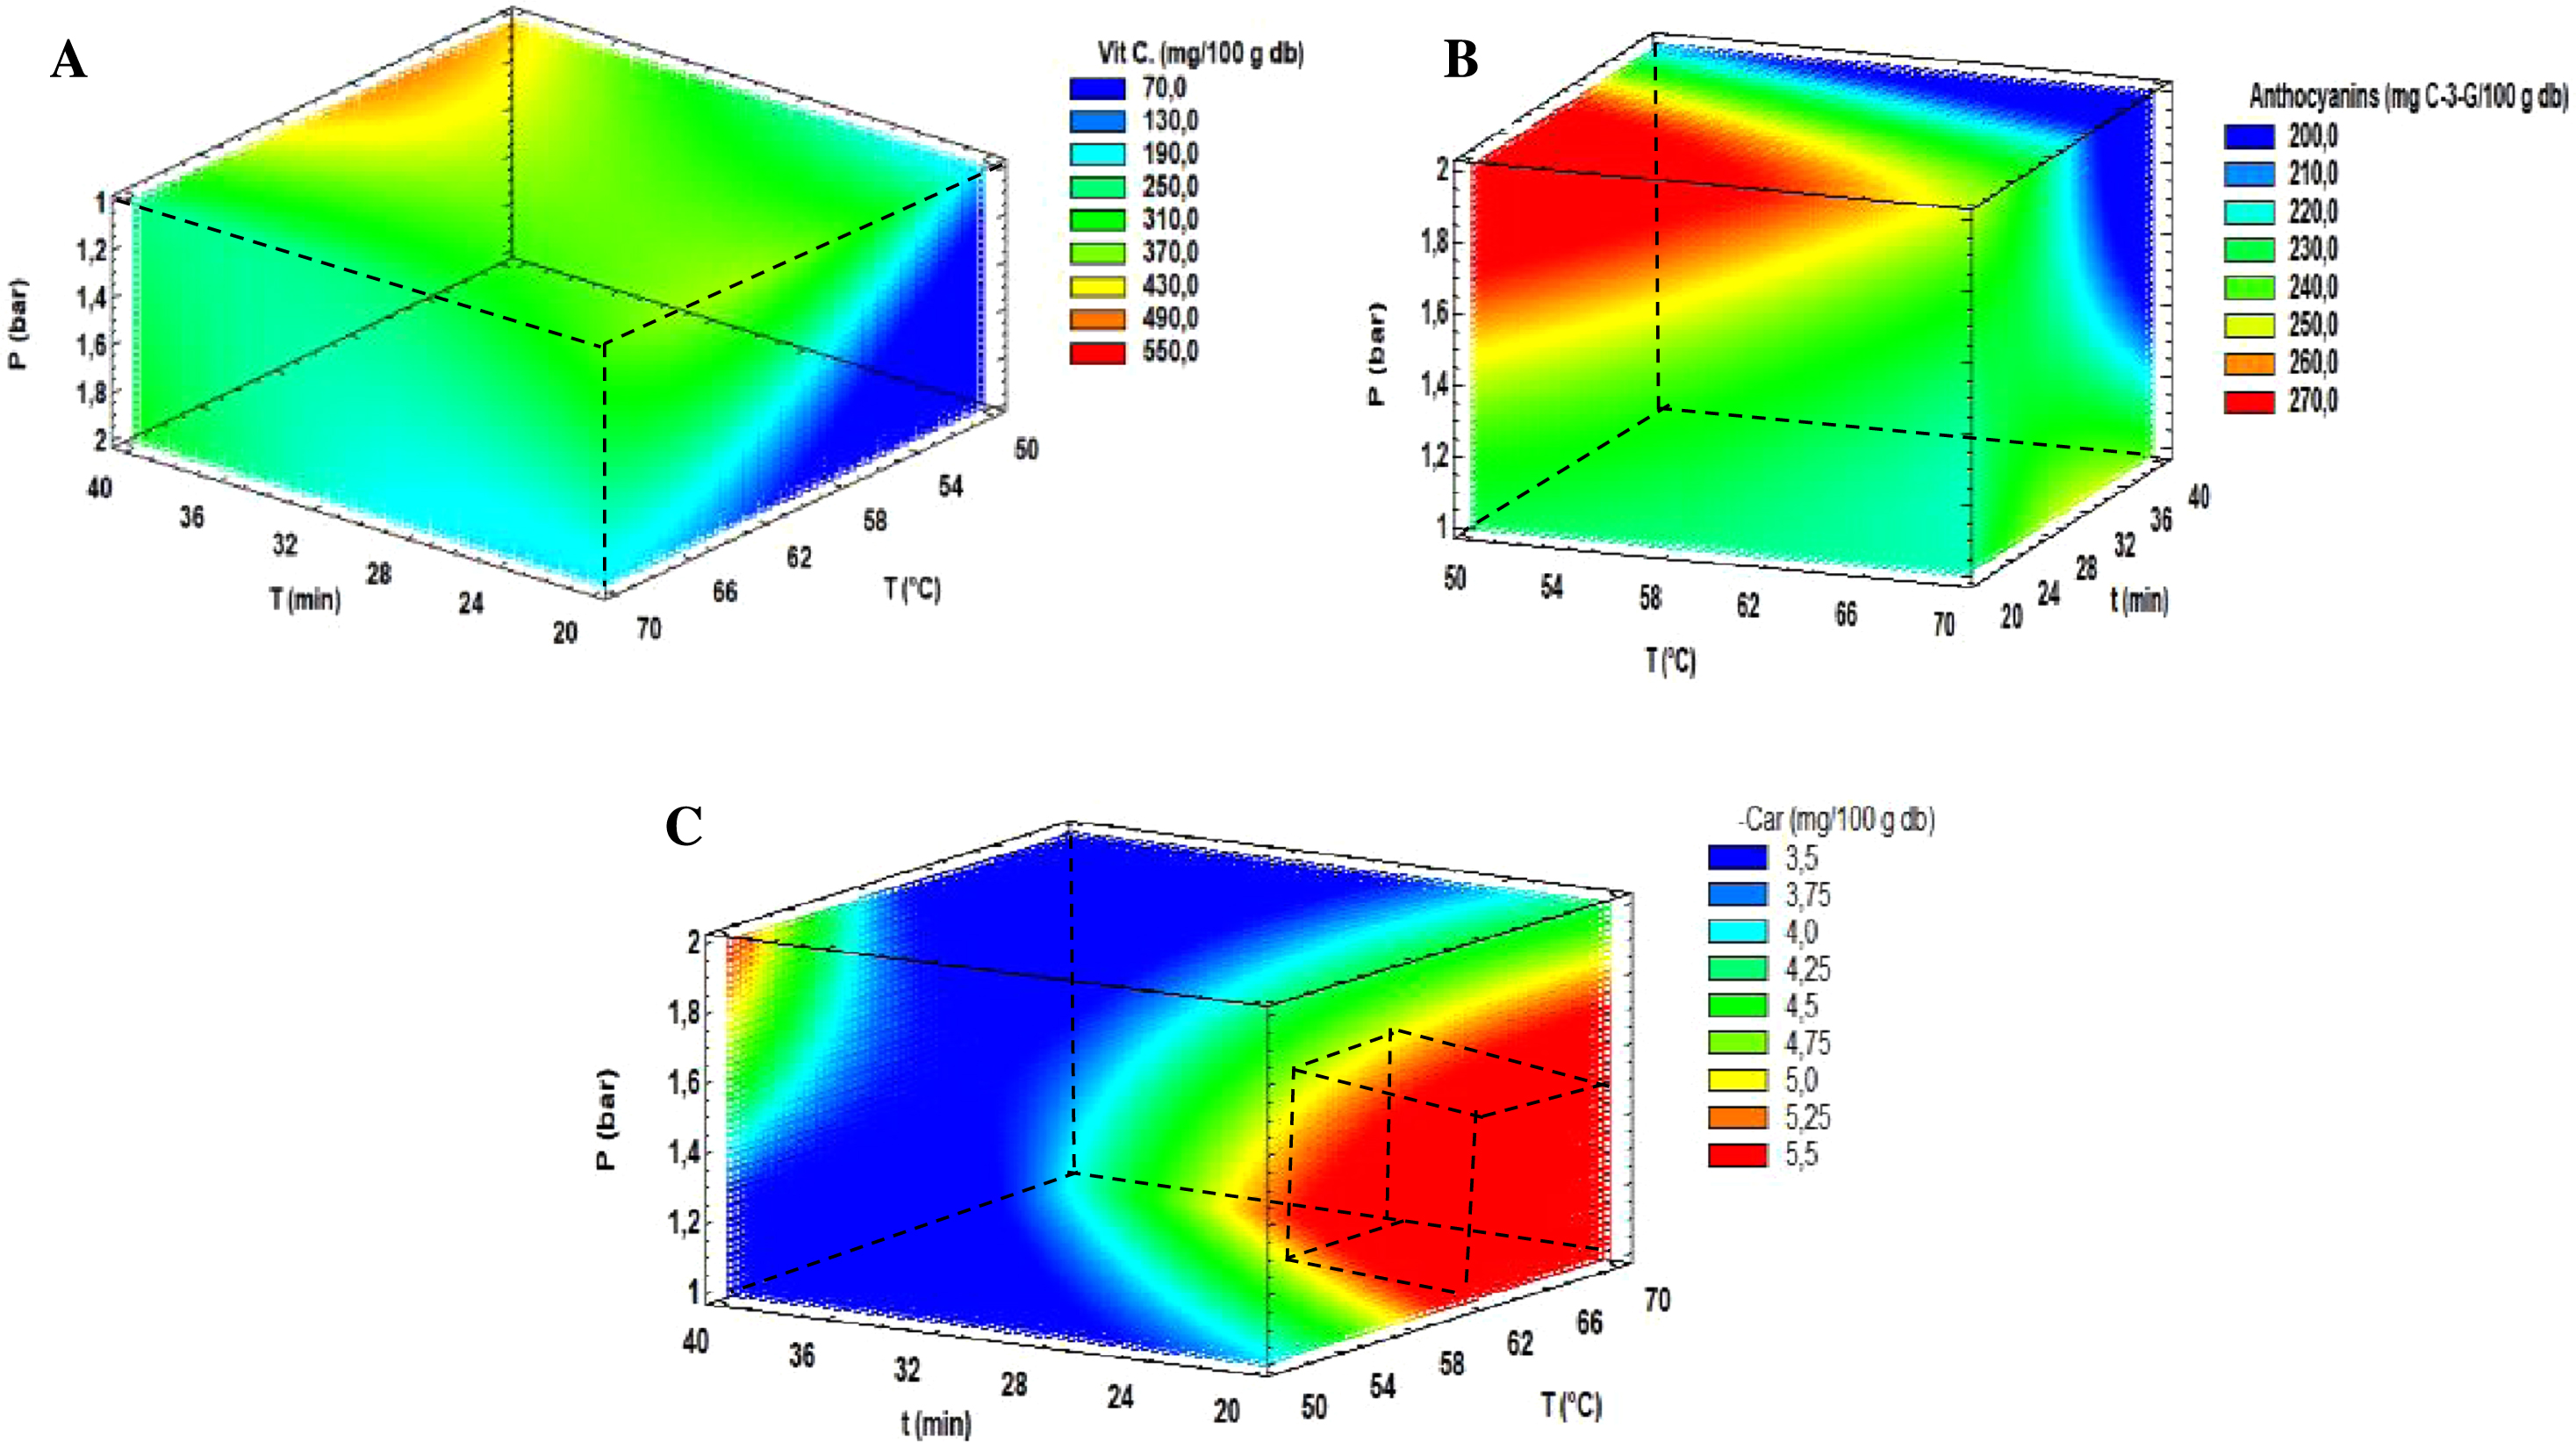
Volume response of vitamin C (Vit. C), total anthocyanins, and β-carotenes (β-car) for agglomerated berry powder mix (APB).
The ANOVA showed significant differences (p < 0.05) for β-car compared with t and the T-P linear interaction. Figure 6C identifies the region with the highest β-car content (red zone) under the process conditions of T = 60–70 °C, t = 20–26 min, and P = 1.0–1.7 bar. When APB are exposed to a longer t, a greater loss of β-car occurs, which is probably due to further promotion of oxidative and isomerization processes [57]. The T-P interaction was negative and unexpected, indicating that when the process operates at higher T and lower P, carotene preservation increases. This suggests that there could be higher porosity in the agglomerate (lower bulk density), which exposes the encapsulated compounds more and facilitates their extraction and quantification [67].
Table 3 shows the regression coefficients and R2 of the second-degree polynomial models for each dependent variable. The fitted regression of the mathematical models allowed us to identify that 60% of the dependent variables (M, S, WE, ABTS, DPPH, and TP) exhibited the best fitted experimental data (R2 > 90%), while for 30% (Vit. C, β-car, and total anthocyanins), the fit was between 50% and 77% and only 14% for D [3,2]
Values of the coefficients for the mathematical model, regression coefficient (R2) and lack of fit for each dependent variable APB
Values of the coefficients for the mathematical model, regression coefficient (R2) and lack of fit for each dependent variable APB
β0: Constant; T: temperature; t: process time; P: atomization pressure; M: moisture; S: solubility; WE: wettability; D [3,2] : particle size; TP: total phenols; Vit. C: vitamin C; β-car: β-carotenes.
However, the lack of fit test showed that most of the dependent variables (M, S, D [3,2] , ABTS, DPPH, β-car, and total anthocyanins) were not statistically significant (p > 0.05). In addition, all the dependent variables had randomly distributed residuals, which ensures that the data can be parametrized according to a normal distribution. Therefore, these mathematical models can be considered acceptable to explain the experimental data [68]. The variables WE and TP presented a significant lack of fit (p < 0.05). This indicates that the quadratic model was not sufficient for these variables, therefore a cubic model was tested for both. The cubic model for the variables showed a non-significant lack of fit (WE:0.1266 and TP: 0.1162) and a random distribution of residuals, which could be considered a good model for both variables. However, when evaluating the optimal conditions for both variables, these did not vary between the quadratic response surface model and the cubic model, in addition to the fact that the latter does not have a reasonable physical explanation for the process and its effects; therefore, the initial quadratic model was left for both variables.
The criteria for the experimental optimization of multiple responses were selected looking for the final product to match the best quality attributes, using the desirability function. Also, the generalized variance of the estimators was minimized to provide a more accurate estimation of the dependent variables of the model.
The impact was established according to the behavior or importance of each of the dependent variables in the process. In contrast, the weights were consistent with the impact and represented the permissibility given to the dependent variable to move away from the established criterion [69]. In this context, the desirability found was 73.9%.
Table 4 presents the criteria, weights, and impact included in the experimental optimization process; it also shows the theoretical values obtained from the mathematical models and the experimental values determined from three replicates carried out under optimal conditions and the relative mean error (RME) between both values. Therefore, the experimental optimization of the process for APB yielded the following operating conditions: T = 70.0 °C, t = 29.1 min, P = 1.1bar, and 73.9% desirability. Some variables presented an RME > 20%, this behavior is explained in the randomness of the particles in the fluidization process or variables that are not controlled in this process. However, the absolute values of the studentized residuals for the variables were not greater than 4, and the R2 values were generally high, guaranteeing that the model gives a good explanation to the experimental data.
Comparison of theoretical and experimental values of APB and their respective relative mean error (RME)
M: Moisture; S: solubility; WE: wettability; D [3,2] : particle size; TP: total phenols; Vit. C: vitamin C; β-car: β-carotenes.
The Tg of the APB and the BPM were 67.4 and 48.6 °C, respectively; these values indicate that both structures are in an amorphous glassy state (non-thermodynamic state) under normal storage conditions (10–35 °C) and good physicochemical stability. The highest Tg value in the APB versus the BPM (ΔTg ≅ 20 °C) is attributed to the presence of silicon dioxide as an anticompacting agent whose Tg is 1237.8 °C [70].
Figure 7 shows the micrographs for the BPM and APB obtained under the optimal condition of the agglomeration process.

Micrographs of BPM and agglomerated berry powder mix (APB). (A, B) 100X, (C, D) 200X, and (E, F) 1000X.
A group of small, individualized particles was identified in the BPM with approximate sizes between 10 and 100μm and different shapes, including small groups that, in a very small proportion, suggest cohesion, caking, and stickiness phenomena of the berry powder. In addition, there are different surface textures, which can be smooth, collapsed, and hollow (Figs. 7A, C, and E). This microstructural collapse and particle fracture are mainly attributed to the internal depression caused during the rapid evaporation process experienced during SD [11].
The (D [3,2] ) increased for the APB, which fluctuated approximately from fine particles (10–20μm) to a predominance of larger-sized groups (50–200μm); this demonstrates the agglomeration mechanism by solid bridges and a lever mechanism in which the particles join with one another when the binding agent evaporates to form random and staggered unions (Figs. 7B and F). The micrograph in Fig. 7D shows densification and microstructural collapse of the particles, which is partly attributable to the initial state of the berry powder load obtained by SD. In addition, and to a lesser extent, it is due to the evaporation process, mainly at high temperatures in the agglomeration process that generates decreased porosity in the APB [32].
The response surface methodology enables the identification of the main effects that the independent variables and their interactions had on the instantaneousness and bioactive compound properties of the agglomerated berry powder mix (APB). Experimental optimization allowed the selection of the best-operating conditions of the agglomeration process, which were T = 70 °C, P = 1.1 bar, and t = 29.1 min. A product with excellent reconstitution properties such as high solubility (80.2±1.0%), low wettability (0.5±0.1 min), and high bioactive compounds, including vitamin C (246.4±3.4 mg/100 g APB db), β-carotenes (4±0.5 mg /100 g APB db), and total anthocyanins (230.7±3.0 mg C3GE/100 g APB db) was obtained under optimal conditions. The use of anticompactings during the agglomeration process improved the flow properties of the powder and increased Tg to ensure an amorphous glassy state for the APB at normal storage temperatures (< 30 °C).
Footnotes
Acknowledgments
The authors wish to acknowledge the staff of the food quality control laboratory of the Universidad Nacional de Colombia.
Funding
The authors disclosed the following financial support for the research, authorship, and/or publication of this article. This work was supported by Minciencias, Sistema Nacional de Regalías del Departamento de Antioquia, Proexcar, and the Universidad Nacional de Colombia campus Medellín, Colombia [grant number 805].
Declaration of conflicting interests
The authors declare that there is no conflict of interest.
Author contributions
Manuela Gallón Bedoya: performance of work, interpretation of data, and writing the article.
Misael Cortés Rodriguez: conception, interpretation of data, and writing the article.
Jesús Humberto Gil: interpretation of data and writing the article.
Roberto Lemus Mondaca: interpretation of data and writing the article.
All authors have access to the data.