
Abstract
INTRODUCTION:
Nowadays obesity is a widespread health challenge, be it for the person, the society or the health system. Obesity is divided into different classifications using the BMI. In this study, the cutaneous microcirculation of obese patients was measured during a rehabilitation stay.
MATERIALS AND METHODS:
The study involved 25 patients, who were treated because of their obesity in rehabilitation (mean BMI of 44.75 kg/m2 (7 females and 18 males)). The 11 controls had an average BMI of 24.93 kg/m2 (3 females and 8 males). The PeriFlux 5000 by Perimed Instruments GmbH was used in order to measure the microcirculation in a skin area of about 1 mm3 on the left middle finger.
RESULTS:
The baseline LDF-value of the obese patients was at the beginning of the rehabilitation 256.73±11.64 PU and at the end at 312.46±15.51 PU. Immediately after exercise, the microcirculation decreased to a mean value of 254.57±11.67 PU at beginning of the rehabilitation. At the end, the microcirculation decreased to a mean value of 306.94±11.75 PU. The control group’s microcirculation at the baseline was at 205.2±20.91 PU and under heat provocation at 394.36±25.03 PU.
CONCLUSION:
In obese patients, it could be observed that during a rehabilitation interval of three weeks not only the body weight showed a reduction but also in parallel an improvement in cutaneous microcirculation could be seen. So stimulating und monitoring of cutaneous microcirculation may be a supportive parameter in therapeutic strategies for obese patients.
Introduction
Nowadays obesity is a widespread health challenge for humans, the society or the health system. Obesity is divided into different classifications using the Body-Mass-Index (BMI). People are generally considered obese when their body mass index (BMI), a measurement obtained by dividing a person’s weight by the square of the person’s height, is greater 30 kg/m2, with the range 25–30 kg/m2 defined as overweight [1]. Table 1 shows the classification of the WHO [1].
Obesity classification according to WHO
Obesity classification according to WHO
Various diseases and conditions, in particular cardiovascular diseases, diabetes mellitus type II, obstructive sleep apnea as well as various types of cancer are associated with excessive overweight [2]. As a result, obesity has been reported to reduce life expectancy. According to the “DEGS1 Study” from 2008-2011, two thirds of men (67%) and half of women (53%) in Germany are overweight [3]. A quarter of adults (23% of men and 24% of women) are severely overweight (obese) [4]. Looking at the EU average, 15.3% of women and 15.6% of men (15 years and older) have obesity [5]. As a result, more and more rehabilitation facilities have been set up to care for these patients. In rehabilitation clinic, patients learn how to handle the right diet, psychological factors and exercise. Not only cooking is done together and fat is consciously avoided, but nutrition seminars also take place.
Early in the last century, August Krogh already recognized that oxygen was supplied from blood to the tissues by passive diffusion and that the most likely site for oxygen exchange was the capillary network [6]. The number and distribution of capillaries in muscles with calculations of the oxygen pressure head necessary for supplying the tissue [6]. Clinical studies have shown an impairment of blood rheology, microvascular function and angiogenesis in obesity [7].
Therefore, the cutaneous microcirculation of obese patients was measured during a rehabilitation stay. The measurements were carried out under various conditions, such as a heat provocation or physical stress. The aim of this study was to check whether the rehabilitation measures can affect the microcirculation within 3 weeks.
Patients
The study involved 25 patients, who were treated because of their obesity in rehabilitation. The patients’ average size and weight was at 1.76 m and 141.40 kg at the beginning of the rehabilitation with a BMI of 44.75 kg/m2 (7 females and 18 males with a mean age of 53 years). The 11 controls had an average weight of 74.91 kg, with a size of 1.73 m and a BMI of 24.93 kg/m2 (3 females and 8 males with a mean age of 56 years).
PeriFlux 5000
The PeriFlux 5000 in combination with a Laser-Doppler-Flow (LDF)-Probe by Perimed Instruments GmbH is used in order to measure the microcirculation in a skin area of about 1 mm3 on the left middle finger. A fiber optic probe sends an infrared signal into the tissue where it will be reflected by moving blood cells causing a changed signal. A detection fiber optic probe will detect this changed signal so that the quantity of cells in the blood and their velocity can be calculated. By multiplying both with each other, the perfusion of the tissue can be determined. The measuring depth is influenced by different factors [8].
In order to measure LDF the PeriFlux System 5000 was operated in combination with the “Probe 457 Thermostatic Small Angled Probe “, both by Perimed Instruments GmbH. The probe is a Laser-Doppler-probe combined with a thermostatic probe [8]. If the laser light hits the skin, it is regained and converted into a photo stream after reflection by means of a photo detector. With the help of the heat set on the unit, the skin is heated and thus a vasodilation of the vessels induced.
The LDF-probe was fixed on the well-disinfected skin of the left middle finger with special tapes by Perimed Instruments GmbH. Interfering factors such as movements and talking had to be avoided. As soon as the preparation was finished, the LDF-baseline had to be gauged. For this purpose the individual should sit for about 1 min calmly.
Heat provocation
The device was set to 44°C, which caused a warming of the skin and a vasodilation [9]. The result was an increased microcirculation. The duration of the heat provocation was approx. 1.5 min.
Physical stress test
The individuals (patients and control group) climbed for about 5 minutes a flight of stairs in the hospital building. Subsequently the microcirculation was measured and the regeneration time (approx. 1 min) was investigated. Because of the exercise, there was a vasoconstriction and thus a decreased skin blood circulation.
Statistics
As statistical methods, mean and standard deviation are calculated and presented in charts. Besides, exponential regressions are used in order to calculate values based on measured data using Microsoft Excel. A T-test was performed as a statistical test. The p-value less than 0.05 is described as significant.
Written informed consent was obtained from each patient/volunteer before entry into the study, and the study protocol conformed to the ethical guidelines of the 1975 Declaration of Helsinki as reflected in a prior approval by the appropriate institutional review committee.
Results
Physical measurement
The patients’ average size and weight was at 1.76 m±0.104 m and 141.40 kg±19.84 kg at the beginning of the rehabilitation. The BMI was thus at 45.77 kg/m2 ±7.42 kg/m2. At the end of the rehabilitation, they showed a weight reduction to 138 kg±18.94 kg and a BMI of 44.75±7.15 kg/m2. The 11 controls had an average weight of 74.91 kg±11.17 kg, a size of 1.73 m±0.06 m and a BMI of 24.93 kg/m2±2.62 kg/m2. (p < 0.05 each)
In addition to overweight, the 25 obese patients usually had other diseases such as asthma or heart failure. Some also showed a hypertension. For example, the average blood pressure was 138/87 mm/HG±11.07/7.71, with a resting heart rate of 77±11.35 at the beginning of rehabilitation. At the end, the blood pressure decreased to 130/82 mm/HG±10.55/8.16 with a resting heart rate of 73±12.91. The blood pressure of the 11 controls was 118/77 mm/HG±7.72/8.88 with a resting heart rate of 72±12.69.
Lipid-metabolic
Triglycerides and cholesterol had decreased within the three weeks (triglycerides of 157.5 mg/dl ± 50.93 mg/dl to 152 mg/d l ± 80.57 mg/dl and cholesterol from 218.67 mg/dl ± 37.52 mg/dl to 176.36 mg/dl ± 38.88 mg/dl, Figs. 1 and 2. The hemoglobin value remained constant at 14.86 ± 1.50 g/dl within the 3 weeks of rehabilitation. The reference range was 13.5–17.5 g/dl. The hematocrit value of 43.7 ± 4.1% (at the beginning) and 44.06 ± 4.0% (at the end) remained unchanged. The reference range was 40–51%. The triglycerides of the 11 controls were 141.18 mg/dl ± 42.70 mg/dl and the cholesterol value was at 175.64 mg/dl ± 47.36 mg/dl. Hemoglobin was at 13.76 ± 1.86 g/dl and the hematocrit value was at 40.8 ± 4.9%.
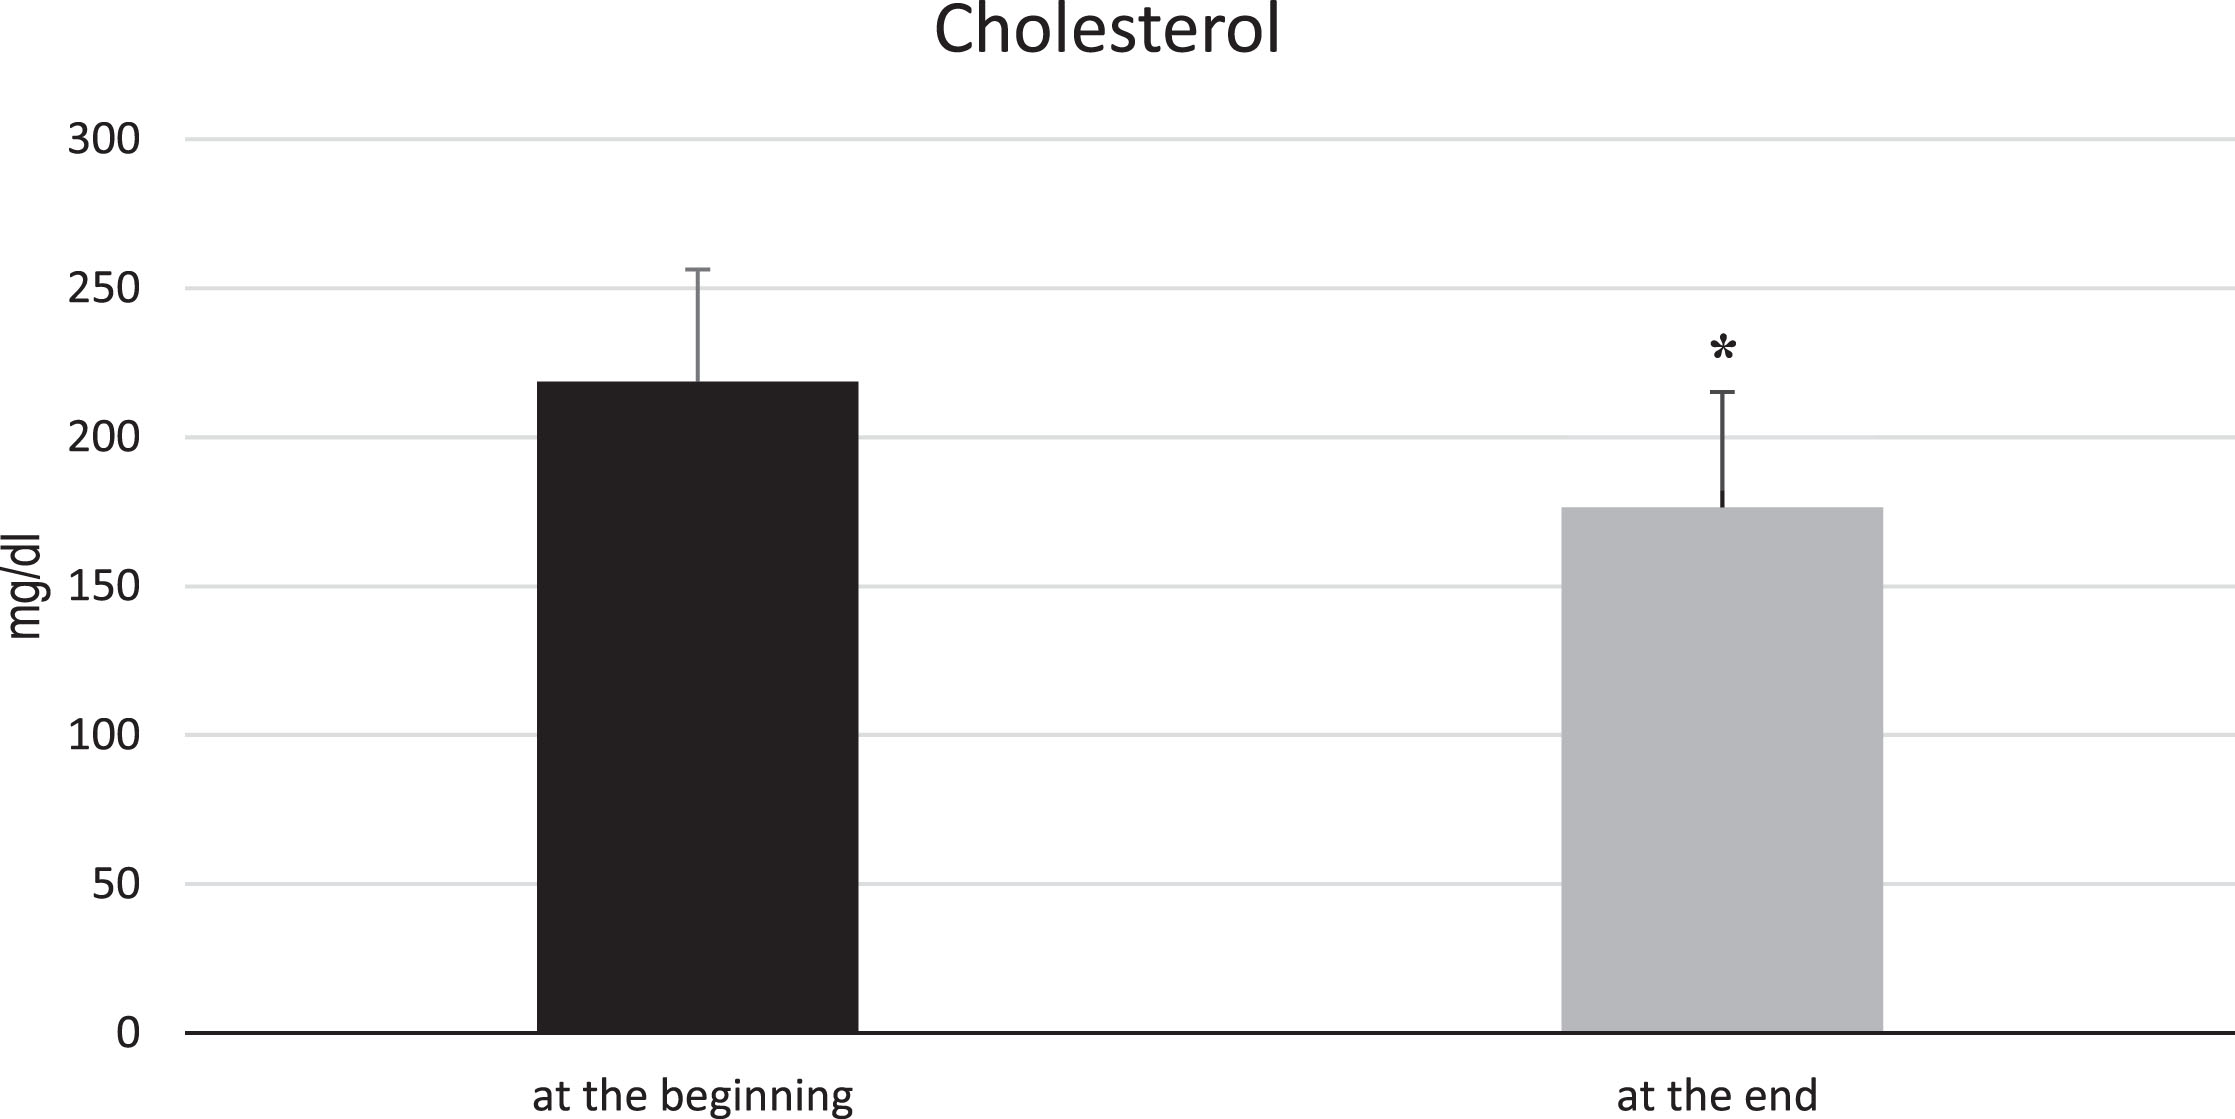
Comparison of cholesterol at the beginning and end of rehabilitation in 25 obese patients. The cholesterol level at the beginning of rehab was 218.67 mg/dl with a standard deviation of 37.52 mg/dl. At the end of rehabilitation, this value had fallen to 176.36 mg/dl, with a standard deviation of 38.88 mg/dl. The reference range was 100–200 mg/dl. For the controls, the cholesterol level was 175.64 mg/dl with a standard deviation of 47.36 mg/dl. *p-Value < 0.05.

Comparison of triglycerides at the beginning and end of rehabilitation in 25 obese patients. At the beginning, the triglycerides were on average 157.5 mg/dl with a standard deviation of 50.93 mg/dl. At the end of rehabilitation, they had decreased to 152 mg/dl. The standard deviation was 80.57 mg/dl. The reference range was > 200 mg/dl. The controls showed triglycerides of 141.18 mg/dl with a standard deviation of 42.71 mg/dl. *p-Value < 0.05.
The baseline LDF-value of the obese patients was at the beginning of the rehabilitation 256.73±11.64 PU and at the end at 312.46±15.51 PU (Fig. 3). Under heat provocation, the microcirculation was 368.40±16.38 PU and at the end of rehabilitation at 420.61±20.8 PU (Fig. 4). Immediately after the exercise, the microcirculation decreased to a mean value of 254.57±11.67 PU at beginning of the rehabilitation. At the end, the microcirculation decreased to a mean value of 306.94±11.75 PU (Fig. 5).
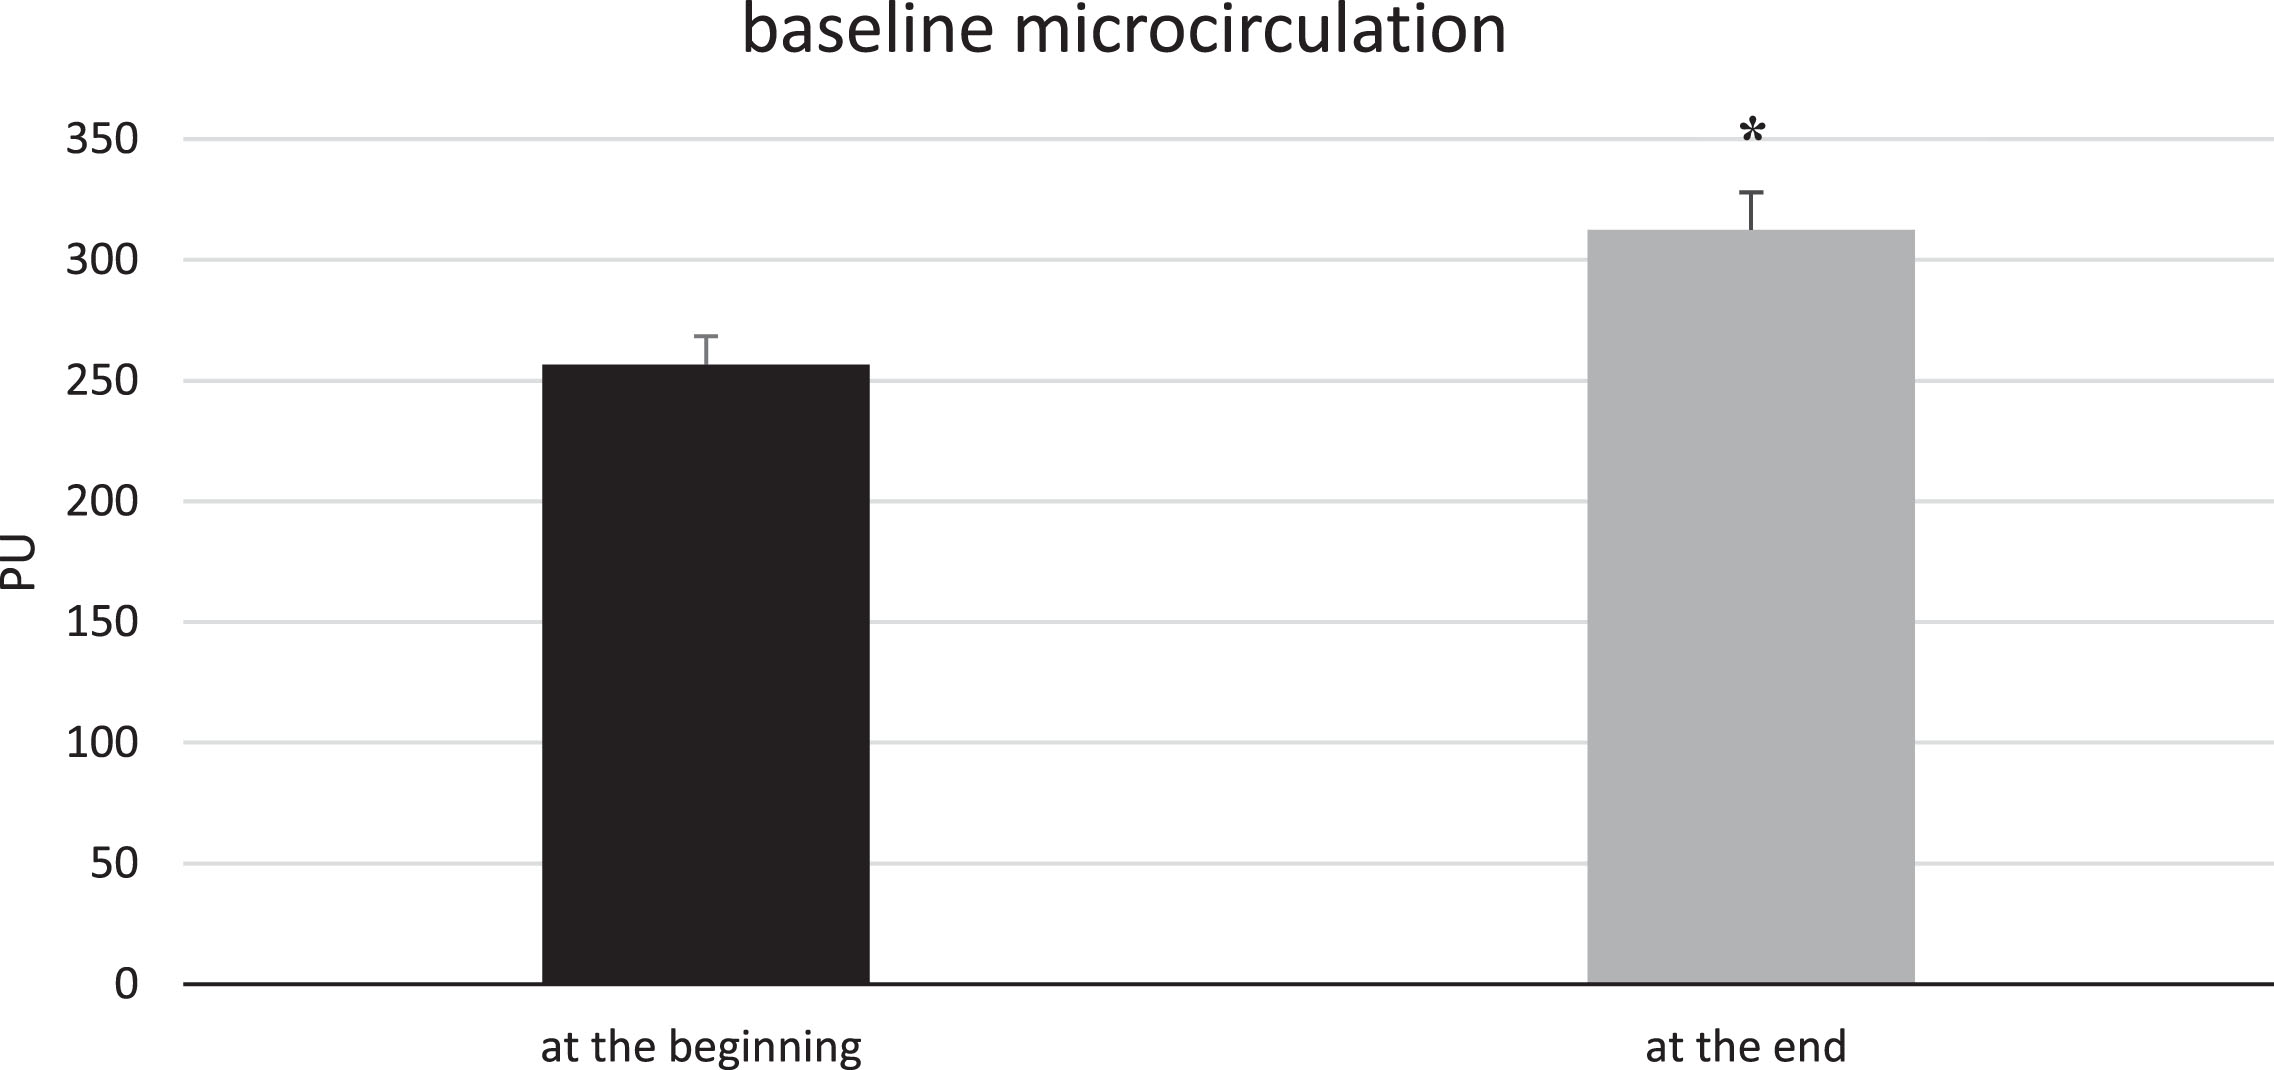
Comparison of the baseline microcirculation at the beginning and end of the rehabilitation of 25 obese patients. At the beginning of the rehabilitation, the baseline microcirculation was at 256.73 PU (black bar) and at the end at 312.46 PU (grey bar). This was an increase of a factor of 1.2. The microcirculation seems to have risen at the end of rehabilitation, but the values are only relatively considered and therefore not very comparable.

Comparison of the microcirculation of the baseline and heat provocation at the beginning and end of rehabilitation of the 25 obese patients. The black bars show the microcirculation at the beginning, the grey the microcirculation at the end. At the beginning, the microcirculation was at 368.40 PU (baseline at 256.73 PU) under heat provocation and at the end at 420.62 PU (baseline at 312.46 PU). The factor between baseline and heat were at the beginning and the end at 1.4. Comparing the heat provocations with each other, this is an increase of 1.14.
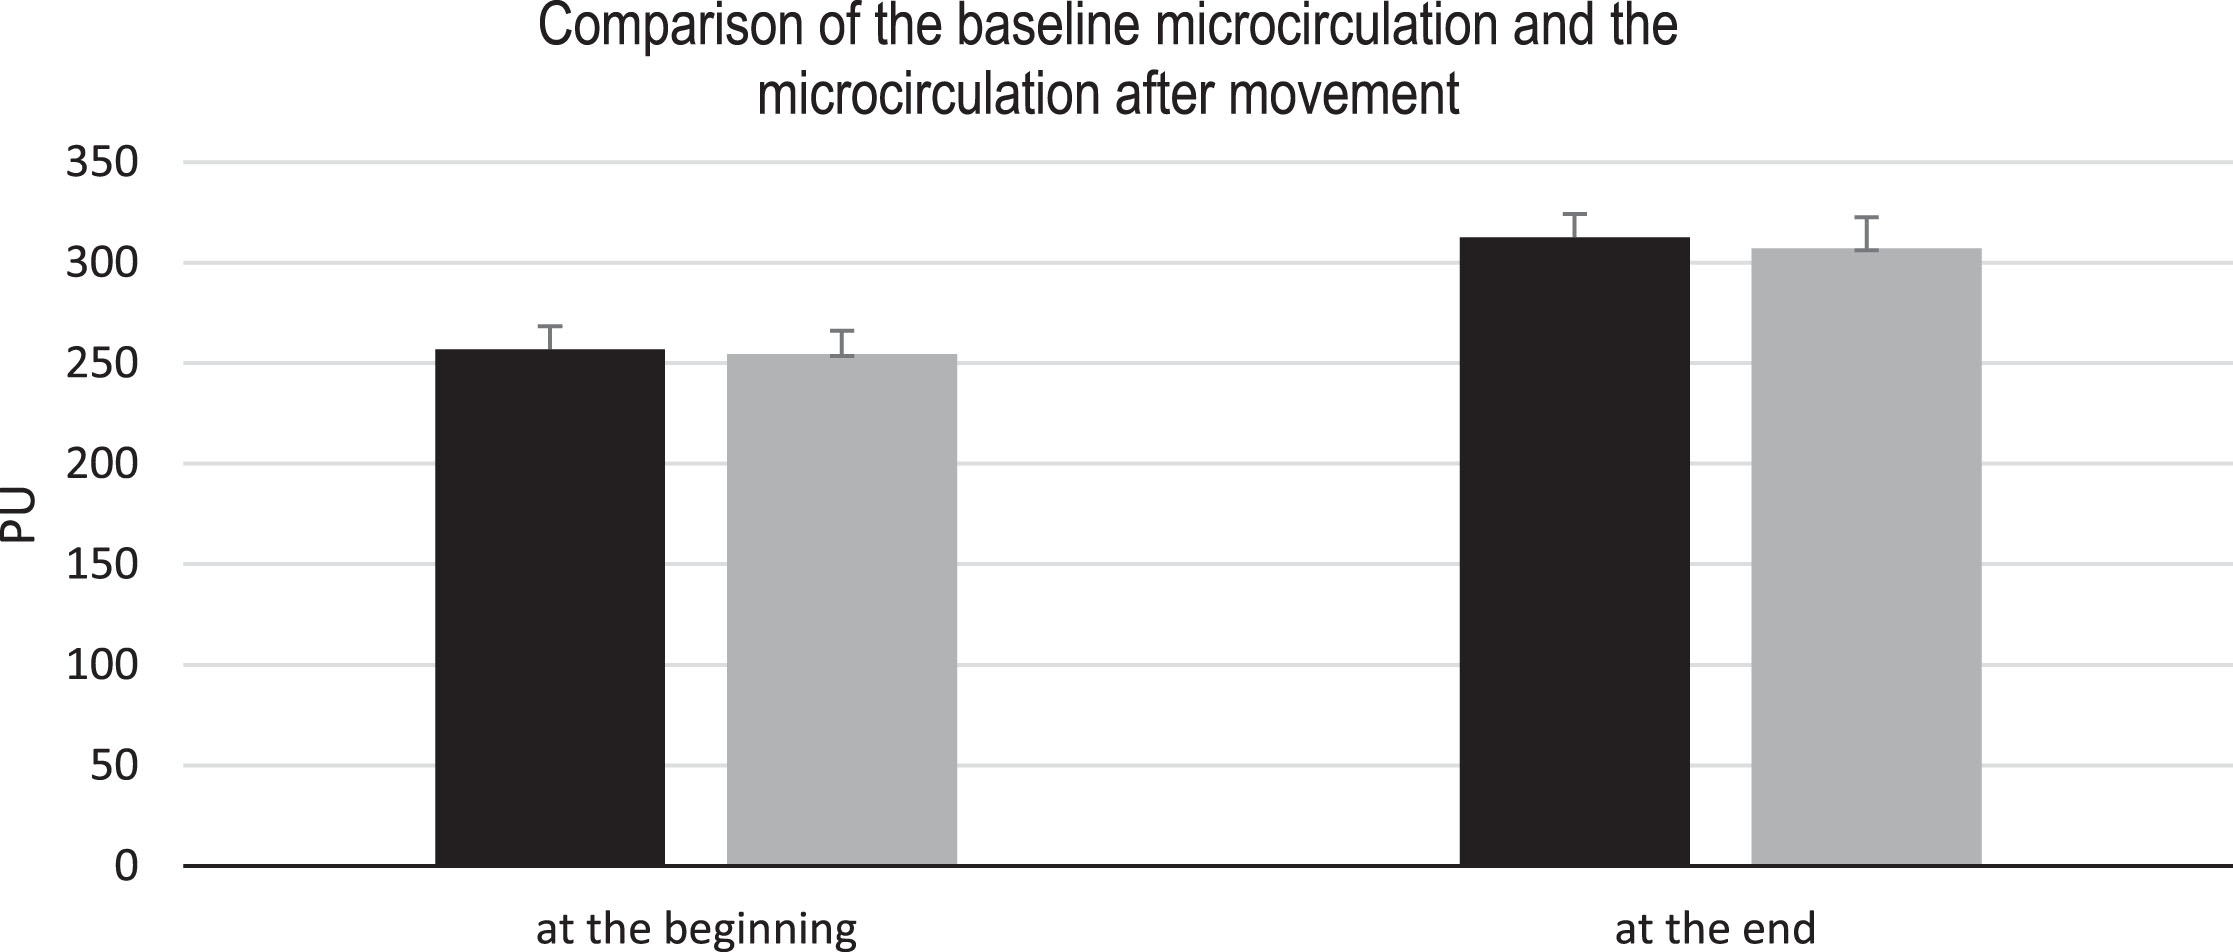
Comparison of microcirculation at baseline with microcirculation after movement at the beginning and end of rehabilitation in the 25 obese patients. The black bars represent the baseline measurements and the grey bars the motion effects. At the beginning of the rehabilitation, the microcirculation was at 254.57 PU after movement (baseline at 256.73 PU). At the end, the microcirculation after movement was at 306.94 PU (baseline at 312.46 PU). If you compare the microcirculation at the beginning and at the end in these events you get a factor of 0.99 at the beginning or 0.98 at the end.
The regeneration process was also investigated. Here, the microcirculation was at 228.99±14.17 PU at the beginning, measured at the end with 265.44±8.94 PU. The microcirculation was measured again 1 min after the exercise in order to determine a “brisk course”. Here, the microcirculation was at 238.82±13.44 PU at the beginning and at the end at 297.95±8.94 PU (Fig. 6). The control group‘s microcirculation at the baseline was at 205.2±20.91 PU and under heat provocation at 394.36±25.03 PU. After the exercise, the microcirculation decreased to a mean value of 203.93±20.95 PU. In the control group, the microcirculation was at 219 PU directly after movement, with a standard deviation of 21.83 PU and at 208.84 PU, with a standard deviation of 19.8 PU. In Tables 2 and 3, the measurements are shown for both the obese patients and the controls.

Comparison of regeneration after movement in 25 obese patients. The black bars indicate the microcirculation at the start of the rehabilitation, the grey at the end of the rehabilitation. Immediately after the movement, the microcirculation was measured with 228.99 PU at the beginning, at the end with 265.44 PU. After 1 min, the microcirculation was added again in order to determine a regeneration process. Here was the microcirculation at 238.82 PU at the beginning and end at 297.95 PU.
Comparison of the microcirculation (in PU) at different events at the beginning and after 3 weeks in 25 obese patients
The table shows a clear correlation of the microcirculation during heat provocation, both before and after movement.
Comparison of the microcirculation (in PU) in the 11 controls
This table shows an increase in microcirculation during a heat provocation. However, compared to the obese patients, the microcirculation at rest is lower.
The measurement is performed over the baseline measurement and the heat provocation at the beginning of rehabilitation, it is shown that the p-value is below 0.05. The same is true for the measurement of these parameters after 3 weeks.
When comparing the microcirculation at rest to the microcirculation at heat provocation in the 11 controls, the microcirculation at rest was 205.2 PU and at heat provocation 394.36 PU. This is a factor of 1.92 (p = 0.0017). This significant in controls over microcirculation at baseline measurement and heat provocation.
For obese patients the LDF-value did not difference for the microcirculation at baseline and the effect of movement at the beginning of rehabilitation. The same applies to the measured microcirculation after 3 weeks.
When you compare the microcirculation at baseline with microcirculation after movement in the 11 controls, the microcirculation was at 203.93 PU after movement, baseline at 205.20 PU. At baseline, the microcirculation is higher than after movement. The p-value of 0.9786 of the microcirculation from the controls at rest and the movement show no significance in the two-sided.
The regeneration time of the 25 obese patients at the beginning and end of the rehabilitation is investigated below.
In the controls, the microcirculation was immediately after movement at 219±21.8 PU. Just before heat provocation, the microcirculation was at 208.84±19.8 PU.
The LDF-values at rest at the beginning of the rehabilitation of the 25 obese patients and the 11 controls did not differ (p > 0.05) There was also no difference in the LDF-values during heat provocation in the 25 obese patients (at the beginning of rehabilitation) and the 11 controls.
The problem with the laser Doppler signal is that the backward scattered laser Doppler (LD) signal consists of two different individual signals. The number of moving particles and the velocity of the particles in the measured tissue volume determine the frequency shift and the bandwidth of the Doppler signal [10].
The cutaneous microcirculation at baseline increased within the 3 weeks of rehabilitation. However, it is noteworthy to say that resting LDF-values strongly depend from the exact site where they were measured or drug intake. In order to achieve a better comparison, provocations are used.
The regeneration seems to be associated to the physical state.
Due to the patient’s exercise the skeletal muscles will be supplied with more oxygen as the body generates a vasoconstriction of the skin's vessels by activating the sympathetic nervous system so that more blood is available in the muscles. This leads to more blood in the muscle vessels, however the blood circulation is reduced [11]. Another important part may be noradrenalin, whereof more is released during high sympatheticotonia. Additionally, more adrenalin is released during increasing physical activity and binds at β2-receptors [12]. The revision of the LDF-reduction in the skin might be an overreaction as a result on an abruptly started exercise. In order to supply the muscles with enough oxygen and maybe because of adrenalin and noradrenalin the microcirculation increases, too. The LDF of the skin might rise slightly during exercise for the purpose of dissipating heat that rises during metabolic processes [13].
Obviously the body provides more blood after the end of the exercise in order to dissipate heat by increasing the skins microcirculation [14]. With an abruptly finished exercise the necessity of supplying the muscles with more blood decreases abruptly, too. This depends on the physical condition. That means the faster the initial microcirculation is reached during regeneration, the better is the physical condition. The relationship between the time until the LDF-maximum and the initial microcirculation of people with a high physical condition is reached during regeneration might be caused by rapidly supplied blood volumes due to thermoregulatory reasons. People with a low physical condition might need blood primarily for other more important regenerative processes than for thermoregulatory processes. Studies showed dramatic microvascular changes in various diseases and especially in severe sepsis and septic shock [15]. A significant reduction in flow velocity and the density of the capillary network in septic patients was documented. Furthermore, there is a clear association with the lethality of the disease when microvascular perfusion disorders persist for more than 24 hours [16].
The fact that little attention is often paid to microcirculation in everyday clinical practice is due to several factors: On the one hand, it is often concluded that a patient who is macrocirculatory stable must also have an intact microcirculation. However, the dissociation between these two compartments is evident in many studies on regional perfusion [17]. On the other hand, monitoring the microcirculation is technically demanding and there are only a few market-ready devices. Thirdly, our understanding of the pathophysiological changes in microcirculation in the context of severe sepsis and septic shock is still very incomplete [18, 19].
The microcirculation in obesity and in controls was different than expected and therefore the microcirculation is only comparable within different measurements of a group, but not across groups. On the basis of this insight, the individual values are not clinically so relevant, but in a holistic view.
Conclusion
Overall 25 obese patients with a BMI above 30 and 11 non-obese individuals were included in the study. The latter served as control group. In addition to the weight, the blood pressure, resting heart rate, a brief anamnesis and laboratory parameters were also recorded. On the adipose patients, 2 times 6 measurements were carried out, only 1 time 6 measurements on the control group. The measurements included a baseline microcirculation as well as different provocation tests: a heat provocation of 44°C, Measurement of effect on heat provocation (44 degrees to 34 degrees), a physical stress test, a second heat provocation as well as a second Measurement of effect on heat provocation. In addition, the regeneration was investigated after the movement. The effects of the provocation tests were compared to baseline conditions (100%), so that an increase of a certain factor could be calculated. Such an increase was particularly noticeable in comparison between the baseline microcirculation and the heat provocation both at the beginning and the end of the rehabilitation. The perfusion units were slightly higher at the end of the rehabilitation.
Regeneration takes longer in obese patients compared to the control group. For the control group the load may have been too low as they show a rapid regeneration.
In order to better observe the positive effect of exercise during the rehabilitation stay, the ergometer would be the optimal solution. This type of movement would also have been more suitable for the controls, since, it seems to be too small. It would make sense to measure the body temperature before, during and after the heat provocation, as this also plays a role in the microcirculation.
In addition, the rehabilitation measures enabled obese patients to reduce weight and laboratory parameters, except haemoglobin and haematocrit.
Finally, it could be shown that the microcirculation is partially improved within three weeks due to the rehabilitation measures. In addition, the microcirculation is a suitable monitoring parameter.