
Abstract
Building energy consumption prediction per month is an important content of building energy consumption management and company’s financial budget. BP neural network with parameter optimization, network optimized by mind evolutionary algorithm, network optimized by genetic algorithm, network optimized by particle swarm algorithm and network optimized by adaptive weight particle swarm algorithm are used to forecast the energy consumption. The optimal values of the learning rate and hidden layer node number are choosen. The characteristics of various kinds of optimization algorithm are compared. The neural network optimized by adaptive weight particle swarm algorithm is proved to be the most accurate in predicting energy consumption.
Introduction
The energy consumption prediction of building energy is based on the historical data of power load and meteorology, to explore the influence of the future load on energy consumption. The problem of load forecasting involves the safety, reliability and economy of building power system, as well as the planning and design of power system. It has become important in the management of building energy consumption [1].
The mathematical statistical method performs better in predicting linear load, but it is not flexible and lacks the ability to predict nonlinear load. Artificial intelligence method includes fuzzy inference method, artificial neural network method and so on. Fuzzy reasoning requires expert to establish knowledge rules. The artificial neural network is not dependent on human experience, and the data can be obtained through training input data, and then the prediction network can be established to handle the nonlinear relationship of energy consumption better [2]. Literature 3 uses neural network model, grey models, and regression model to predict annual energy consumption, and concludes that the prediction accuracy of neural network is the highest [3]. Some literatures use the optimized neural network to predict energy consumption to achieve better results. GA-BP has better global convergence performance [11, 12, 13, 14, 15, 16], and PSO-BP has better local search capability [17, 18, 19, 20, 21]. Literature 4 uses improved particle swarm optimization to predict energy consumption per hour, and it elevates the ability of particle swarm algorithms [4]. However, the optimal value of the learning rate and hidden layer number are not selected. In this paper, the learning rate, hidden layer number, and values of weight and threshold are optimized. Five optimization methods are used to predict monthly energy consumption.
The company pays the electricity bill monthly. The analysis and prediction of monthly electricity data is also a part of the company’s financial budget. The monthly data is more deterministic than the daily data. In the absence of a significant change in staff and office environment, the same month will not change much generally. The energy consumption data of three office buildings for five years in Hefei are recorded. Four neural network optimization algorithms are used to predict power consumption over the next six months based on the data of the previous four years.
Energy consumption in the same season has similar characteristics, and most of the energy consumption in the same month is similar. When the temperature changes, the number of air conditioners is different and energy consumption changes. In summer and winter, air conditioning use increases and energy consumption increases. In spring and autumn, air conditioning use is low and energy consumption is reduced. When office personnel changes, personnel’s habit is different, open door and window habit and open air conditioning habit is different, energy consumption can have change. When people use air conditioning, open doors and Windows, have overtime hours, energy consumption increases. When personnel do not open air conditioning frequently, work overtime less, energy consumption reduces.
Design of neural network optimization algorithm
BP neural network is vulnerable to initial weights, momentum factor and other parameters, and by way of high intensity training produces the phenomenon of over fitting, which affects the generalization ability of network. So training results vary widely for many times, sometimes even do not converge.
The training process of network is as follows: initialize the connection weight and threshold, calculate the output error, and update each layer weight and threshold according to the error value. The loop is carried out until the error reaches the set value or step reaches the specified value [5, 6, 7].
The BP neural network is optimized with five optimization algorithms to improve its prediction performance in the program. Some algorithms can obtain parameter values more accurately.
BP neural network with parameter optimization (BP-PO)
The number of hidden layers and learning rate are generally based on experience and lack of basis. One optimization algorithm is used to select the optimal values of network parameters. The training number is set to 200 and the accuracy is set to 0.0001.
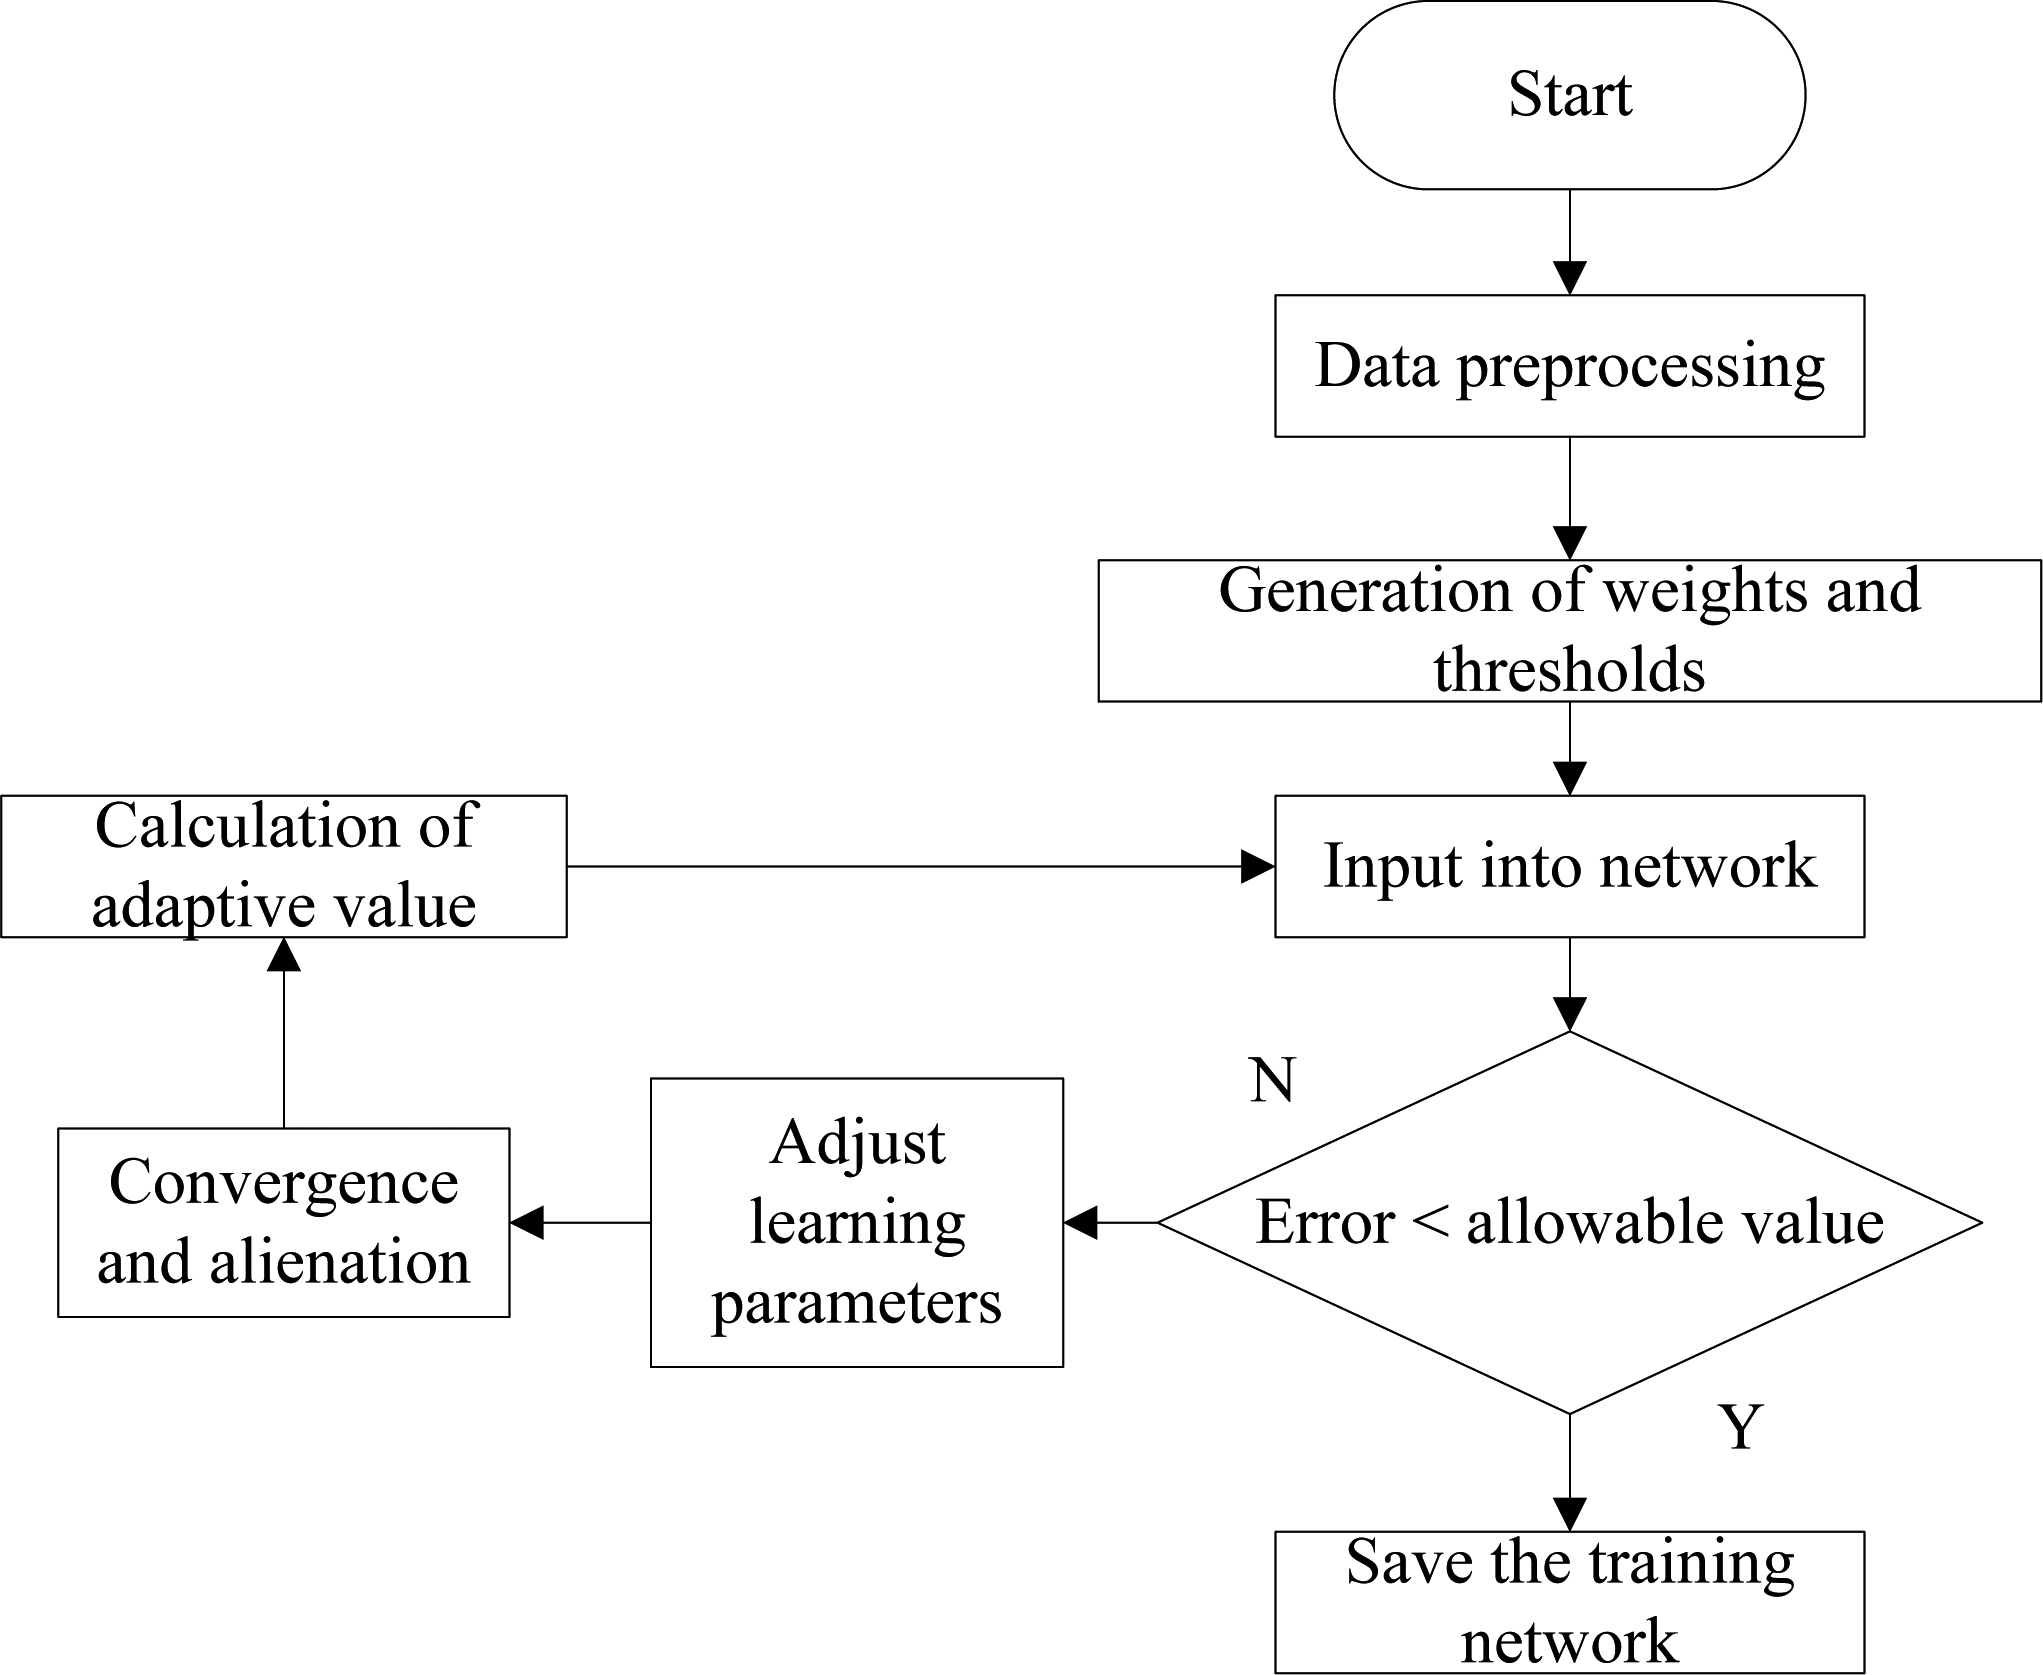
The BP neural network flow using parameter optimization is shown in Fig. 1.
Output H of the hidden layer is:
Flow chart of BP-PO program.
The prediction output of BP neural network is:
Thus, the computational network prediction error
BP-PO algorithm was used, with 80% of the data as training data, 20% of the data as preliminary testing data.
The number of hidden layer is selected from 10 to 26, with each increment of 1 in turn to calculate the accuracy. The learning rate selection is selected from 0.01 to 0.2, with each increment of 0.01, and the number of learning rate is set up in turn to calculate the accuracy. The optimal value selection process of hidden layer number and learning rate is shown in Fig. 2.
BP-PO is established by using the number of hidden node and learning rate corresponding to the highest accuracy. The algorithms described in the following sections optimizes the four parameters of
The thought evolution optimization algorithm flow is shown in the Fig. 2.
A certain scale of individuals generate randomly in the solution space, and we search for the highest scores of individual winners and temporary individuals. According to the topology of network, the solution space is mapped to the coding space. The code length
where:
Parametric optimization process, (a) vector optimization process (b) optimization process of hidden layers’ number.
Flow chart of MEA-BP program. Set the center of the superior individual and the temporary individual to produce some new individuals around each individual, in order to get a number of superior and temporary groups. The population size popsize is set as 300. The superior subgroup bestsize and temporary subgroup tempsize are set as 5 separately. Subgroup SG size is:
Take the scoring function of individual and population val.
in the formula: The convergence operation is performed within the subgroup until the subgroup matures, and the score of the optimal individual in the subgroup is used as the score of the subgroup.

When the subgroups mature, the scores of each subgroup are posted on the global bulletin board. The process of the dissimilation between subgroups is made to complete the substitution, abandonment, and individual release of the superior subgroup and temporary subgroup. The Global optimal individual and its score are calculated.
These steps are iterative to generate the optimal individual, and this is set as BP network’s weight and threshold to train network.
Genetic optimization algorithm has better global convergence performance. The algorithm flow is shown in the Fig. 3. The main optimization process is as follows:
Population initialization
The structure, weight and threshold are determined, which are given to each individual. Population number is 50. Iteration number is 150. Mutation and crossover probability are 0.2 and 0.7.
Fitness calculation
Calculate fitness value uses the function as Eq. (8).
where,
The operation selects a strategy based on the proportion of fitness, and get reciprocal of the fitness value, as shown in Eqs (9) and (10):
where,
Crossover operation uses real number encoding for individual –real crossover method. Chromosome
where,
Select the gene for mutation operation, such as Eq. (2.4):
where,
Flow chart of GA-BP program.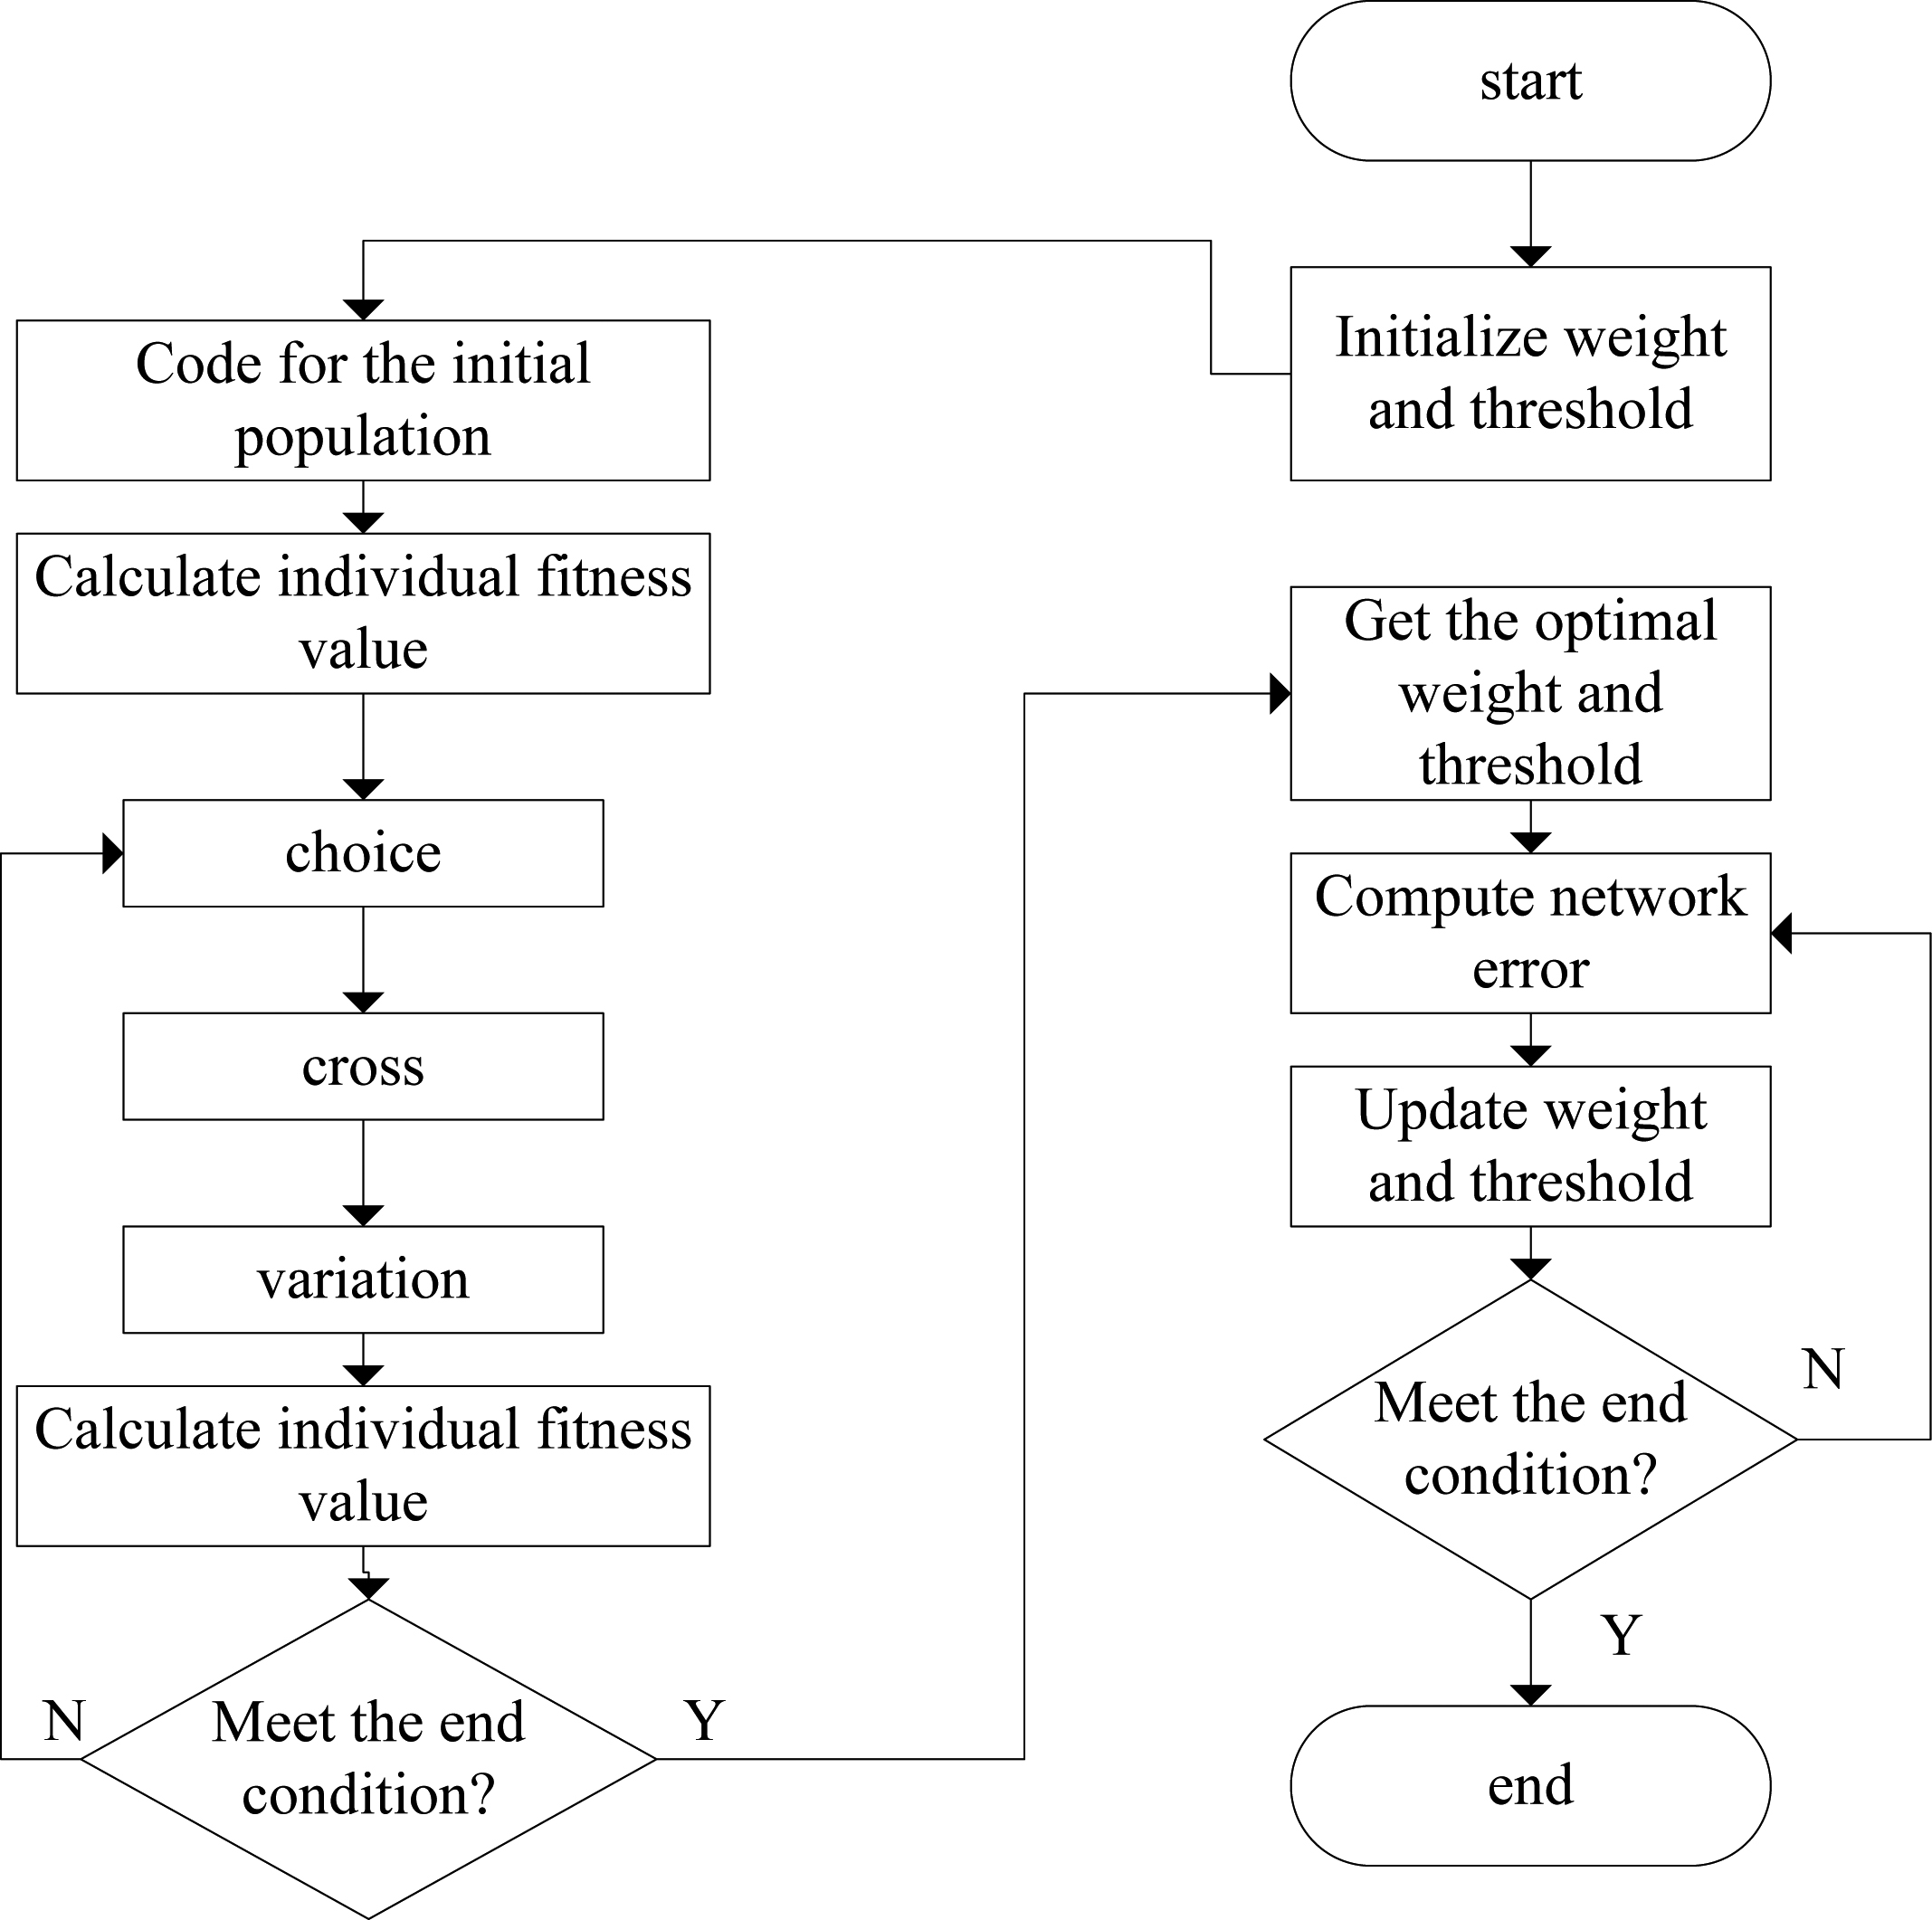
Flow chart of PSO-BP program.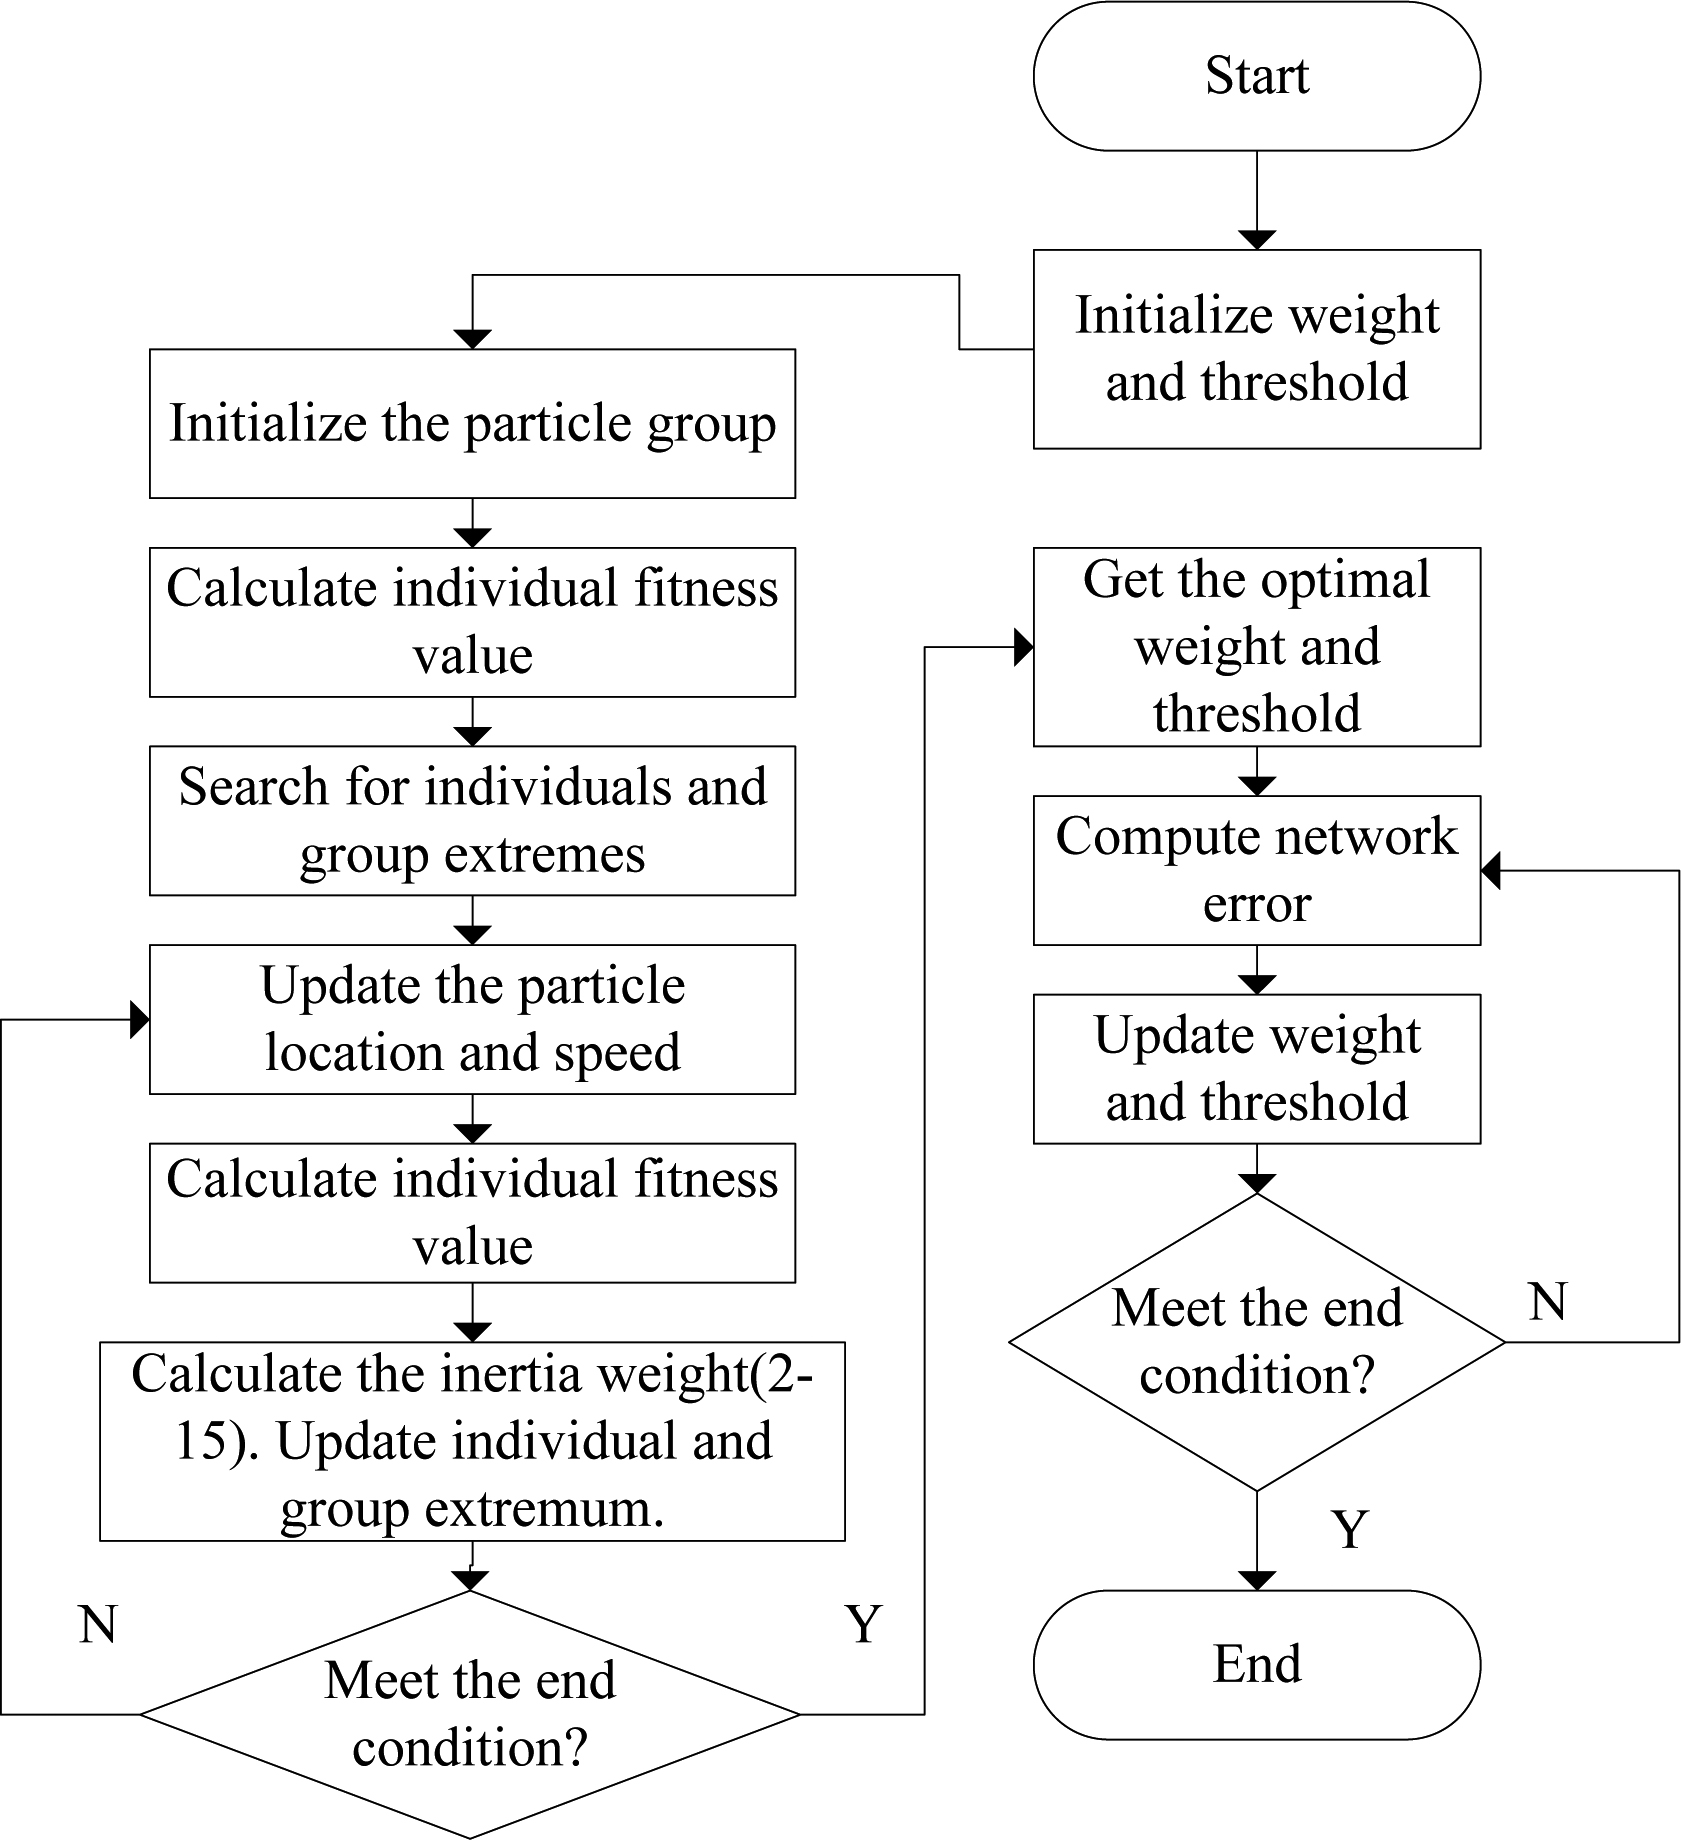
The optimization algorithm flow is shown in the Figs 4 and 5. After random initialization of particle position and velocity within the scope, through continuous iterative search, the population extremum is set as initial weights and threshold of network prediction, to improve the neural network prediction effect.
Flow chart of APSO-BP program.
The number of particles in the particle swarm is
After iteration
The weight is calculated using the linear decreasing Eq. (15) in PSO-BP, and the initial local search capability is weak. Even if the particle is close to the global best point, it will be missed. At the end of the iteration, the global search capability is weak, and it is easy to get into local optimal.
In order to improve optimization ability of PSO, the APSO-BP algorithm was used to adjust the weight using the adaptive weight Eq. (16). When the fitness function is less than the average, the target value tends to local optimum and the inertia weight is reduced. When the target value is dispersed, the inertia weight increases. When the fitness function is larger than the average, the inertial weight takes the maximum value and goes to the better search area.
The basic flow of optimization algorithm is as follows. The difference between PSO-BP and APSO-BP is in step 4 and 7.
The monthly energy consumption of three office buildings.
Build BP neural network, set up network parameters, initialize network weight and bias. Set particle swarm parameters, including: number of particles, allowable maximum iteration times, fitness error limit, inertia weight, learning factor, etc. Speed update parameter 1 is set as 1.8, update parameter 2 is set as 1.7, maximum inertia factor value is 0.93, the minimum inertial factor value is 0.5, the particle swarm size of 60, the maximum speed of 0.05, the minimum speed of 0.05, the maximum position 1, minimum position 1. Initialize the particles’ velocity and location. Calculate the fitness function value of particles. To improve the particle swarm optimization algorithm, the best value and average value of fitness function are calculated in APSO. If the particle’s current fitness value is better than its historical optimal value, the current position replaces the historical optimal. If the history of the particle is superior to the global optimal, the optimal global optimal is used for the history of the particle. Update each particle’s speed and location according to Eqs (13) and (14). The inertial weighting factor of PSO is calculated by Eq. (15). The inertial weighting factor of APSO is calculated by Eq. (16). Check whether the velocity and position of the particle are out of range, and if they are beyond range, the boundary value is used as the velocity and position of the particle. If the end condition (the number of iterations achieves a given the maximum times or meet the minimum error requirements) is met, the iteration stops, and the network outputs weights and bias, or go to Eq. (4).
Optimization algorithm predictive value and real value of energy consumption. The weight and the bias of the output are used to train the neural network, which uses LM algorithm [17, 18, 19, 20, 21].

The calculation method of prediction error is as follow:
The overall relative error calculation method is as follow:
where
Overall relative errors of optimization algorithms
The time of the different algorithms
Data collected include five years electricity consumption of buildings per month, the lowest and highest temperature monthly. The monthly energy consumption of three buildings are shown in Fig. 7. The five-year energy consumption of three buildings is shown in Fig. 7. The horizontal axis means month, a total of 60 months. The vertical axis means energy consumption, with unit of a thousand kilowatt-hours. The energy consumption of the first four months and temperature data are as input, the energy consumption of the fifth month data is as output, and the network is trained. The training network is used to predict energy consumption for the next six months. Comparing the energy consumption forecast of three office buildings with the actual energy consumption, the relative error is obtained. The overall relative errors of optimization algorithms are listed in Table 1. The time of the different algorithms is shown in Table 2. BP-PO and MEA-BP use shorter time while time of GA-BP, PSO-BP and MPSO-BP is longer. GA-BP uses longer time than PSO-BP and MPSO-BP.
The actual value, BP-PO predictive value, MEA-BP predictive value, GA-BP predictive value, PSO-BP predictive value and APSO-BP predictive value are shown in Fig. 8. The horizontal axis means month, a total of 6 months. The vertical axis means energy consumption, with unit of a thousand kilowatt-hours. The daily energy consumption may vary greatly, but the monthly energy consumption is more accurate due to the existence of homogenization error.
Using a variety of optimization algorithm of neural network to predict electricity energy consumption, forecast results and effects are compared. The overall relative error of APSO-BP algorithm is within 6%. Prediction errors of GA-BP and PSO-BP are less than 15%, and most of the errors are less than 10%. BP neural network with parameter optimization and mind evolutionary optimization algorithm are used to predict energy consumption, and the error of some predicted values is greater than 15%.
Through the figure we can see that the relative error of simple parameters optimization BP neural network and mind evolution optimization algorithm are great, the errors of GA-BP and PSO-BP are small, and APSO-BP algorithm has the smallest error.
For the first office building, the energy consumption law is stronger, seen from Fig. 7, so the error of using various optimization algorithms is small. For the second office building, the new air conditioning equipment is added in summer in the third year, and the energy consumption is high. The error of BP neural network with simple optimization is bigger. For the third office building, the staff had a large change, and the energy consumption changes a lot. The error of neural network with simple optimization is bigger. MPSO-BP prediction errors are small and it has good adaptability in the prediction experiment of these three buildings.
This article uses BP-PO, MEA-BP, GA-BP, PSO-BP and APSO-BP to forecast Electrical energy, and compared the characteristics of various kinds of optimization algorithm. The study rate, the hidden layer number, weights and thresholds of BP neural network are optimized.
The main innovation points of this paper mainly include the following two points.
This paper presents automatic optimization algorithm of the learning rate and hidden node. A particle swarm optimization algorithm with adaptive change of inertia weight is proposed, which improves the prediction accuracy obviously.
From the results, using BP-PO, the error of energy consumption prediction is maximum. GA-BP and PSO-BP have better search capability with higher accuracy. APSO-BP algorithm is the best to predict energy consumption. APSO-BP algorithm is effective in overcoming the disadvantages of BP neural network, which greatly improves the network performance and prediction accuracy, and is applicable to building energy consumption monthly prediction.
Footnotes
Acknowledgments
This research was funded under the programs Anhui University Natural Science Research Project Funding (KJ2016A156) and National Natural Science Foundation of China (61273323).