
Abstract
Considering the complexity of diagnosing lung cancer, a novel neighborhood covering algorithm based on the stages and diagnosis of lung cancer was put forward. The paper used to process a quantity of data, 1074 cases of lung cancer diagnosed from 2013 to 2017 in the Second Hospital of Anhui Medical University. Modeling and processing the data set by using the improved neighborhood covering algorithm, so as to mine and use the potential information in the data set as much as possible. The Objective is to predict the lung cancer patients reasonably. Experimental results show that the improved algorithm is effective in lung cancer staging prediction, and has faster training speed and better performance. The new method for staging diagnosis of lung cancer and a new reference for the clinical treatment of lung cancer research is provided.
Introduction
Lung cancer is a kind of malignant tumor which severely threatens human health and life in today’s the world, and the morbidity is still on the rise in many countries. In recent years, in many large and medium cities of China, due to industrial development, environmental pollution and haze, lung cancer morbidity ranks the first among all malignant tumors. The long-term survival rate of lung cancer is extremely low and the five-year survival rate of China was about 8% in 2002 according to the report; moreover, lung cancer has become the first malignant tumor death cause in China and the morbidity and mortality keep rising quickly. In the past three decades, the lung cancer morality has increased by 465% and the morbidity rises by 26.9% every year. According to the prediction of WHO, by 2025, the number of Chinese lung cancer patients will reach one million and China will become the world’s first lung cancer country [1, 2].
Lung cancer is divided into small cell lung cancer and non-small cell lung cancer which have completely different stages. Staging diagnosis is key to successful treatment. From the perspective of clinical diagnosis, lung cancer staging and clinical diagnosis prediction is divided into two methods: first, staging of non-small cell lung cancer, TNM staging method [3] being adopted in the world; second, staging of small cell lung cancer, “limited stage” and “diffusion stage” being divided for small cells. In literature [4], the author proposed a 2D motion prediction algorithm for lung tumors applied to dynamic MRI images that combines interactional tumor deformations. The algorithm evaluates uniform and patient-specific margins about the gross tumor volume to optimize the tumor coverage. O’Connell et al. [5] put forward a model that uses PET-CT N stage, patient age, location of the tumor (central vs. peripheral), and histology was able to accurately predict the probability of N2 or N3 disease being identified by EBUSTBNA in patients with NSCLC. Xu et al. [6] and Wu et al. [7] analyzed MRI features of lung cancer, and explored the application value of MRI in lung cancer diagnosis and TNM staging.
The above methods are based on clinical experience to judge and predict staging without considering numerous factors influencing lung cancer diagnosis and their mutual influences. Besides, there are many studies on computer-aided diagnosis systems such as decision-making tree and neural network approach, KDD technology, Logistic regression analysis, Bayesian theory, KNN classification method and Fisher linear discriminant analysis, etc. [8, 9]. All these methods are about application of data mining technology in lung cancer diagnosis but fail to take into account influences of multiple-factor and invisible factors over lung cancer diagnosis in clinical diagnosis.
In recent years, the kernel function method has become a research focus of machine learning. It is a relatively complete system method to find rules from small sample data, which is mainly used to solve the pattern recognition and classification problem of limited samples. But the SVM Kernel function method is difficult to determine Kernel function parameter. The problem of high computational complexity fails to obtain the solution of the breakthrough. In this paper, improved neighborhood covering algorithm (Constructive Kernel Covering Algorithm) is applied in predicting lung cancer staging. The kernel function method is combined with the covering algorithm of constructively learning. This paper proposes heterogeneous data sets of kernel cover lung cancer staging prediction method, and overcome the shortcomings of the kernel function of SVM method. This method ensures that the algorithm still has better classification accuracy and less computational cost in the case of insufficient prior knowledge and small samples. The aim is to make lung cancer stage have better prediction effect. Finally, the paper set up a lung cancer stating diagnosis prediction model and tests prediction effect, and providing valuable references for lung cancer clinical diagnosis.
Sphere domains and projection map of sample points.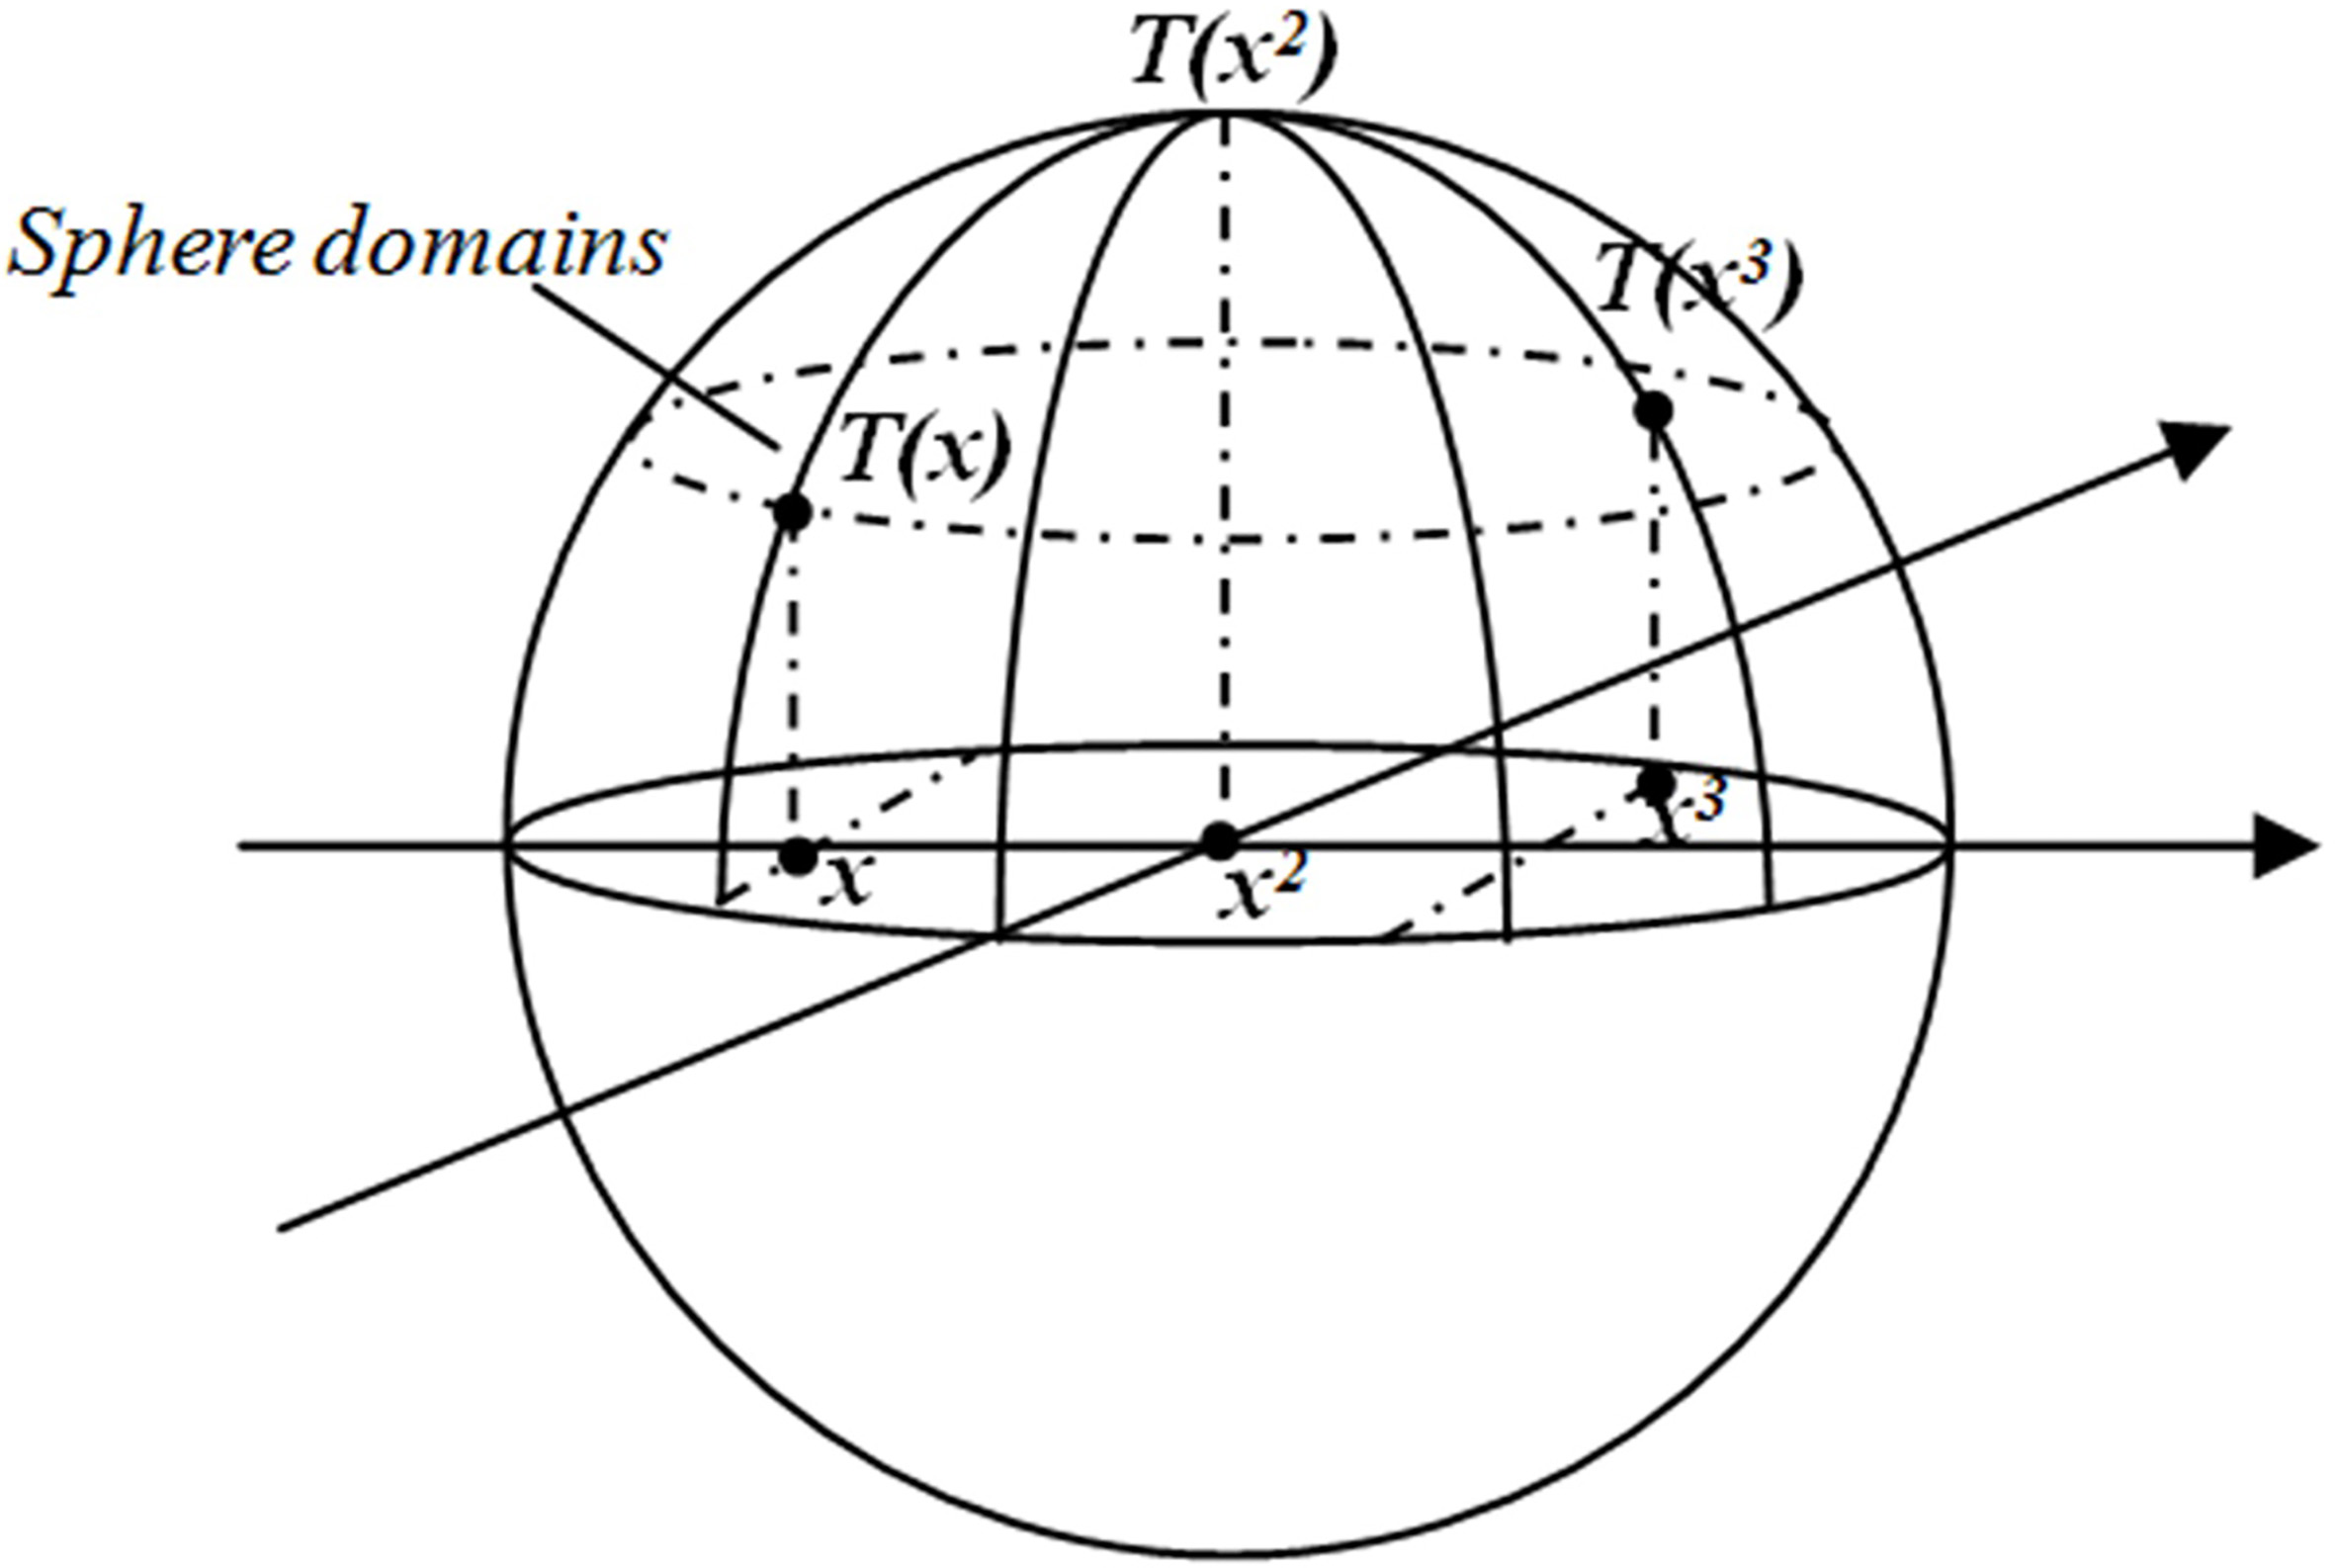
Covering algorithm
The covering algorithm (CA) was proposed by Professor L. Zhang and B. Zhang, which provided a new method for classified machine learning [10, 11]. The algorithm and a series of improved algorithms have been successfully applied in many aspects such as intrusion detection [12, 13], email filtering [14, 15], signal style identification [16], financial prediction [17] and vehicle license plate recognition [18]. Literature [19] echoes nerve cell and the sphere field on the surface to constitute a neural network and thus realize the design of classifier [11], as show in Fig. 1. This paper, based on covering algorithm theory, proposed to separate samples of the same kind through spherical projection from low-dimensional space to high-dimensional space and hyper plane and realize lung cancer staging prediction and diagnosis so as to open up a brand new research field in lung cancer clinical diagnosis.
Algorithm improvement measures
In literature [11], take two types of learning samples for example. They are classified by the general domain covering algorithm. Formula is as follows:
To calculate the threshold
Compared with the algorithm in reference [17], the threshold is reduced. The sample points in each type of spherical field unchanged, but the radius is reduced to the minimum in Fig. 2c. The algorithm improvement measures can avoid the situation in Fig. 2b. The training sample can correspond to a unique spherical field.
(a) The general coverage algorithm separates two types of samples; (b) The general covering algorithm separates three types of samples; (c) The improved neighborhood coverage algorithm separates three types of samples.
To improve covering algorithm is to project plenty of sample data onto the high-dimensional spherical field, then obtain samples of the same kind on the hyper plane of the spherical field and realize lung cancer diagnosis prediction staging. Detailed algorithm is as follows:
Initializing suppose the input set
Suppose
Suppose the input patient training sample set is The maximized norm of samples in the sample set is The patient sample set A sample point Minimum value of heterogeneous distance: Maximum value of homogeneous distance: Center of the optimal classification facet: Radius of the optimal classification facet (the threshold
Covered points in
The algorithm covers all samples, with
In the lung cancer staging diagnosis prediction test experiment, the training sample dataset and test sample dataset were respectively and randomly selected out of sample data on 1074 cases. If a test sample belonged to the spherical field with categorized coverage of a certain training sample, the test sample was divided as such; otherwise, the test sample couldn’t be divided into any spherical field and be marked as “rejection” [20, 21].
Compared with SVM algorithm, this algorithm has the following features:
For any given sample set, the algorithm can construct a kernel function that can be accurately divided into sample sets at one time. The general coverage number of SVM is much less than the number of sample points, and the calculation is very large. The algorithm is less calculation than SVM. After the first covering, the optimal solution can be solved on this basis, which is much faster than the initial solution from any given initial point.
It’s easier to build a classifier with covering algorithm so prediction of lung cancer staging diagnosis is mainly demonstrated in the following process: firstly, learning dataset on lung cancer diagnosis indexes, factors and symptoms, applying the lung cancer classification level in medical field, correctly categorizing obtained results and realizing data classifier; second, analyzing later-stage data on feature attributes, comparing them with data which has been correctly classified, categorizing them correspondingly and completing prediction [22, 23]. Data processing through covering algorithm can transform prediction of high-dimensional attribute goal results with difficulty in confirming lung cancer level into data which is easy to predict with low-dimensional feature attributes so as to compare them with data in the classifier and predict the results.
The raw data of characterizing attribute in stages and diagnosis of lung cancer
The raw data of characterizing attribute in stages and diagnosis of lung cancer
This paper regards lung cancer diagnosis results from December, 2013 to December, 2017 provided by the Respiratory Medicine of a level three and class A hospital in Anhui as its experiment data to test the diagnosis ability and effect of the covering algorithm in case of its application in lung cancer diagnosis.
The experiment data is the data in “56 Lung Cancer Characteristic Quantity Data” (see Table 1) which is preprocessed data on lung cancer patients in the past seven years sorted out by the Respiratory Medicine of a hospital in Anhui. It contains 56 indexes of 1,074 cases in the past five years. The data is used in the covering algorithm to gain data on feature attributes. Fifty-six indexes include the following items: gender, age, occupational danger, smoking history, family medical history, air pollution, indoor environmental pollution, nutrition status, genetic factor, chronic lung disease, sixteen clinical features (coughing, hemoptoe, stridor, choking sensation in chest, anhelation, chest pain, precava blocking, compression esophagus, etc.), four diagnostic imaging items (chest X-ray, chest CT, MRI and hepatobiliary scintigraphy), fifteen pathological examination items (exfoliative cell examination of sputum, transbronchial lung biopsy, alveolar wash, skin lung biopsy, pleural biopsy, pulmonary lesion or metastases needle aspiration examination under ultrasonic guidance, etc.), eight cancer markers examination (tissue polypeptide antigen, carcino-embryonic antigen, squamous carcinoma antigen, CYFRA21-1 and neuron specific enolase, etc.) and three lung cancer examination items, etc. The calculation decision-making attributes for lung cancer staging diagnosis compromises primary tumor maximum diameter, lymphatic metastasis and distant metastasis. See Table 2.
The raw data of decision attribute in stages and diagnosis of lung cancer
The raw data of decision attribute in stages and diagnosis of lung cancer
See Fig. 3 for the application of covering algorithm for data processing in lung cancer diagnosis analysis.
Data processing of covering algorithm.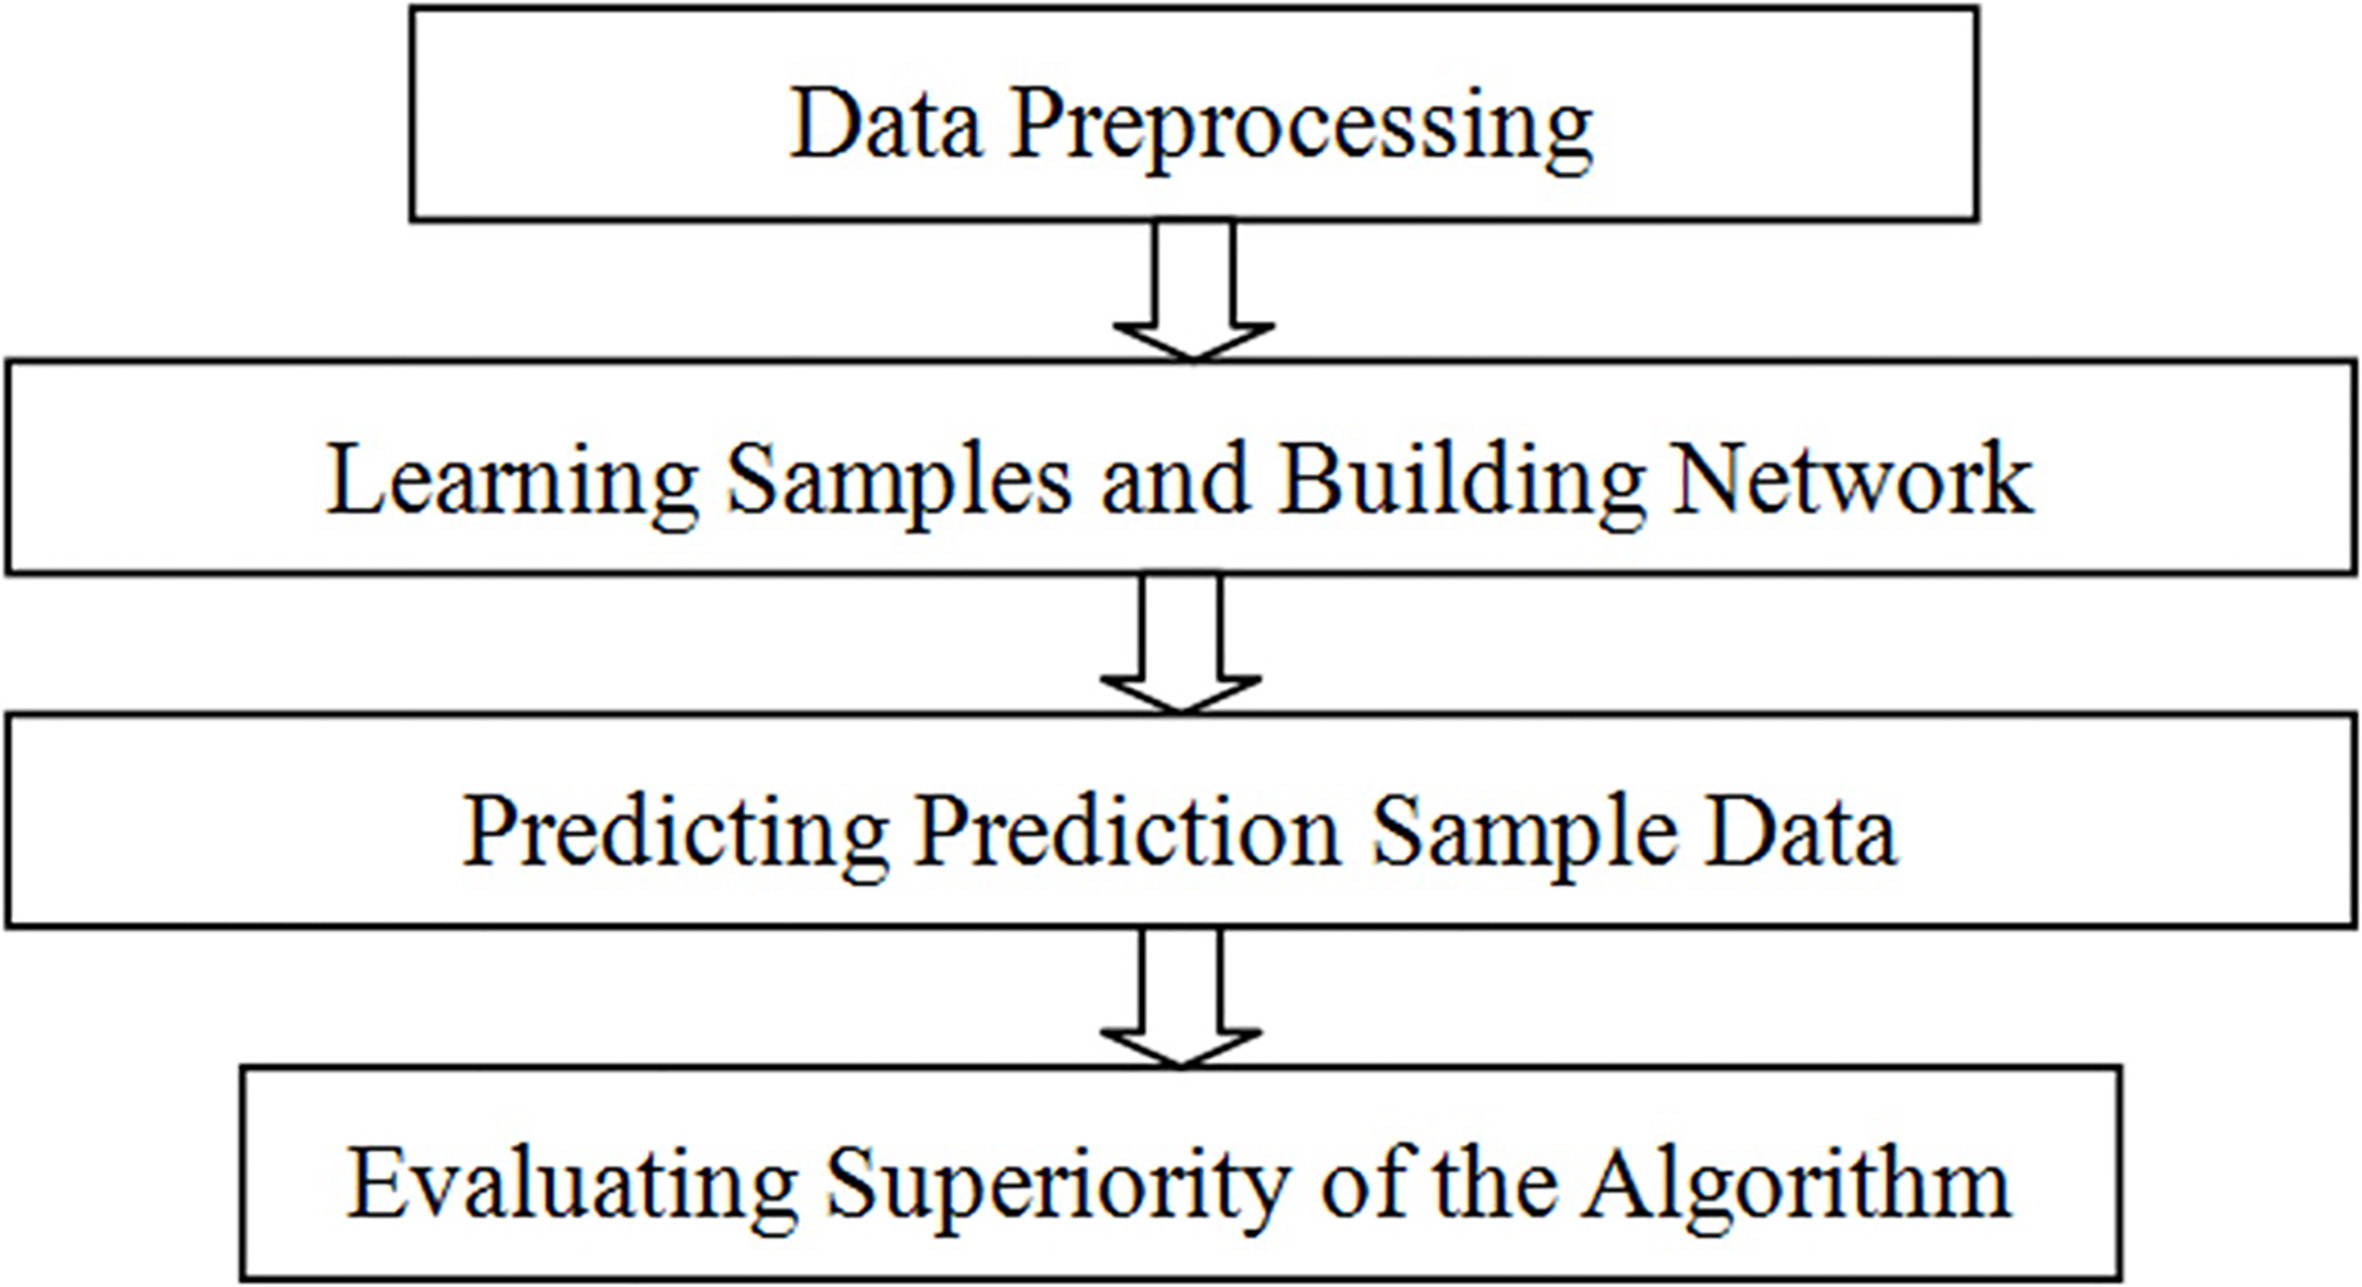
Feature extracting is conducted for general records about 56 indexes of patients and data of lung cancer staging in the same level is covered. In case of network identification, the network will conduct feature extracting on the general records about 56 indexes of a given patient, then identify and categorize such features to obtain the lung cancer staging level for prediction. Detailed processing of 56 indexes is as follows: Step 1, confirming feature attributes of samples, that is, input vector in the covering algorithm, and decision-making attributes, that is, categorization in the covering algorithm; in the experiment process, 56 indexes of 1074 patients influencing lung cancer staging (1,074
In the experiment, in order to conduct lung cancer diagnosis prediction for patients, feature attributes which determine lung cancer staging need to be sorted out: merging 1,074
Due to individual difference of patients, differences exist between patients’ primary tumor size and status T (staging: T
The standard of stages and diagnosis of lung cancer
Thereinto: referring to lung cancer TNM staging standards for judgment of different stages for primary tumor size and status T, regional lymphatic metastasis status N and whether distant transfer M or not; processing original data on decision-making attributes in Table 2 with application of division standards in Table 3 to gain decision-making attributes in Table 4. After processing, the distribution of sample data is obtained in Table 5.
The decision attribute
The distribution of training samples
Lung cancer patients go for clinical examination and diagnosis after having obvious chest pain and it’s usually middle and late period, that is, II stage, III stage or IV stage in the staging division so clinical sample data concentrate on these three stages. In the experiment process of this paper, three different combinations are selected for multiple tests. Combination I: 799 samples in hidden stage, 0 stage, I stage, II stage and III stage are selected in the experiment and 275 samples in IV stage are chosen as test samples; combination II: 594 samples in stage II and stage III are selected as training samples, and 480 samples in hidden stage, 0 stage, I stage and IV stage are selected as test samples; combination III: 662 samples in stage III and stage IV are selected as training samples, and 412 samples in hidden stage, 0 stage, I stage and II stage are selected as test samples. The network is set based on the covering algorithm for lung cancer staging diagnosis and repeated test is conducted on prediction samples. See Table 6 for test results. See Table 7 for the identification result performance comparison of other classifiers. All experiments are conducted under the programming environment of MATLAB 2017 with CPU as Intel I7 3.6 GHz and a memory of 8.0 GB.
The test results of improved neighborhood covering algorithm (ICA)
The test results of improved neighborhood covering algorithm (ICA)
The recognition result of other classifier
Recognition rate of different classifiers.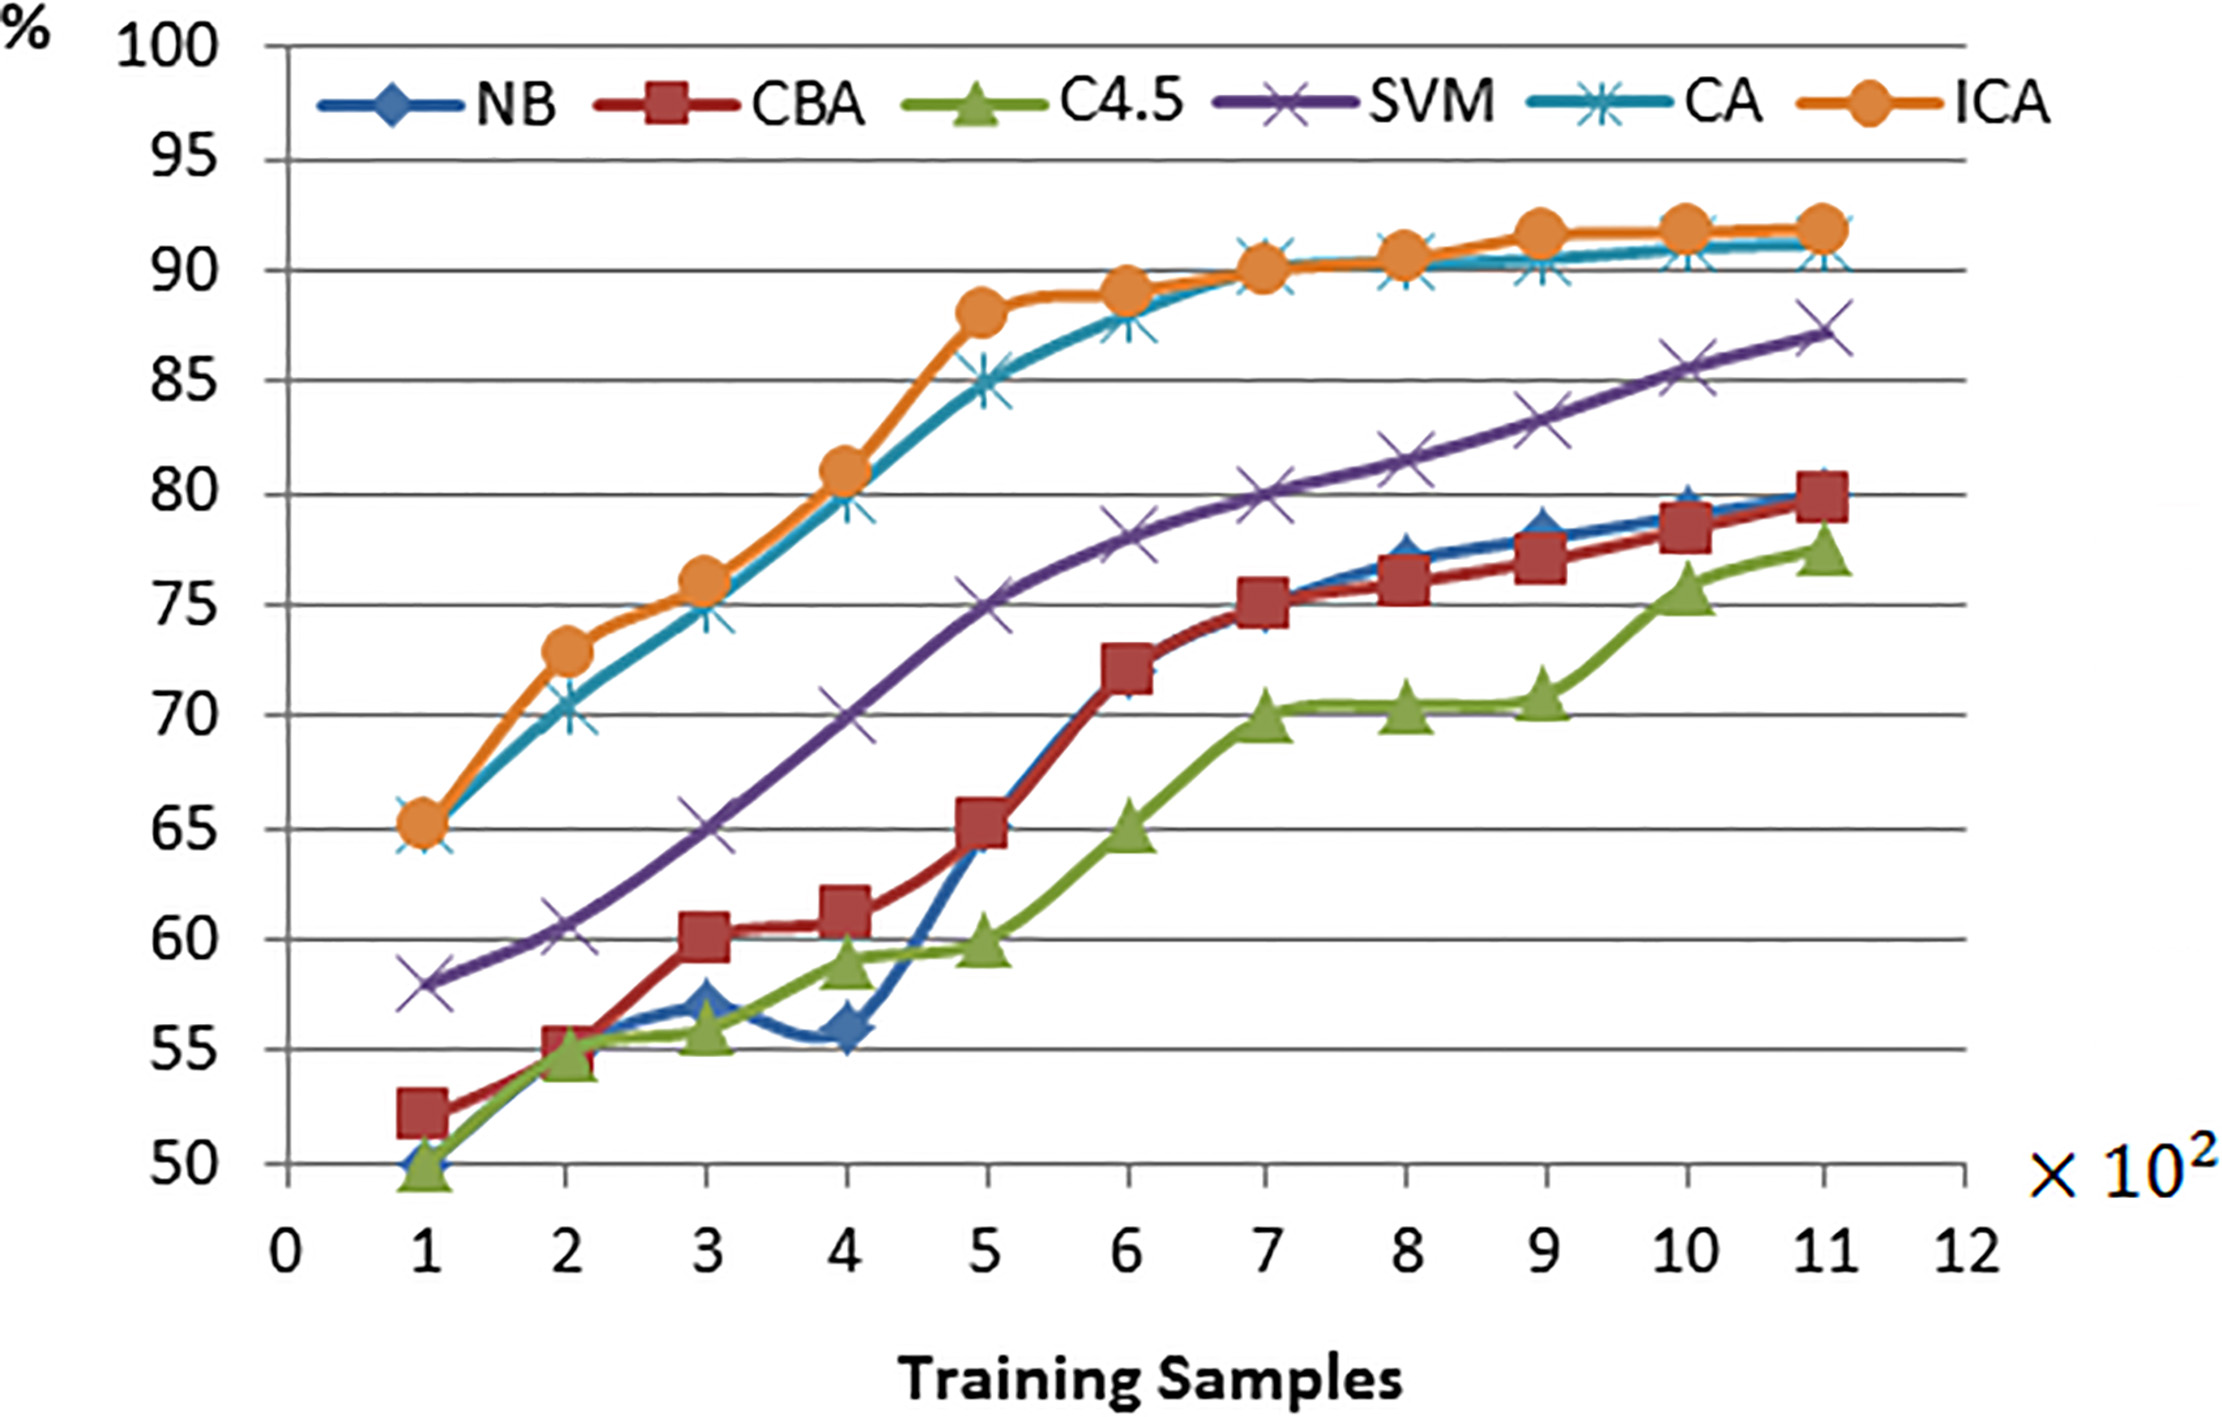
In terms of identification result performance comparison between other classifiers in Table 7, four typical classification algorithms are selected, respectively: NB, Naive Bayesian Classifier [24]; CBA, classifier based on association rules [25]; C4.5, decision-making tree classifier proposed by Quinlan [26]; SVM, support vector machine [27]. Results in classifiers in Table 7 and Fig. 4 are all average accuracy.
Experiment results show that in case of improved neighborhood covering algorithm application in feasibility, effectiveness and superiority of lung cancer diagnosis staging prediction, all prediction results have an accuracy rate of over 90% after repeated experiment, which is high practical value for clinical analysis and diagnosis of lung cancer.
With improved neighbor-hood covering algorithm principles is the theoretical instruction in the paper, and lung cancer diagnosis data from December, 2013 to December, 2017 of a certain hospital in Anhui as the experiment case, modeling and analysis are conducted to fully explore and use hidden decision-making information in mass data to analyze and predict lung cancer staging diagnosis. The experiment results find that the application of improved neighborhood covering algorithm in lung cancer staging diagnosis analysis can bring about more satisfying prediction results and help lung cancer patients with further clinical treatment. It provides a brand new method for lung cancer staging diagnosis and a brand new research model for clinical research, and is high practical clinical value.
By comparison with other classification algorithms in terms of efficiency and precision, improved neighborhood covering algorithm has obvious advantages. However, the experiment results also show that high classification precision is obtained, and meanwhile it increases expenses in the test time of training samples.
Conclusion
Lung cancer is one of malignant tumors which cause the severest harm to human health and life. With expedited industrialization of China and increased in smoking rate, lung cancer morbidity is rising quickly in China and lung cancer has become the first cause for malignant tumor death of Chinese urban population. In clinical diagnosis, diagnosis of lung cancer staging is crucial to clinical treatment. Considering great individual difference in lung cancer patients and numerous factors influencing diagnosis, certain error exists in clinical diagnosis. The paper goes beyond the conventional TNM staging prediction thought, applies the improved neighborhood covering algorithm in lung cancer staging prediction in a pioneering way. Experiment results demonstrate the superiority of feature attributes and decision-making attributes in the algorithm and provide brand new research reference value for lung cancer clinical treatment research.
Footnotes
Acknowledgments
The authors would like to thank the National Nature Science Foundation of China (Grant No. 61372137), Key Disciplines of Hefei University (2018xk03), the Natural Science Foundation of Anhui Provincial Education Department (No. KJ2015A164, KJ2016A608), the Quality Engineering Project of Anhui Province (No. 2015sxzx018, No. 2015ckjh062, No. 2016jyxm0884, No. 2016jyxm0873, No. 2017jxtd035, No. 2018hfjyxm05, No. 2018hfmooc05) for financial support.