
Abstract
In the design of the single board of mobile communication, isolator is often used in between the amplifier stage and the drive stage to enhance the interaction between circuits and to improve the adjacent channel power ratio (ACPR) of power amplifier channel and other wireless performance indexes. In this paper, the one way analysis of variance (ANOVA) was used to study whether there is indicator difference in single board when using different isolatorfirstly. Then, the regression analysis method was employed to verify the correlation between
Introduction
The vender provided 6 groups of isolators, TYPE1
Objective
Apply the one way analysis of variance (ANOVA) to study whether there is index difference among the TLPB single boards with different isolators; Use the regression analysis method to verify whether there is certain relationship between the parameters S11 and S12 of isolators [6] and the ACPR of the single board of radio frequency power amplifier (i.e., to study the correlation between One way ANOVA [8, 9] is a statistical method to compare the mean difference between two groups or above. Regression analysis [10, 11, 12] is a method which, based on a group of data, determines the functional relation among variables and tests statistically the credibility of the relational expression. It has been widely employed for empirical formulas and determining the best production conditions.
Hypothesis test
Propose the null hypothesis Stability analysis to the measured data; Normality analysis to the measured data; Equal variance analysis to the measured data; Make 1 way ANOVA analysis; Make statistical decision.
Make data analysis of residual and relativity; Obtain the conclusions.
Testing chart of the tested object.
Testing chart of ACPR indexes of single board
Testing chart of the tested object is shown in Fig. 1. Brief explanation: operations on production line are to control the spectrum analyzer and signal sources through background computer software, and test automatically the ACPR indexes of the single board of radio frequency power amplifier, thus data acquisition has nothing to do with human factors.
Data acquisition
There are 6 types of isolators: TYPE1
For simplification, we only analyzed the ACLR (Adjacent Channel Leakage Ratio) of frequency point 2017 MHz.
Data stability test.
Propose the hypothesis testing proposition
Firstly, it can confirm that all data have been acquired under exactly the same testing conditions (including environment and testing method) based on testing at production line, which is to say, the MSA (Measurement System Analysis) [4] meets the requirement. Therefore, we assumed that:
Null hypothesis
Alternative hypothesis
We set significance level
For simplification, we have only drawn the figure of TYPE1 in terms of stability and normality by Minitab [14, 15, 16], because it is similar to those of TYPE2
P_value of TYPE1–6
P_value of TYPE1–6
Data normality test.
Data variance consistency test.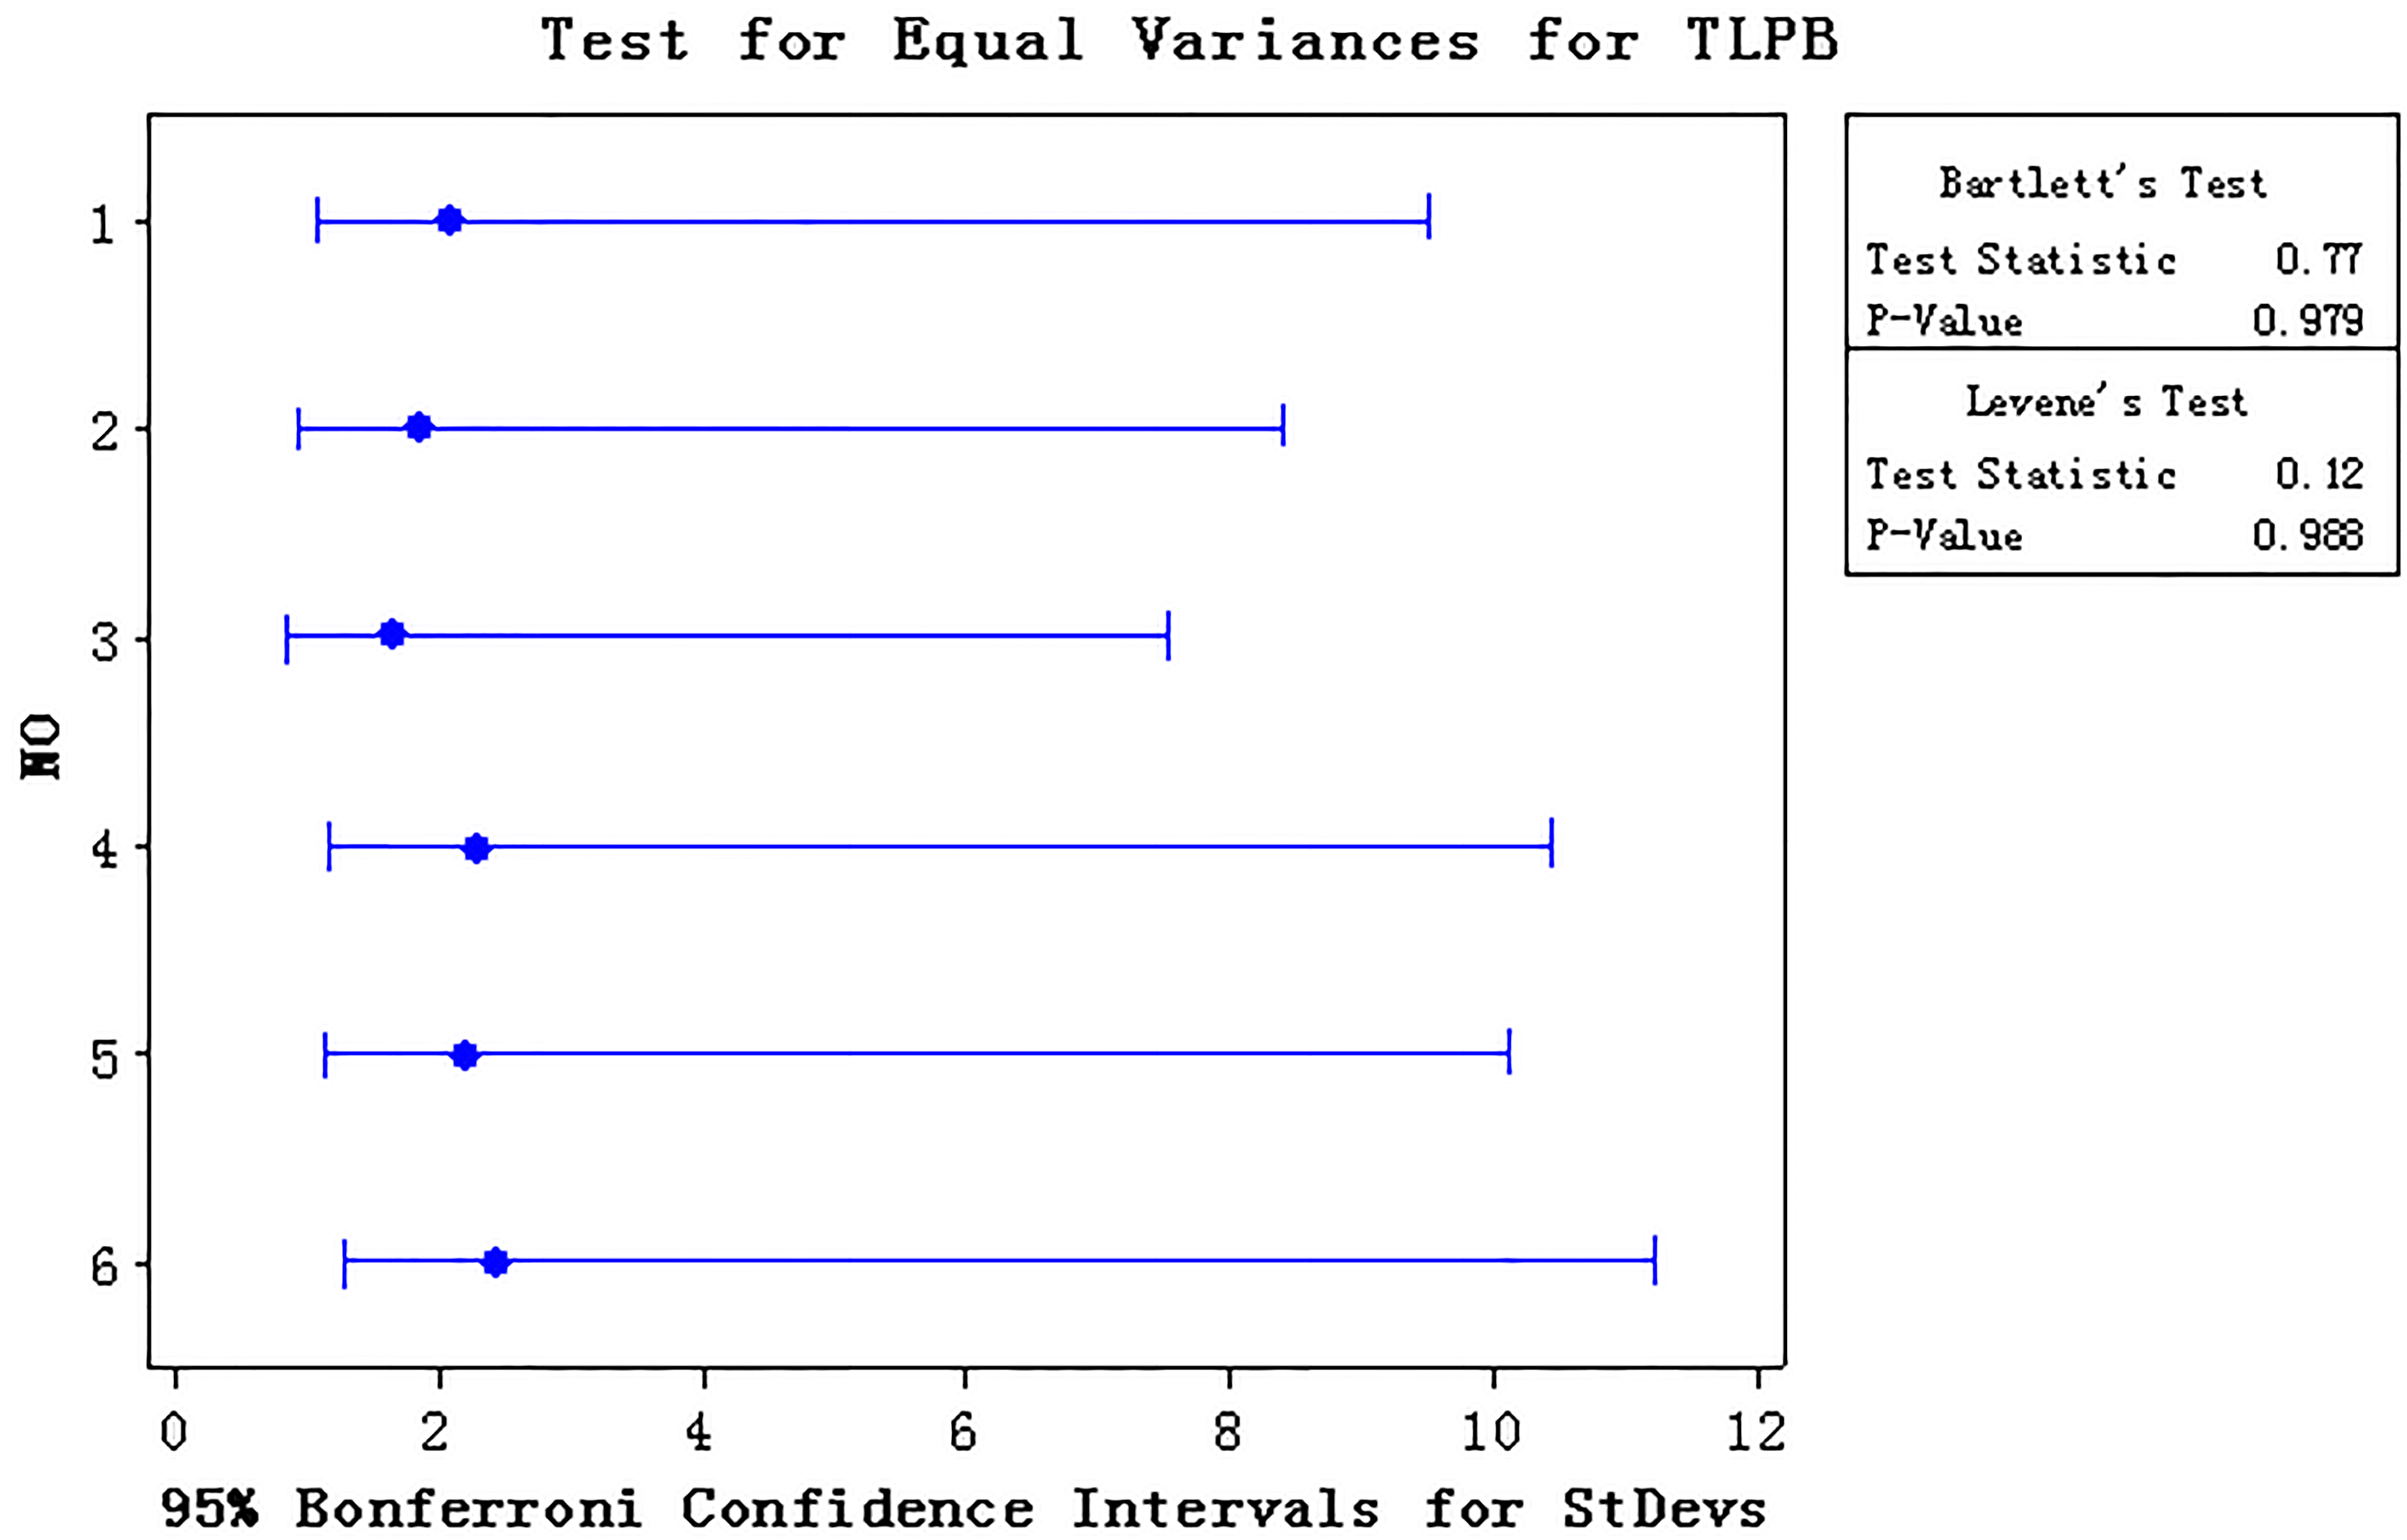
Data stability test is shown in Fig. 2.
Conclusion: Based on the same principle, it can be seen from Fig. 2 that the testing data of TYPE1
Normality analysis
Normality test is shown in Fig. 3 and Table 1.
Conclusion: From Fig. 3 and Table 1,
Variance consistency test
Data variance consistency test is shown in Fig. 4.
Conclusion: Fig. 4, integrated with P_value
One way variance test to the testing data.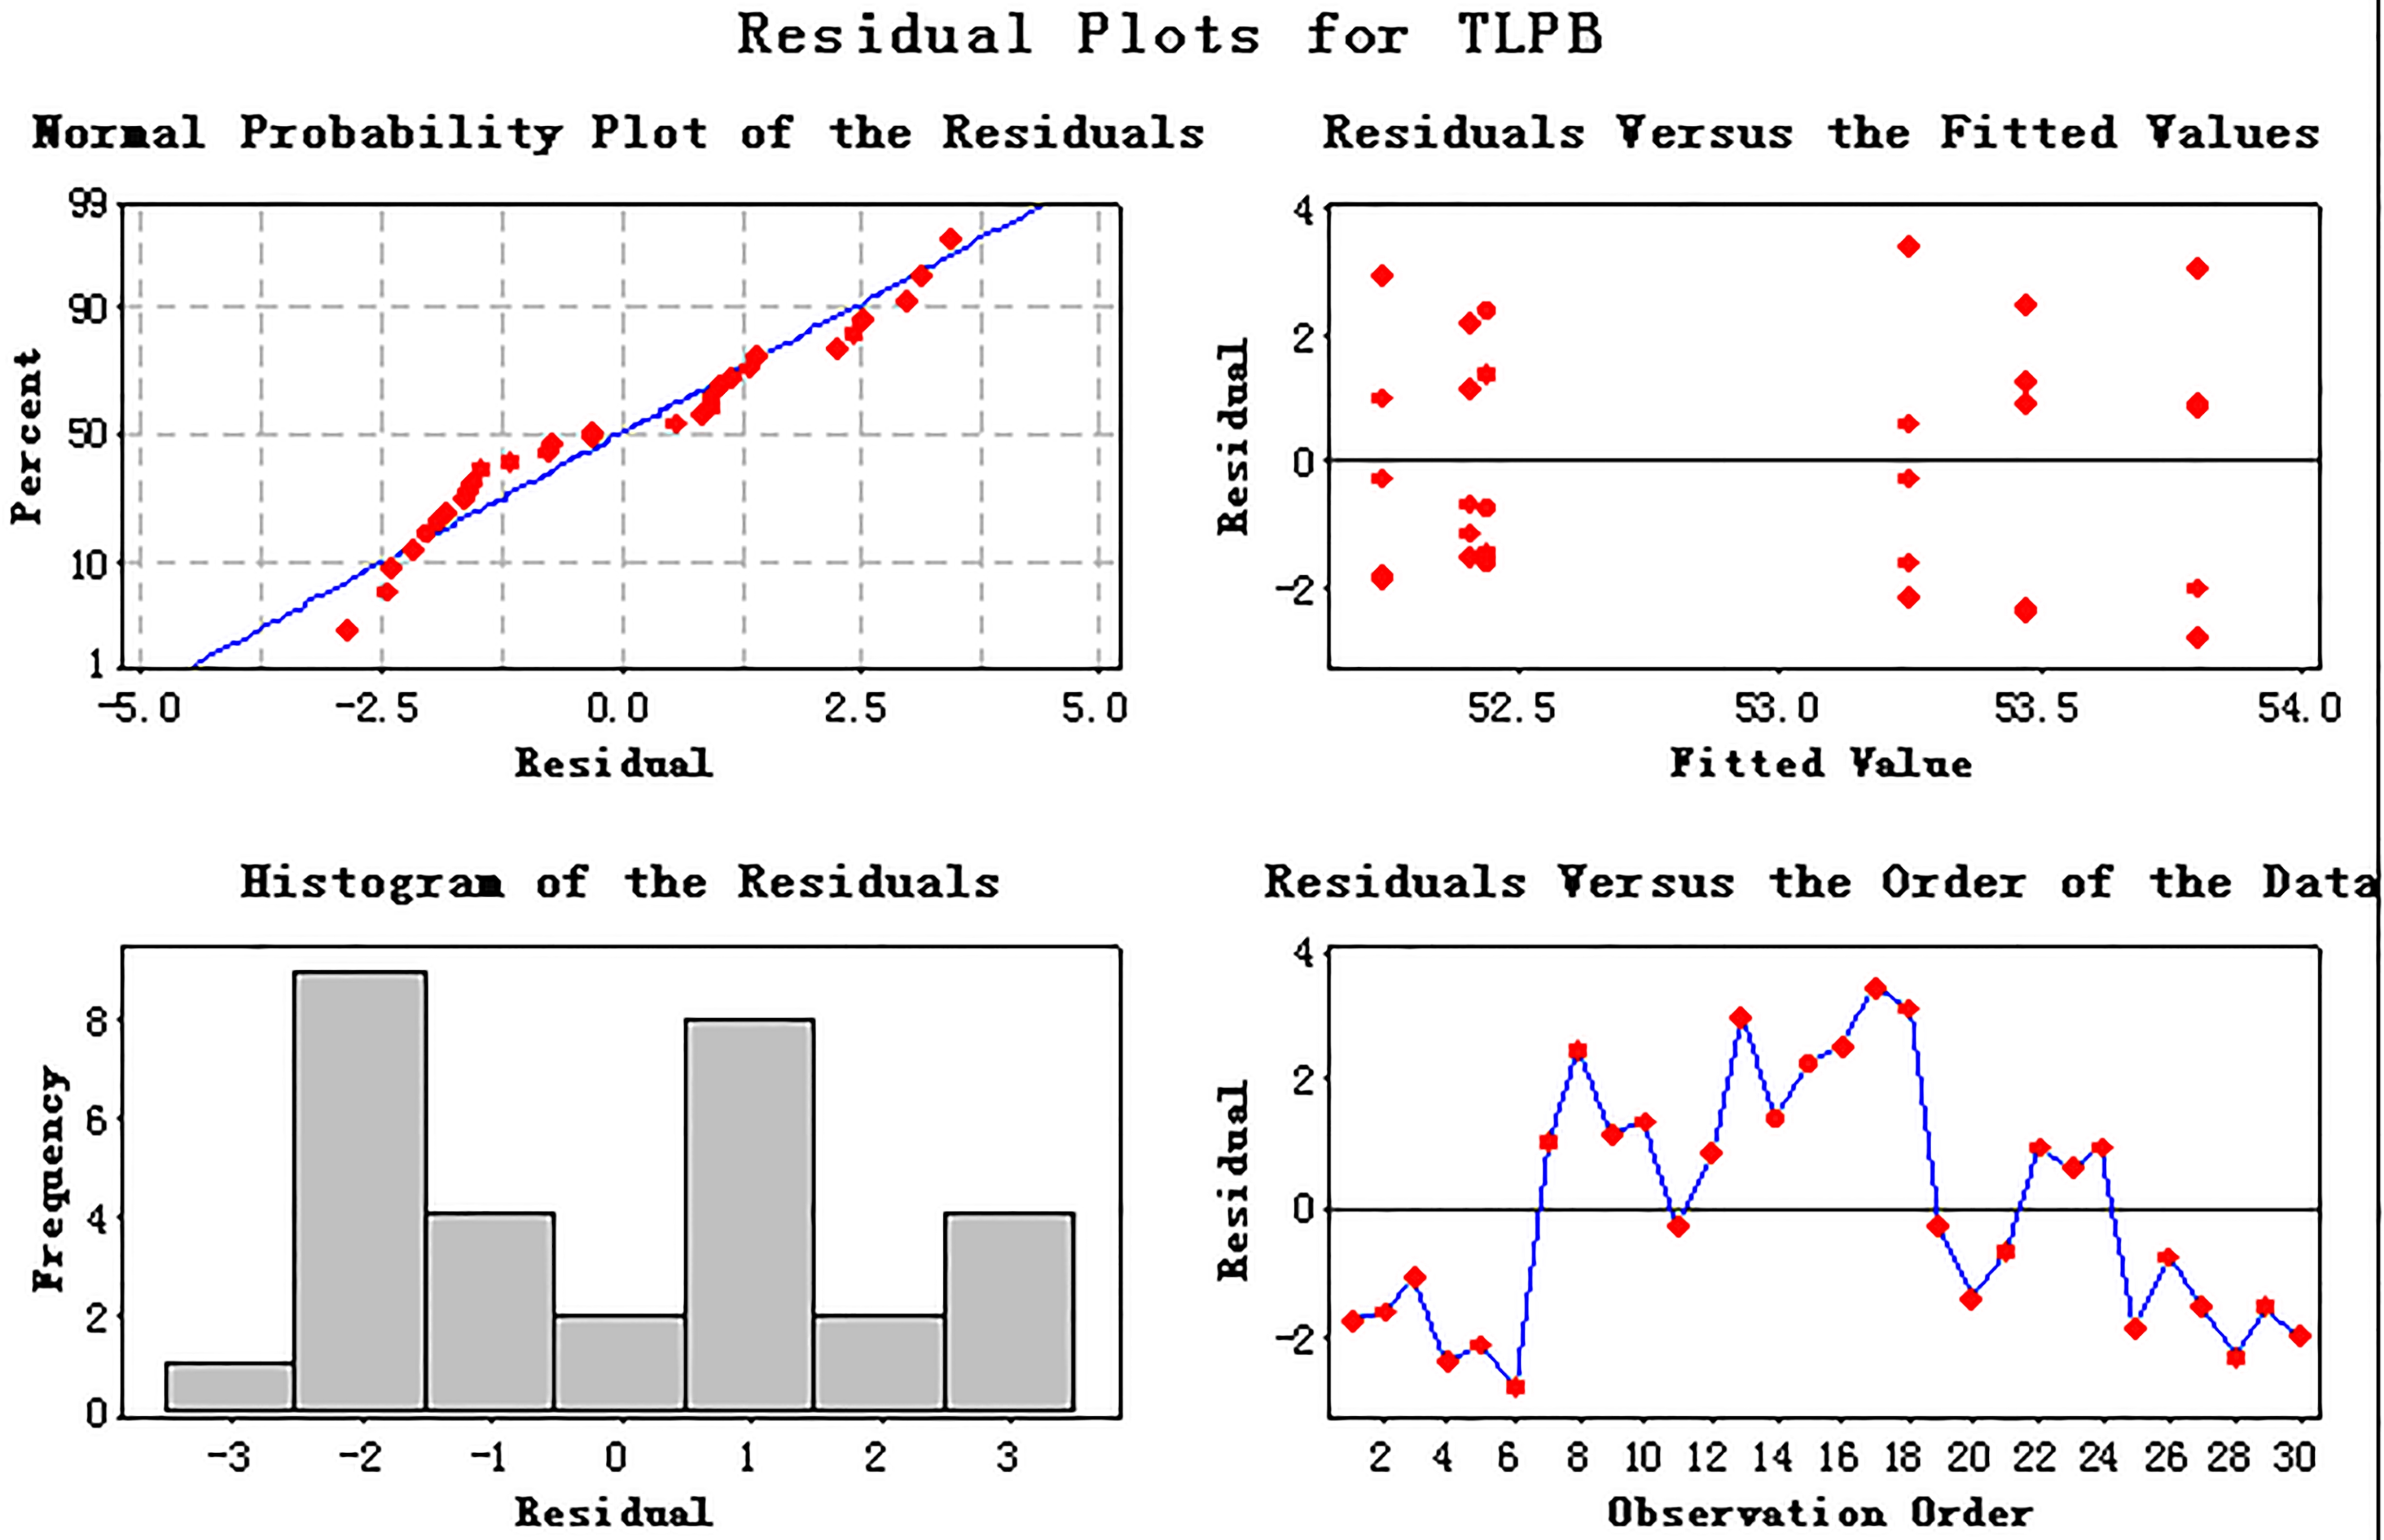
4.3.5.1 Residual analysis in ANOVA
Set the confidence level as 95%; One way variance test to the testing data is shown in Fig. 5.
Main effect graph in one way.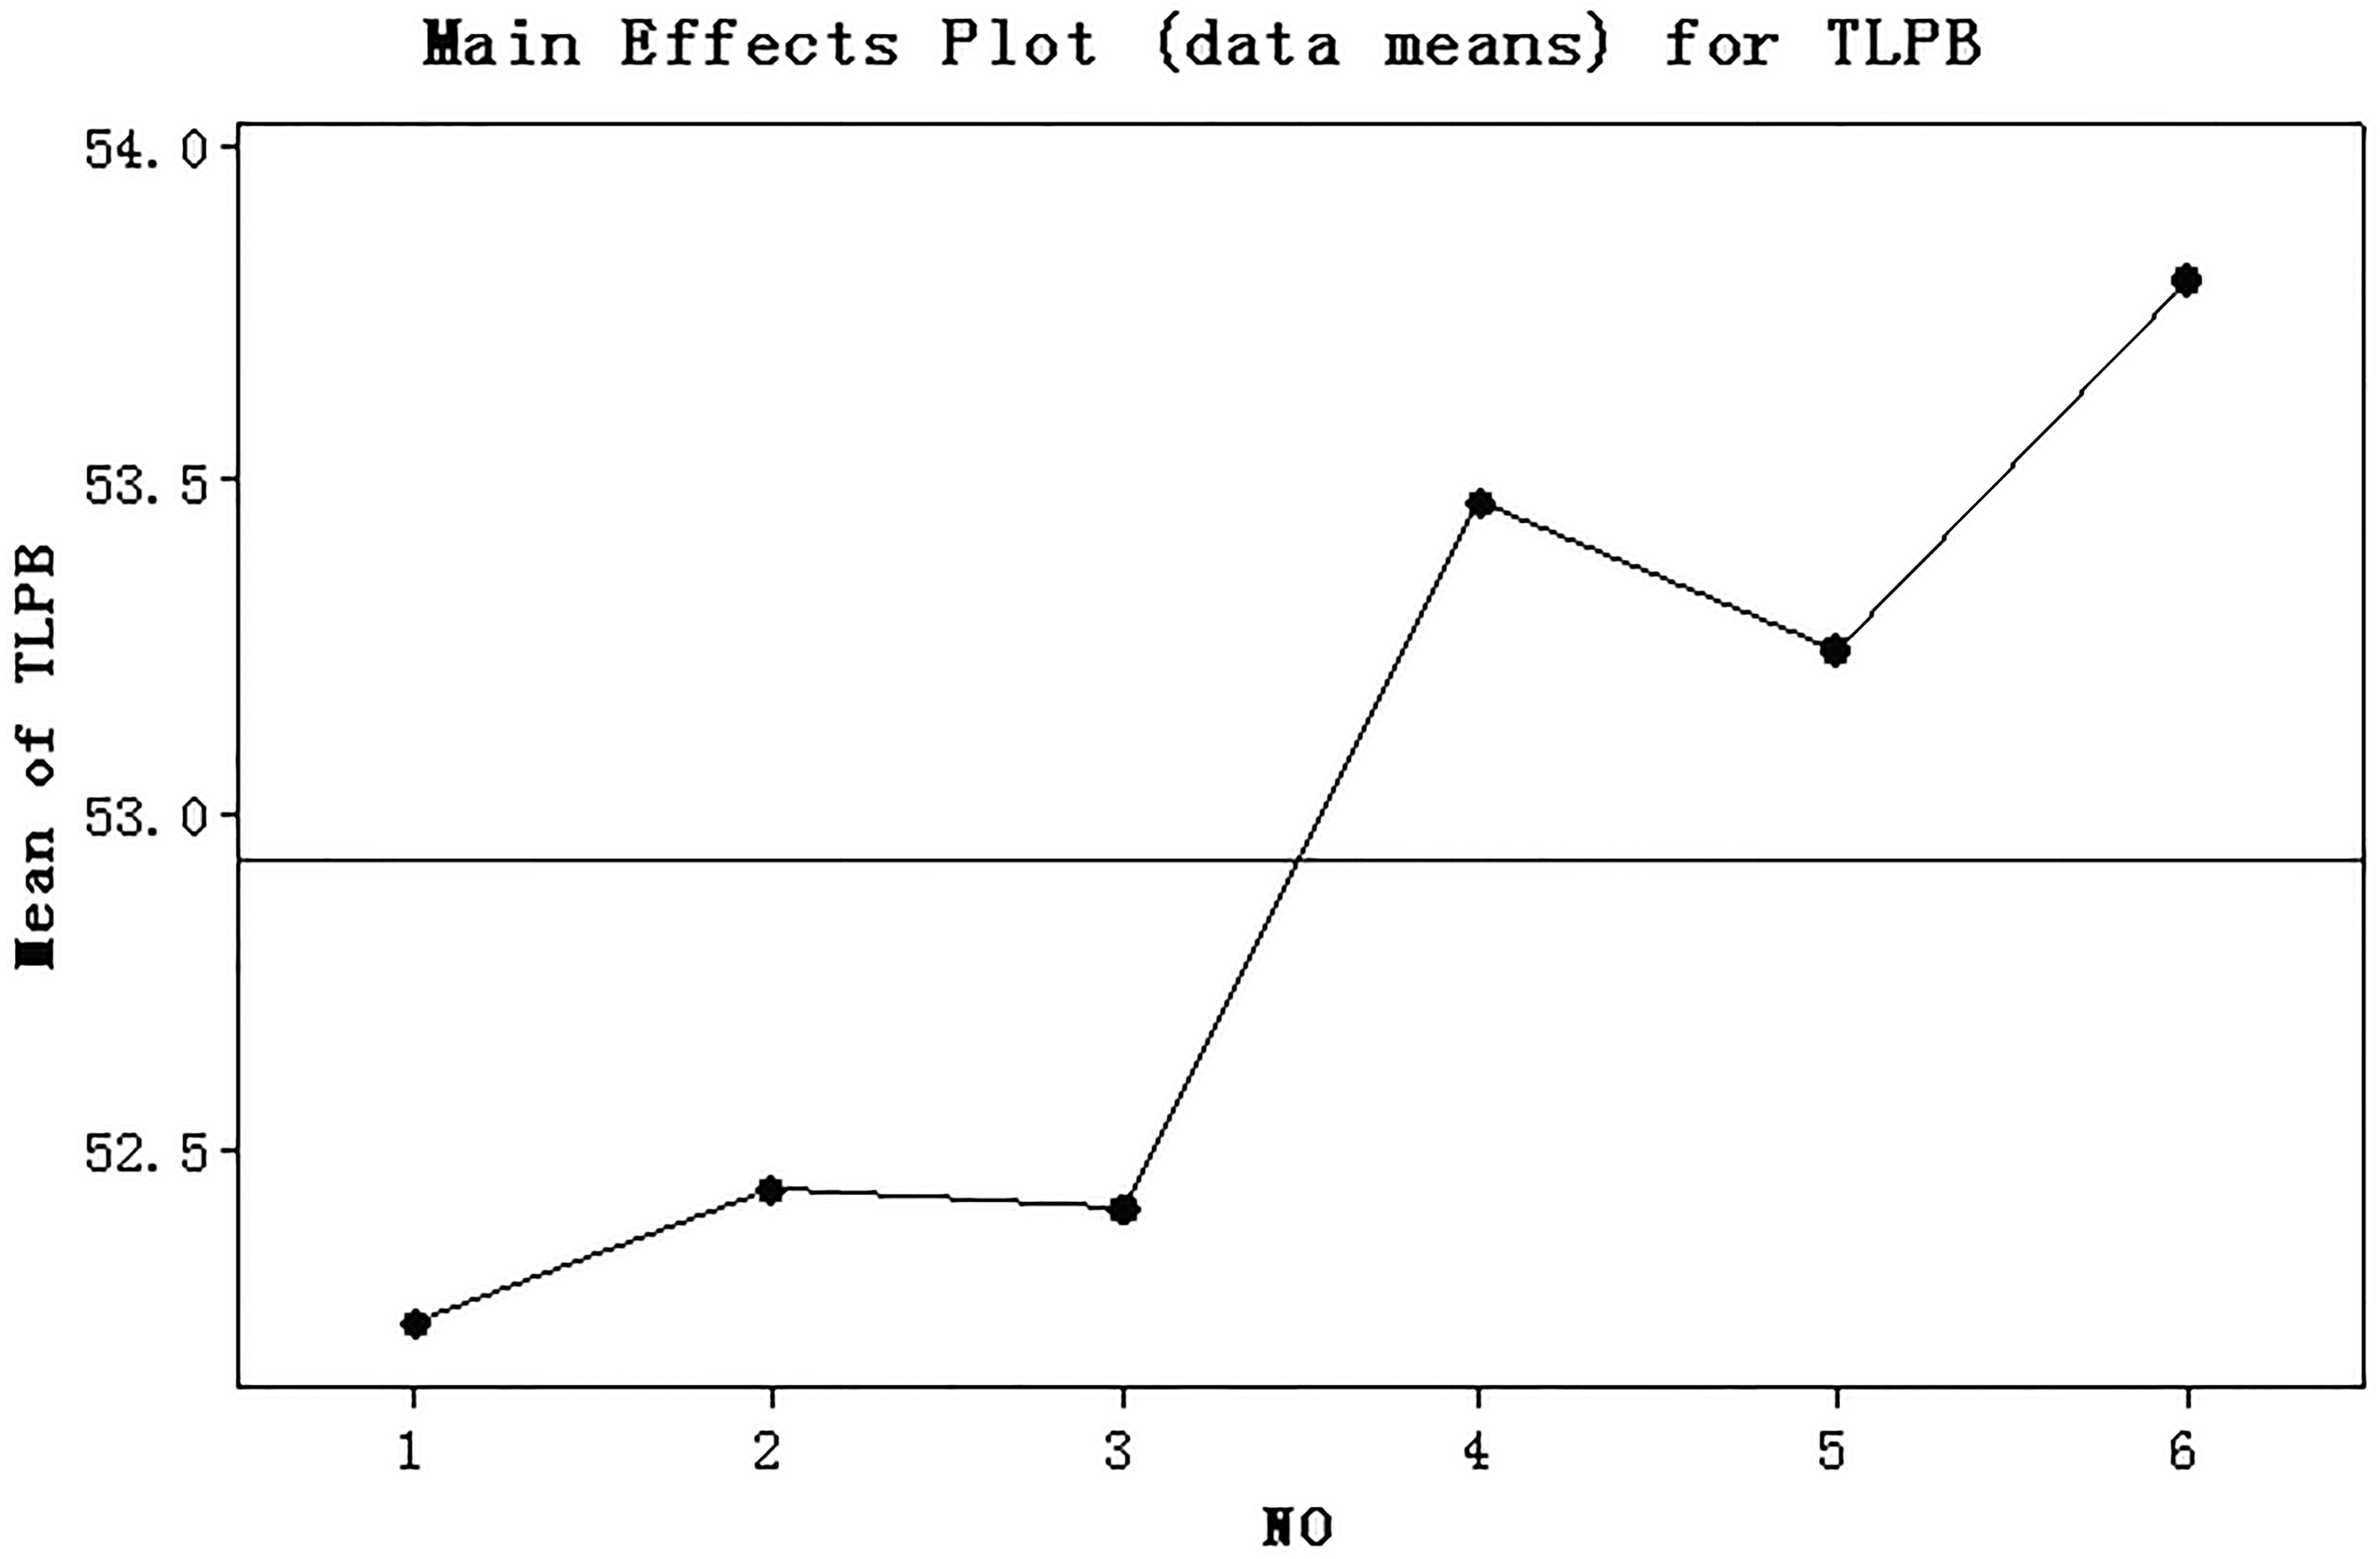
Inter-group effect graph in one way.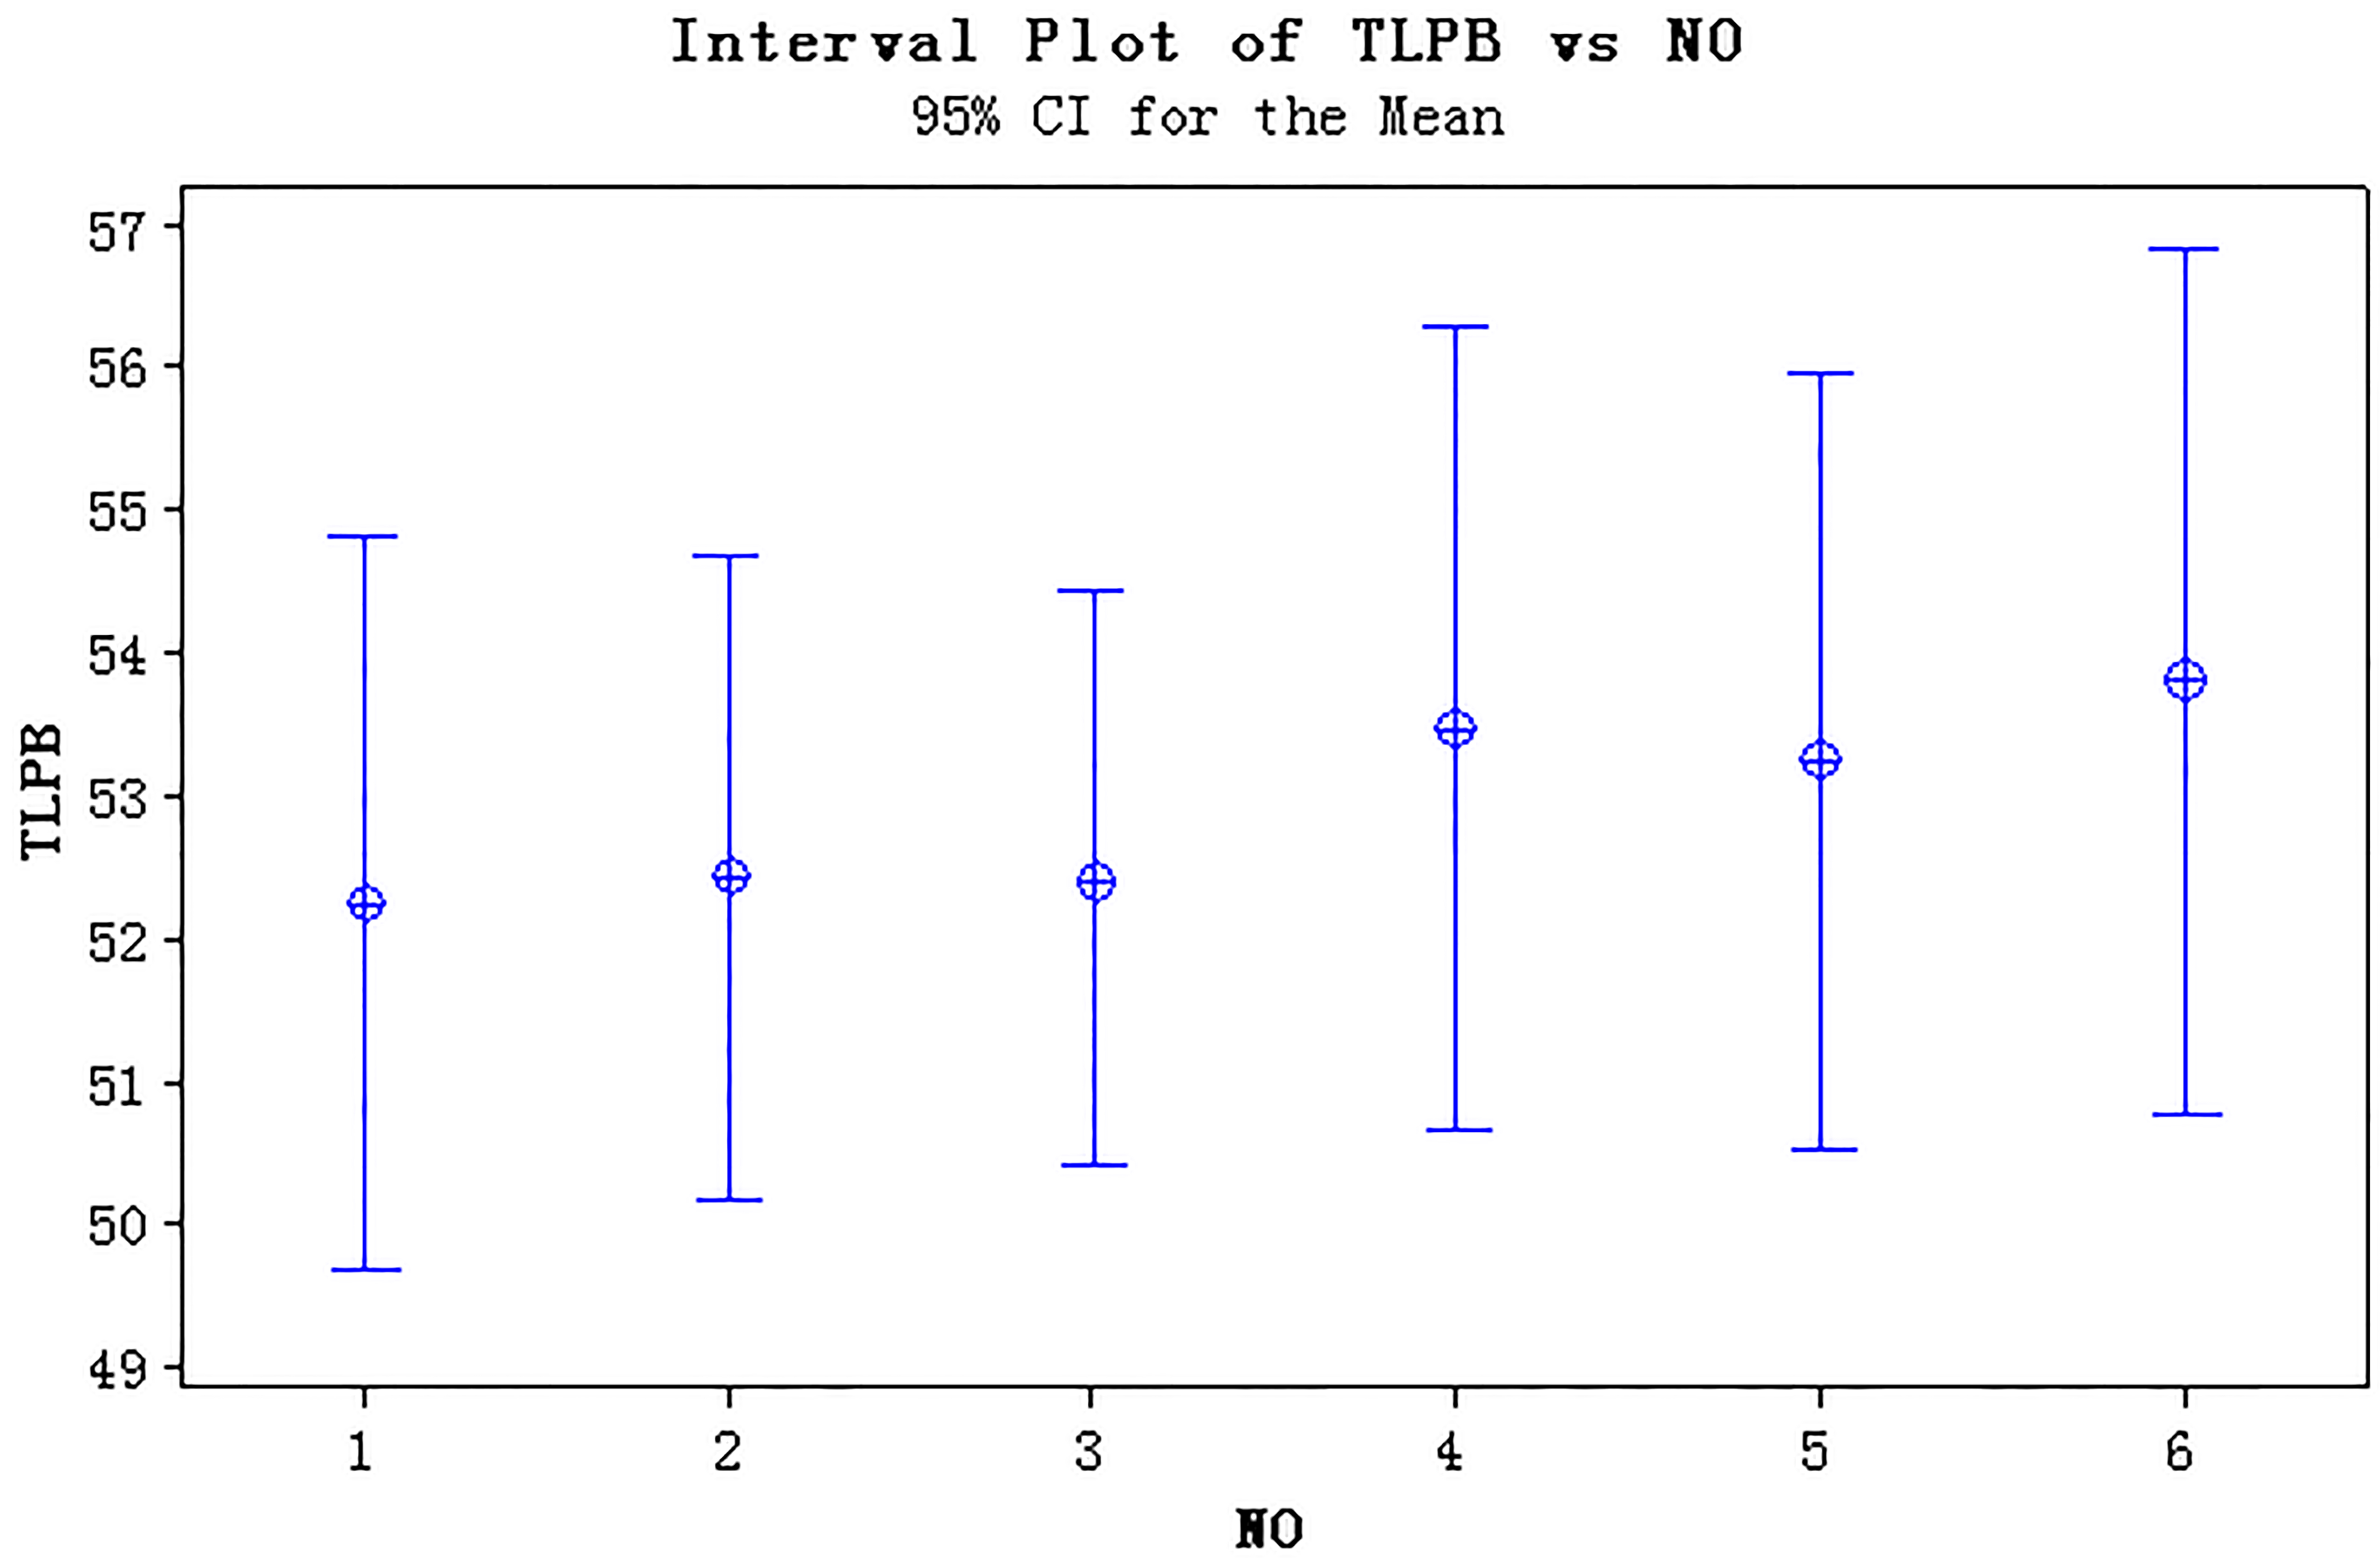
Conclusion: Since
4.3.5.2 Main effect graph and inter-group analysis in ANOVA
The main effect graph in one way ANOVA is shown in Fig. 6, and the inter-group effect graph in one way ANOVA is shown in Fig. 7.
Conclusion: It can be seen from the Figs 6 and 7 that, different types of isolators may affect the ACPR values.
4.3.5.3 Multiple comparisons in ANOVA
Using Fisher’s method to compare can easily find out the difference among mean values, although there is high risk of wrong confirmation.
Fisher 95% Individual Confidence Intervals
All Pair wise Comparisons among Levels of NO
Simultaneous confidence level
It shows the similarity degree of the 6 groups of data in Fisher comparison.
NO
NO
NO
NO
NO
Conclusion: The above matrix shows the comparison among mean values. As in the 95% of confidence intervals (CI) above, the CIs of all the 6 groups of data include zero, so we believe that there is no distinct difference among mean values.
4.3.6.1 Scatter diagram between S11 and ACPR
Scatter diagram between S11 and ACPR is shown in Fig. 8.
Scatter diagram between S11 and ACPR (with fitting curve).
Conclusion: It can be seen from Fig. 8 that S11 and ACPR values seem to show a linear correlation.
4.3.6.2 Correlation coefficient between S11 and ACPR
Correlations: TLPB, newS11
Pearson correlation of TLPB and new S11
P-Value
Conclusion: In accordance with the correlative coefficient table, sample size
While
Regression analyses to S11 and ACPR values.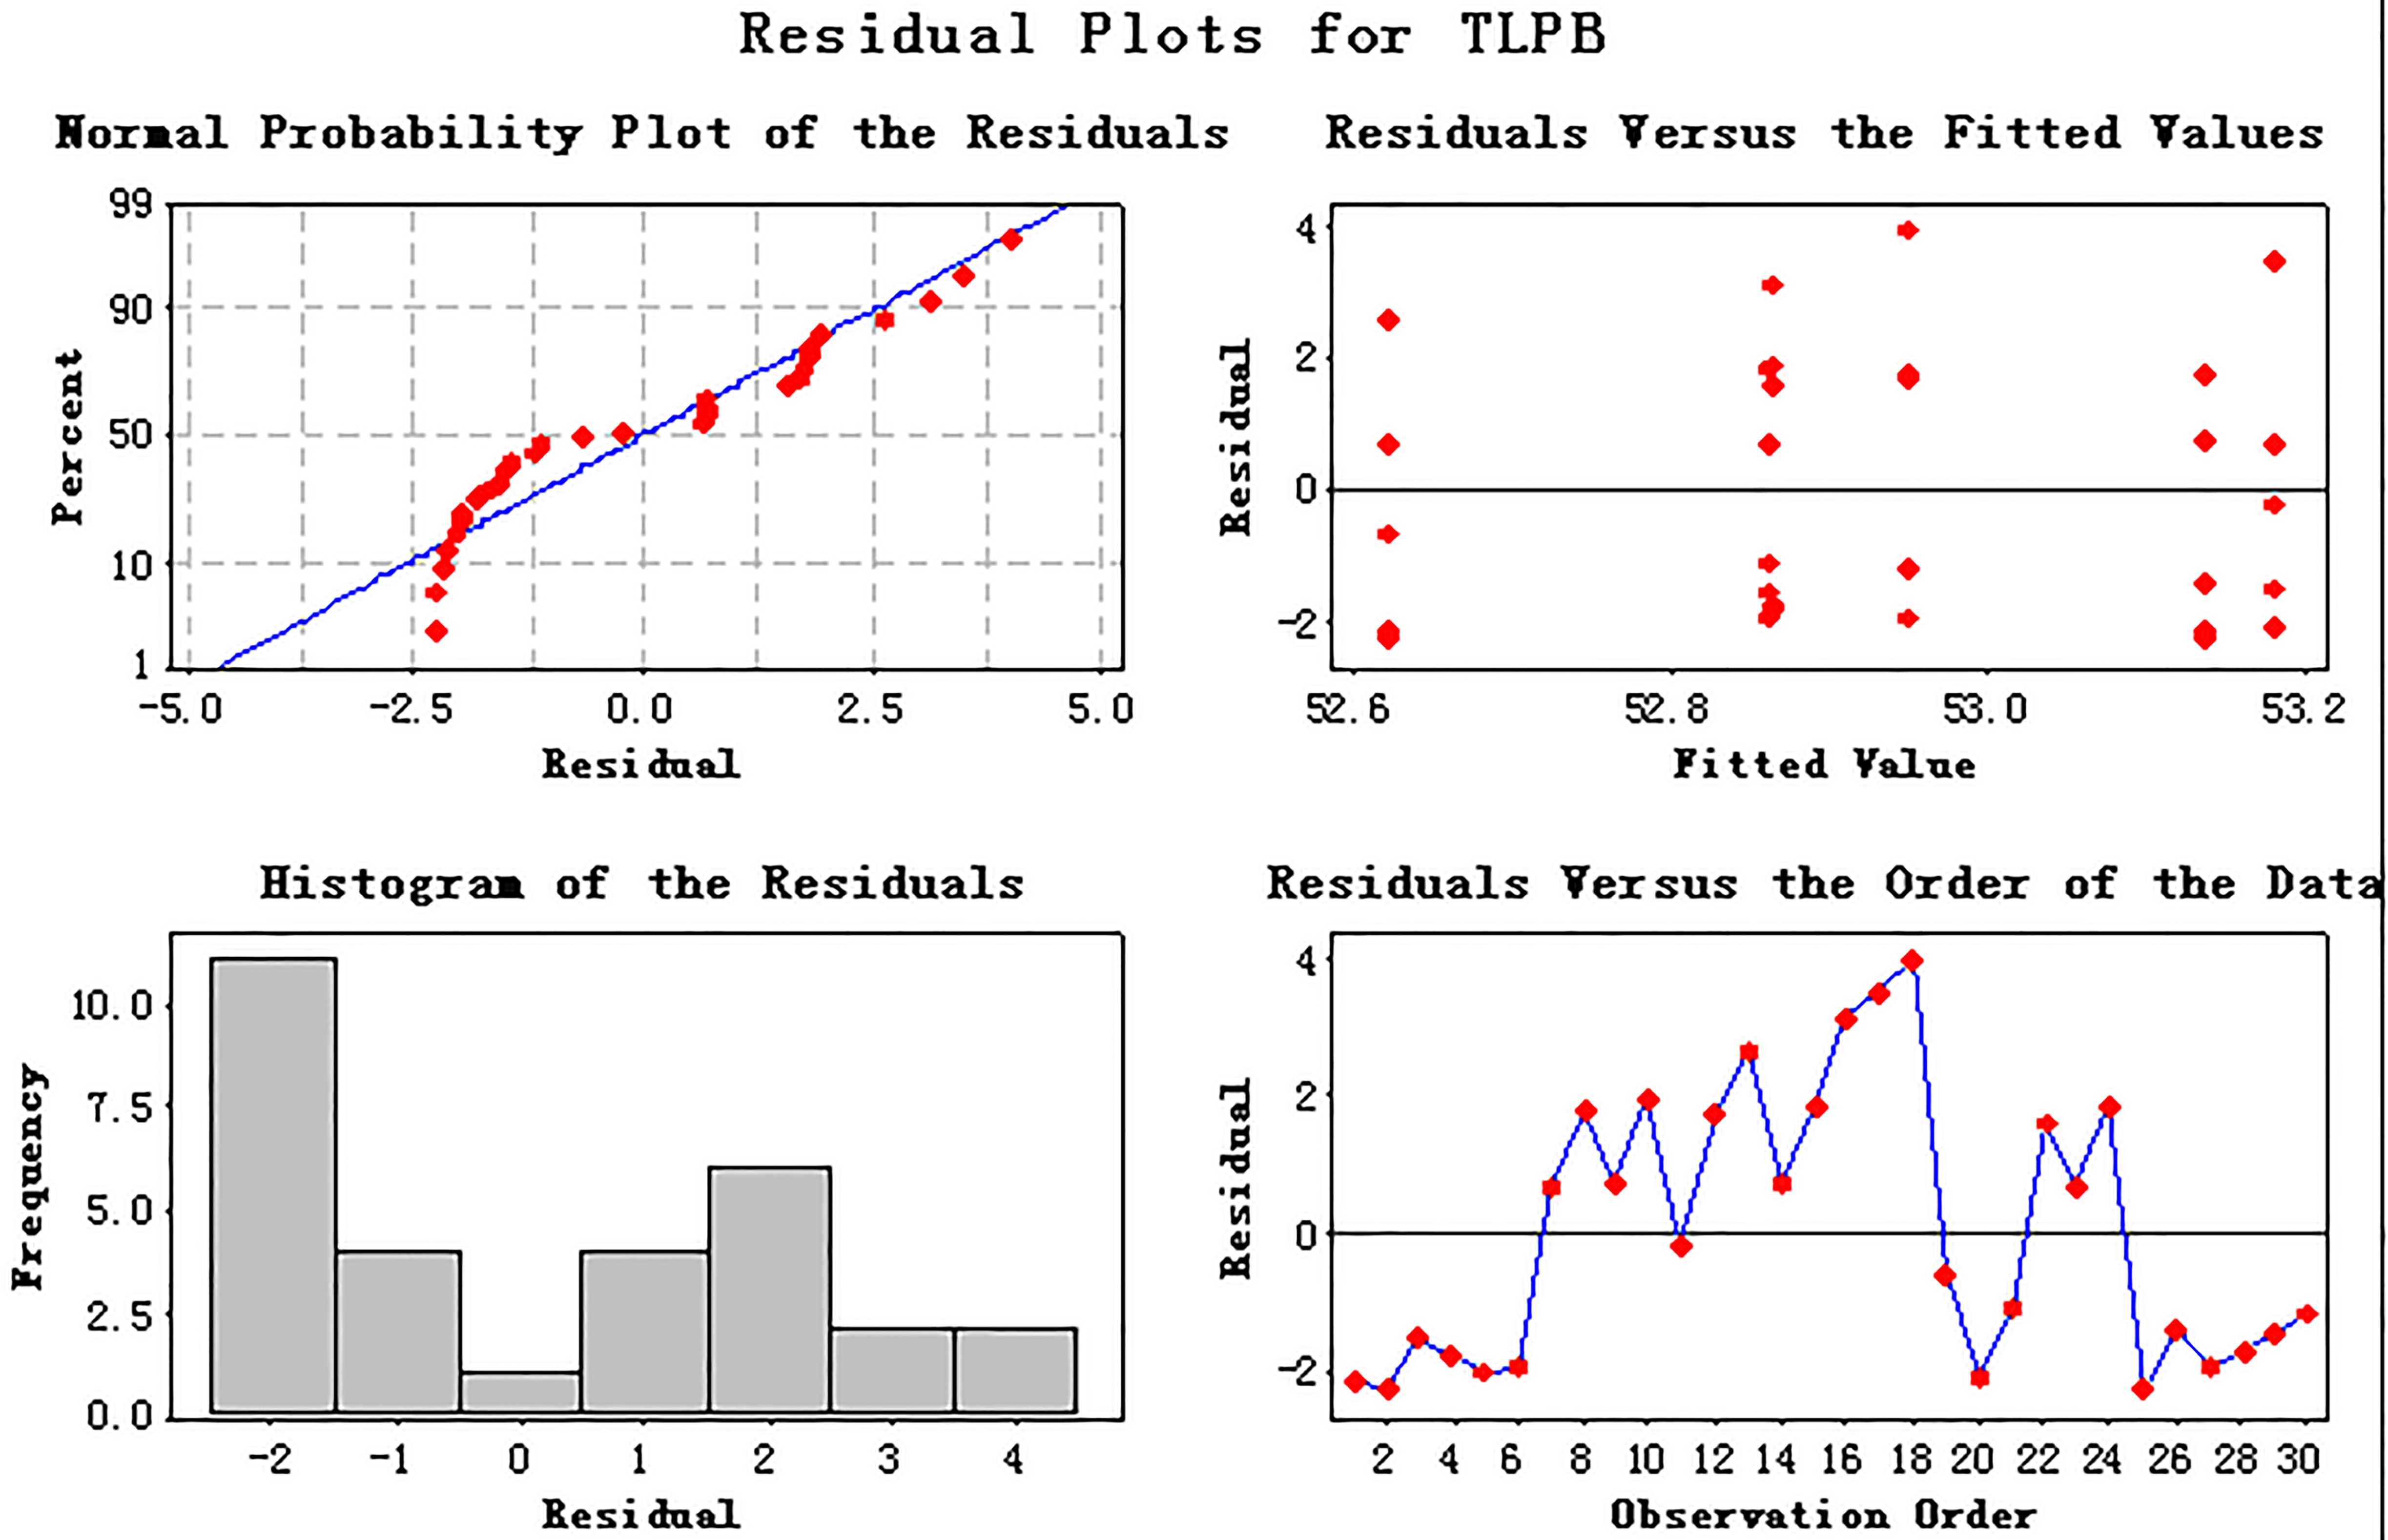
4.3.6.3 Regression relationship between S11 and ACPR
Regression analyses to S11 and ACPR values is shown in Fig. 9.
The regression equation is
TLPB
Analysis of variance
Unusual observations
Analysis: The result
Conclusion: The data show that there is no significantly simple linear fitting relation between the S11/S12 of isolators and the ACPR of single boards.
Footnotes
Acknowledgments
Project: the Science and Technology Program of the Education Department of Shaanxi Province Government (number: 16JK1158).