
Abstract
Thangka is a representative of Tibetan religion and culture, and it is a typical kind of intangible cultural heritage also. The paper studies the similarities and differences between carved Thangka and embroidered Thangka images based on highlight, shadow and edge information. Three novel features are proposed, Consistency of Illumination Direction (CID), Distribution of Highlight and Shadow near Edge (DHSE) and Edge Similarity under Different Channels (ESDC), and the distribution of Tangka image samples in these feature spaces is analyzed. Experiments and analysis show that compared with the color and texture features, the features proposed in this paper have strong expression ability in distinguishing two kinds of Thangka images.
Introduction
In the book “Tibetan Thangka”, Thangka is defined as “scroll paintings mounted with colorful satin”. Thangka embodies abstract, profound and complex Tibetan Buddhist ideas through image to spread and promote Buddhist religion and culture among Buddhist believers [1]. According to the materials used in production, Thangka can be divided into two categories mainly: “Zhi Thang” and “Guo Thang”. “Zhi Thang” refers to that Thangka made from painting, while “Guo Thang” refers to that made from silk and embroidery. There are also Thangka made by other ways, such as relief sculptures in wood, woodblock printing, sculptures and murals. A large number of Thangka have suffered damages of varying degrees due to long periods of storage since their creation; therefore, it is imperative to carry out digital protection of Thangka – a typical intangible cultural heritage [2].
Presently, most studies of Thangka images are on the image restoration [3, 4, 5, 6], Thangka retrieval [7, 8, 9], Thangka image semantic based on contents [10, 11, 12, 13], the Virtual reality display of Thangka [14, 15] and quality assessment for Thangka images [16, 17]. Studies on creation skills and process techniques are fewer. At the same time, great achievements have been made for painting artworks in-depth analysis by using image process technology. For example, with the extraction of brush strokes of Van Gogh’s works, analyses can be made on the attributes of consistency, length and width of strokes to determine the period of creation and whether it is a forgery [18], and The work of this paper is inspired by it. Such kind of researches expand the object of painting study from the content to the process. And such idea provides new inspiration for the research of Thangka image.
Huge amounts of cultural information are embedded in Thangka creation process. Annotation for different fabrication processes can improve the knowledge base of Thangka, which is more conducive to its protection and learning. For example, the tools and materials used in carving and embroidery can reflect the level of material processing and manufacturing at that time, and different creative techniques are also related to the mainstream aesthetic of people at that time. However, any attempts to obtain the semantic contents of images are bound to face the problems of severe semantic gap [19].
To solve this problem, there are usually two different approaches for feature extraction. Based on low-level features, one approach aims to extract images “low-level features” (such as color, texture, invariant moments etc.) for leaning, with the support of a large number of known samples. At present, deep neural networks have been able to produce satisfactory learning results with the support of millions of samples [20]. Another way is based on visual features of high-level. Some features are designed artificially by an in-depth study of image samples, and the such features can express high-level semantics of images. As the sample number is small, the latter approach is suitable for the study in this paper. In our previous work, two kinds of Thangkas, weave embroidered and piles embroidered, have been studied from the perspective of image texture [21]. In this paper, the image feature in carved Thangka and embroidered Thangka will be studied..
The following parts are organized as follows: the second part introduces three features proposed in this paper, including the principle of feature and the extraction method. The third part is the experimental analysis of the features. The fourth part is the summary of the full text and the plan for future work.
Features of carved and embroidery Thangka
Carved Thangka is usually sculptured on the board in the form of relief. After the completion of the carving, Thangka is protected with varnish, so its surface is smoother, and the color is dominated by the wood itself. Jade plates and metal are also used as materials for carving. Thangka embroidered by silk is also known as “Guo Tang”, with complicated images and various colors. By the techniques used in embroidery, “Guo Tang” can be further categorized into many types - some of the common ones are: weave embroidery, piles embroidery and seed-piercing embroidery etc. Some samples are shown in Fig. 1.
Thangka made by different materials. (a). wood carved Thangka. (b). wood carved Thangka. (c). metal carved Thangka. (d) jade carved Thangka. (e). weave embroidery Thangka. (f). piles embroidery Thangka.
From a point view of visual, there is a great difference between carved Thangka and embroidered Thangka in their concave-convex degree. The concave-convex degree of carved Thangka is high, and that of embroidered Thangka is low. Due to the smooth surface of the engraving Thangka, the part facing the light direction is in the high light state, the part in the backlight direction is in the shadow state, and the high light and shadow areas appear in pairs. But this phenomenon does not appear in embroidered Thangka. It is because that in embroidered Thangka highlight and shadow are generated based on their own luminance and color distribution, rather than due to concave-convex.
We define illumination direction in Thangka image as the direction from highlight areas to shadow areas. The directions of illumination for carved Thangka images are globally homogeneous; while in embroidered Thangka such directions are random. Carved Thangka and embroidered Thangka can be distinguished by their differences in consistence of illumination direction. This feature (Consistency of Illumination Direction) is abbreviated as CID. The value of CID in carved Thangka is high, while that in embroidered Thangka is low.
The steps of CID feature obtention are as follows:
Obtaining the illumination direction of original image. Segmenting the image into sub-images. Calculating illumination directions for all sub-images. Counting direction consistency between original image and sub images as the value of CID.
Highlight components are defined as areas in image that have a higher luminance value than the threshold value of
Calculation process of illumination direction. (a) original image. (b) highlight components image. (c) shadow components image. (d) illumination intensity and direction in original image.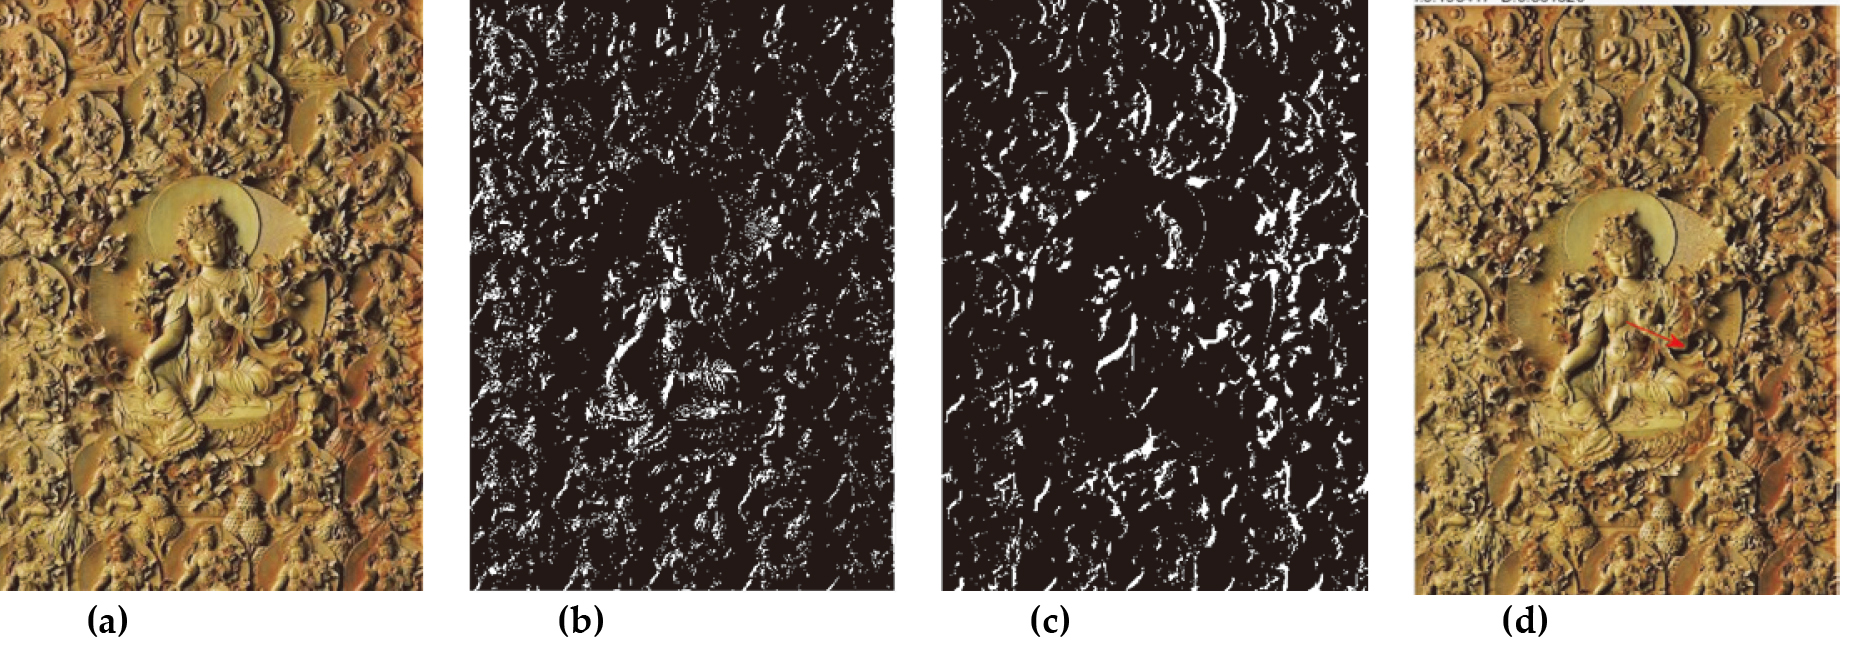
In Eq. (2), Illum
The highlight and shadow component images are calculated by Eq. (2) respectively, and two sets of light intensity are obtained. The fusion of these intensities is needed. For one direction, horizontal or vertical, illumination intensities from highlight and shadow are weighted and summed up by Eq. (2.1.1). Weights are determined by the average gray level of images.
In Eq. (2.1.1),
In Eq. (4) Illum denotes the whole image’s illumination intensity; and Dir denotes illumination direction. The
In order to calculate the local light direction, we need to segment the image into multiple sub-images. In an ideal sub-image, highlight and shadow should appear in pairs with the same direction, and also the size of the sub-image should not be too small.
A sub-image segment algorithm is designed, and the main steps are listed below:
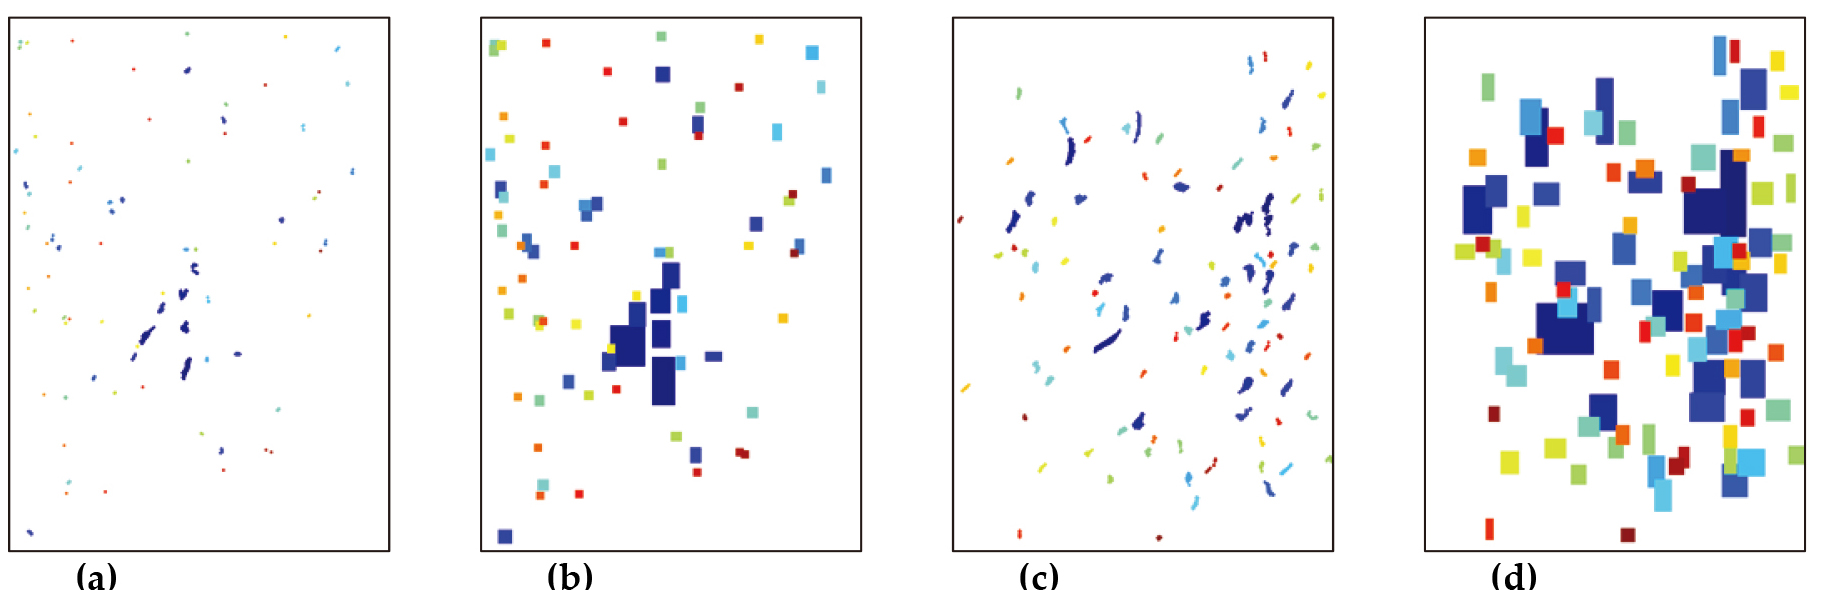
The method in 2.1.1 is carried out to get highlight components image, shadow components image and the illumination direction of original image. Morphological operations are performed at highlight and shadow images to fill empty holes; the 100 largest connected areas are selected as the reference area for the sub-image, as shown in Fig. 3a–c. The reference areas are extended in the illumination direction. The size of extension is determined by illumination intensity. Merging the reference area and the extended area, the contents of their bounding boxes are sub-images, as shown in Fig. 3b and d. Different color represent different sub-image.
After sub-images segment, illumination directions of all sub-images are calculated and categorized into four quadrants. If direction of one sub-image falls in the same quadrant as that of the original image, they are considered as having the same illumination direction.
In Eq. (5), it can be seen that the value of CID is actually the proportion of sub-images in the same illumination direction as original image.
The edge is one of the most important feature of image, and the human eye is extremely sensitive near edge. Edges of carved Thangka are largely on the boundary between highlight and shadow areas; while edges of embroidered Thangka are on the boundary of color change. Distribution of highlight and shadow is counted in the gradient direction along the edge. For one pixel, there are three possible circumstances: highlight, shadow and neither highlights nor shadows. So there are totally six cases for two sides of an edge point:
highlight on one side, and shadow on the other highlight on both sides shadow on both sides neither highlight nor shadow on either side highlight on one side only shadow on one side only
Figure 4 is a visual display of the above six situations. The blue line represents the edge, the red point is the current point for calculation, and the gradient direction of this point is 45 degrees. Light green indicates highlight, dark green indicates shadow, and gray indicates no highlight or shadow. Along the gradient direction and the opposite direction, 7 points are taken on both sides of the edge. If the number of highlights exceeds half, then this side is the highlight side; if the number of shadow points exceeds half, then this side is the shadow side; if there is no ratio of any one more than half, then this side has nothing.
Different types of edge points: from (a) to (f), are the first type to the sixth type.
There is a significant change of gray level near the edge. In the above six circumstances, edges with highlight or shadow on both sides (types 2 and 3) show that the gray level changes in this area are slow; one-side highlight or shadow (types 5 and 6) suggest that one side of the edge is brighter or darker than the other side; highlight on one side with shadow on the other side (type 1) suggests that the edge sits on a bright-dark boundary line; no highlight or shadow on either side (type 4) suggests that the edge is formed by changes in color, rather than changes in brightness. Therefore, the edge pixel of type 1 can represent the characteristic of carved Thangka, while that of type 4 represents the characteristic of embroidered Thangka. Based on this analysis, the feature of Distribution of Highlight and Shadow near Edge (DHSE) is proposed. The steps of DHSE feature extraction are shown as follows:
The Canny method is used to get the image edge and the gradient direction. Highlight and shadow image are obtained by the method in 2.1.1. Along the gradient direction of edge pixels, pixels are obtained from each side. The pixel number of each type (highlight, shadow) is counted. In one side, if pixels number of one type amounts more than half of all pixels, that side of the edge is considered as that type. If neither type of pixels amount more than half, that side of edge is considered as neither highlight nor shadow. The proportion of edge pixels of type 1 and type 4 in all edge pixels are counted. The value of above two ratios are the two dimensions of DHSE feature. In carved Thangka, the value of the first dimension is higher, and that of the second dimension is lower in embroidered Thangka. Then the feature of DHSE is determined.
In HSI color space, H denotes the hue value of a pixel, S denotes the saturation and I denotes the intensity. For the image edges under different channels of H and I, as the hue values of carved Thangka are generally distributed evenly, the contribution to gray level change of hue value is relatively small. Most gray level changes near edge areas are caused by the change of intensity. Therefore, edge differences between channel H and I are large in carved Thangka, as shown in Fig. 5b and c. On the other hand, edge of embroidered Thangka are mostly determined by hue changes, and edge differences between Channel H and I are small, as shown in Fig. 5e and f. The Similarity of Edges under Different Channels (SEDC) can be used to distinguish between carved Thangka and embroidered Thangka. The value of that in carved Thangka image is large, and that in embroidered Thangka is small. The features are obtained through the following steps:
Feature of Edges Similarity under Different Channels. (a). Original image of a carved Thangka. (b). the edge of channel H in Fig. 5a. (c). the edge of channel I in Fig. 5a. (d). Original image of a embroidered Thangka. (e). the edge of channel H in figure 5(d). (f). the edge of channel I in Fig. 5d.
Canny method is used to obtain the edge of an image under channel I, as shown in Fig. 5c–f. The Canny method is used to obtain the edge under channel H. If such edge obtained under channel H are insufficient, edge under channel S is added. The edge in channel H and S are merged to form a new H edge, as shown in Fig. 5b–e. Coincidence degree of each edge in channel H to edge in channel I is calculated. If it is greater than 0.4, the two edges are coincided. The proportion of coincided edges in all edges under channel H is the value of
At present, there is no publicly available Thangka image dataset. The images used in this paper are collected from real objects photographing, books scanning and downloading from internet. Images of low resolution and poor quality have been removed from the collection. Finally, 24 images of carved Thangka and 56 images of embroidered Thangka have been preserved after manual selection. Due to the small number of samples, no classification experiments are carried out in this dataset; instead, the expression ability of features is analyzed and sample distributions under different feature spaces are studied. In addition, in order to show the distinguishing ability of the features proposed in this paper more clearly and intuitively, we also expand the samples, and carry out classification experiments on the expanded data set.
Analysis of features expression ability
The paper proposes three features based on the differences between carved Thangka image and embroidered Thangka image. These differences derive from different patterns of various types of Thangka images under highlight, shadow and edge. Two typical Thangka images are selected to illustrate these differences in proposed features. Sample d17 of carved Thangka is shown in Fig. 1b, and sample c10 of embroidered Thangka is shown in Fig. 1f. The illumination directions of their sub-images are shown in Fig. 6.
Histogram of Sub-image Illumination Direction of Embroidered and Carved Thangka. (a). Histogram of carved Thangka image d17 (b). Histogram of embroidered Thangka image c10.
The abscissa in Fig. 6 represents the illumination directions of sub-images, and the ordinate represents the ratio of the number of sub-images in a certain direction to the number of all sub-images. The direction value range is [
A total of 167 sub-images are obtained from sample d17, of which 100 are based on highlights and 67 are based on shadows; and 192 sub-images are obtained from sample C10, of which 94 are based on highlights and 98 are based on shadows. The mean and standard deviation of the distance between these sub images and original image in illumination direction are shown in Table 1. When calculating the distance between two angles, the difference between the values is normalized to within 180 degrees to get the minimum angle distance.
Difference between the illumination direction of sub image and the original image
It can be seen from Table 1 that in one image, the sub images based on highlights and shadows are relatively consistent in the illumination direction. In the carving images, the difference between the illumination direction of the sub image and the original image is smaller than that of the embroidery images.
For feature of DHSE, 70444 edge points (image resolution of 510*754) have been obtained from sample d17. Among these edges points, there are 1301 points of type 1 (as described in 2.2, one side is highlight, and the other is shadow) and 46258 points of type 4 (as described in 2.2, neither side is highlight or shadow). After being normalized, the two dimensions value of feature DHSE are 0.0185 and 0.6567. A total of 125255 edge points (image resolution 930*1228) are obtained from sample image c10. Among them, there are 185 points of type 1 and 92020 points of type 4. After being normalized, the feature values of DHSE are 0.0015 and 0.7347. Comparison shows that there are more type 1 pixels in carved Thangka (d17), and more type 4 pixels in embroidered Thangka (c10).
For ESDC features, 70 edges under Channel I and 74 edges under Channel H are obtained from sample c10. There are 21 edges with a coincidence ratio (Channel I coincided under Channel H) higher than 0.4, and the value of
Figure 7 illustrates the statistics of feature values of all samples in the form of box plots. The Fig. 7a is CID feature, Fig. 7b is ESDC features, Fig. 7c and d are DHSE features in different dimensions. Feature of CID and ESDC have both two components, but they are the same in magnitude and trend, with little differ in values only. Therefore, only one dimension of them is selected for illustration.
It can be observed from Fig. 7a that CID values of carved Thangka images are generally higher than embroidered Thangka images, which illustrates that in carved Thangka, sub-images and original images are more consistent in illumination direction than that in embroidered Thangka. For the distribution of samples, the box plot structure of both two types of images are internal compact, without coincided parts. Overlapping only exists in some isolated value.
As for the other two features, the distributions of samples are generally similar to those of CID feature. The value of one type is higher or lower than other type, without coincidence of main data. Overlapping only exists in zones of isolated value. It suggests that the three proposed features can distinguish carved Thangka and embroidered Thangka effectively.
Statistics of feature values of all samples. (a).Feature values of CID. (b) Feature values of ESDC. (c). Feature values of DHSE 1. (d) Feature values of DHSE 2.
Figure 8 illustrates sample distributions in different feature space in the form of 2D. It can be observed that samples distributions in different feature spaces exhibit regular patterns. There is a distinct type-dividing line (the green line) between red samples (embroidered Thangka) and blue samples (carved Thangka). Samples are clustered within classes and separated among classes in proposed feature spaces.
2D distribution of samples in different feature spaces. (a). CID. (b). DHSE. (c). ESDC.
In addition, there are some exceptions in the distribution of some samples. In different feature spaces, abnormal samples of carved Thangka are the same, including d2, d6 and d18. As for sample d2 (shown in Fig. 9a), its light is not a single linear source, and its highlight and shadow directions are not the same throughout the whole range. Therefore, sample d2 overlaps with embroidered Thangka samples in the feature space CID and SEDC. As for sample d6 (shown in Fig. 9b), it is impossible to obtain accurate edge information for its low resolution. Therefore, coincidences occur in DHSE and SEDC feature spaces where edge information is required. As for sample d18 (shown in Fig. 9c), it is a metal carving in relief, colored with oil paint. The concave-convex level of this sample is low and color is rich, so it is easily confused with embroidered Thangka.
Some samples with exceptions.
The embroidered Thangka sample c55 (Fig. 9d) confuses with carved Thangka in all three feature spaces. It is caused by low resolution and extreme complexity of image. The obtained features fail to reflect its true type. Besides this image, the rest coincided samples behave differently in different feature spaces. This is because the embroidered samples are very different in content. These differences exist in many aspects, including color, composition, layout and details. Therefore, some embroidered Thangka images perform well in one feature space, while poorly in another feature. For instance, sample c2 (Fig. 9e) performs well in CID and ESDC feature spaces, but it dips very deeply in carved Thangka zones in the feature space of DHSE.
Sample expansion of thangka image data set
In the previous experiments, because the number of samples is too small, there is no classification experiment. In order to analyze the features proposed in this paper more intuitively, we extend the original data set. The extended method is to cut the original image at a random location according to a certain scale, and take the cut image as a new sample.
Two parameters are needed for data set expansion. The first parameter is the cut proportion (CP), which controls the image size of the new sample. The other parameter is the number of cuts (NC), which controls the size of the expanded sample set. In the experiment in Section 3.3.2, the first parameter is set to 0.5, that is, the length and width of the new sample image are half of the original image. The second parameter is set to 100, that is 100 new sample images are cut out from each original sample image. In this way, the entire dataset has been expanded 100 times. There are 8000 images in total, including 5600 embroidered Thangka images and 2400 carved Thangka images.
Classification experiment
In the extended dataset, we have carried out classification experiments, using four classical classifiers: K-nearest neighbor (KNN), support vector machine (SVM), artificial neural network (ANN) and naive Bayes algorithm (NB). In KNN algorithm, the number of neighbors is set to 30; SVM algorithm uses RBF kernel function, parameter C is set to 0.025; ANN uses full connection mode, only one hidden layer, the number of hidden layer neurons is 100; NB uses the algorithm based on Gaussian distribution.
In order to compare with the features proposed in this paper, two color features are used: variance and skewness of pixels and four texture features: energy, contrast, correlation and homogeneity of image gray level co-occurrence matrix. These six features are widely used in digital image processing.
In the experiment, we randomly scramble all the sample images, select 80% of the samples as the training set, and take the remaining 20% as the test set for the experiment, and take the average precision, average recall and average f1 score of classification as the performance indicators. The overall experimental results are shown in Table 2, the last column is the average value of f1 of the current feature on four classifiers.
It can be seen from the table that the performance of the two types of color features is the worst, and there is almost no classification ability in all four classifiers when using the color features. It is because that there is no prior difference in color between the carved Thangka image and the embroidered Thangka image. The color of Thangka is related to the main topic of Thangka and the idea of the creator, but nothing to do with the type of Thangka.
Four kinds of texture features have excellent performance under KNN classifier, but not in other three classifiers. Wood, jade, metal and other materials are usually used to carve Thangka. The surface of carved Thangka is relatively smooth. The raw materials of embroidery Thangka are various kinds of cloth and silk thread, and the surface is relatively rough. In various classification applications of pattern recognition, generally speaking, the comprehensive performance of SVM, ANN and NB is better than KNN. But in this experiment, the conclusion is totally opposite. This shows that in this experiment, the data distribution of texture features is very close to the preset distribution of KNN algorithm, but the generalization is poor.
Result of the classification experiment
Result of the classification experiment
Among the three features proposed in this paper, ESDC and DHSE perform well in all different types of classifiers, and their average f1 score is the highest among all features. The performance of CID feature in classification experiment is poor. This is because CID is a kind of global related feature. In the extension data set, the sample data is cut from the original image, which destroys its integrity.
The quality of image acquisition seriously affects the follow-up image processing, and the resolution of image will affect the accuracy of feature extraction. In order to analyze the performance of the proposed features in different resolutions, we carry out experiments in this section. When we expand the sample set, we set the cut proportion (CP) to 0.1, 0.2,
The performance of the proposed features in different resolutions
The performance of the proposed features in different resolutions
As can be seen from the Table 3, with the gradual improvement of image resolution, the classification performance of the test set is also gradually improving. At a lower resolution, there is a large error in feature extraction.
Figure 10 shows the average performance of three features when the image resolution increases. The abscissa is the value of data set CP, and the ordinate is the average value of f1 of four classifiers. It can be seen from Fig. 10 that when the resolution is increased, the performance improvement speed of different features is different, the CID feature is the slowest, the DHSE feature is the fastest, and the performance of ESDC at low resolution is higher than that of DHSE .
Performance changes at different resolutions.
This is because the granularity of the three types of features proposed in this paper is different. The CID feature is based on the sub images of highlight and shadow that appear in pairs in the image sample. The granularity is the largest and the calculation is the most difficult, so it is the most affected by the resolution. ESDC takes a single pixel on the edge as the unit, the graininess is the smallest, and it is also the least affected by the resolution. DHSE takes the edge line segment as the unit, the granularity is medium, and the comprehensive performance is the best.
Based on the analyse of highlight, shadow and edge difference between carved and embroidered Thangka, three features have been proposed, namely CID (Consistency of Illumination Directions), DHSE (Distribution of High-light and Shadow near Edge) and SEDC (Similarity of Edges under Different Channels). These three kinds of features are based on different granularity, which are sub graph level, pixel level and edge level. They reflect the difference between carved Thangka image and embroidered Thangka image from different semantic levels. Experiments show that in the proposed sample space, samples are distributed within class and dispersed among classes. Some overlapping samples also conform to the characteristics of the sample itself. This indicates that the proposed features have strong expressive ability for the difference between carved Thangka and embroidered Thangka.
However, the features proposed in this paper require high quality of image samples, and the accuracy of feature extraction is low when the image resolution is low. At the same time, the features proposed in this paper are based on color images, which can not effectively process gray images. In spite of the sample data set expansion in the classification experiment, because the new samples are sub images from the original samples, in essence, the number of samples used in the analysis is still small. Some parameters in the experiment need to be set manually. All these shortcomings are the direction of future work improvement.
Footnotes
Acknowledgments
This work is supported by the National Natural Science Foundation of China (No. 61162021, 61562002), Scientific Research project of Gansu University of Political Science and Law (No. 2017XQNLW14), and Project of Innovation Ability Improvement of Colleges in Gansu Province (No. 2019A-091).
Conflict of interest
The authors declare that they have no competing interests.