
Abstract
Today’s Image processing tools have matured to a level where its users can effortlessly modify or enhance the images according to their requirement. A misuse of such tools has created a necessity for authenticating images to ensure its correctness. Image Forensics deals with the study of different kinds of manipulation on images and their detection. Image forgery detection algorithms detect forgery related artifacts which can be distinguished using specific image properties. Texture-based features have been widely used to detect forgery induced texture variations in the images. In this paper, we propose Region and Texture combined features for Image Forgery Detection. The Region-based approaches like – Edge-based Region Detection, Saliency-based Region Detection, and Wavelet-based Region Detection are captured, and on these regions, the texture feature- Rotation invariant Co-occurrences among adjacent LBP (RiCoLBP) is applied. The features thus obtained are optimized using Non-Negative Matrix Factorization and fed to a Support Vector Machine (SVM) for classification. The method is extensively evaluated on three benchmark datasets for image forgery detection namely CASIA v1.0, CASIA v2.0 and CUISDE. The performance reveals improved detection accuracies when compared to the state-of-the-art methods in detecting forged and authentic images.
Introduction
Amidst the sea of images circulating on the Internet and social media, one has to be cautious about the authenticity or the origin of these pictures. Digital Image Forgery detection [1] is a new and emerging area of Cyber Forensics with many research possibilities. It aims at identifying and localising image forgeries in digital images. Digital images when subjected to manipulations are harmful to the society or an individual. A manipulated image is capable of creating a false propaganda of a person or a particular event. A forged image may lead to a wrong verdict when produced as an evidence in court. Image forgeries require a scientific proof for acceptance in court. Keeping this in mind, researchers are extensively exploring this problem and producing algorithms which can efficiently detect and localise image forgeries. Their research mainly focus on image processing techniques which bring forth artefacts to detect discrepancies in the forged image and the region of forgery. There are mainly two types of image forgeries: (1) Copy-Move [2] and (2) Splicing [3]. A Copy-Move Forgery is performed by copying parts of the image and pasting it to a location within the same picture. Splicing involves copying and pasting image regions from more than one image. Figure 1 shows the examples of Copy-Move and Splicing image forgery. In Fig. 1(a) the part of image that is extracted to perform the forgery comes from the same image itself. In Fig. 1(b), the part of image that is cut comes from two different images. Image forgery detection techniques fall into two categories: (a) Active [4] and (b) Passive or Blind [5]. Active techniques inject a watermark or digital signature [4, 6] into the image as soon as the image is created or sent out through an insecure medium. At the receiving end, the image is verified for changes in a watermark or digital signature to ensure that it has securely reached without any alterations. Passive techniques [7] look for the properties of natural images and the changes that happen to these properties when it undergoes a forgery. Using this information, it predicts whether a forgery is committed or not. The act of Image Forgery disturbs the natural properties of images like – the statistical correlation among adjacent pixels, uniform sensor noise pattern, normal lighting conditions, resampling patterns and so on. Passive methods are more popular than Active methods as they do not require any pre-processing and are much simpler and widely applicable. Apart from this, most of the images around us in the Internet and social media are not pre-processed with any watermarks or digital signatures and hence, passive detection is the only alternative for Image Forgery detection.

Sample of Copy-Move Forgery (a) and Spliced Forgery (b) from CASIA v1.0 [11] dataset.
This paper aims at solving Image Forgery Detection problem by analyzing specific image regions to examine them for forgery related artefacts. The forgery induced pattern variations are captured along these areas using a texture-based feature and are classified using SVM classifier as forged or non-forged images. Here, we experiment with three Region Detection approaches: Edge-based Region Detection, Saliency-based Region Detection and Wavelet-based Region Detection and their combinations with a popular Local Binary Pattern (LBP) variant texture descriptor – Rotation Invariant Co-occurrences among adjacent LBPs (RiCoLBP) [8]. The efficiency of these methods are then compared in terms of various performance metrics. Nanni et al. [9, 10] have successfully classified images using texture features and Region-based approaches. A few intentions behind selecting a specific region and extracting features from this area are as follows: The area around this region can capture relevant forgery induced texture variations like sharp edges, contrast variations, re sampling differences and so on. As we are considering a subregion from the entire image and finding texture features from this subregion alone, the time required to calculate the texture features is much reduced. Since we confine identifying the features from a given relevant subregion, the features so formed are robust and more discriminative compared to features derived from the entire image.
The rest of the paper is organised as follows: Section 2 briefly describes the review of related works. Section 3 explains the proposed work. Section 4 gives the evaluation of our method and comparison of the proposed work with the state-of-the-art methods. Moreover, Section 5 concludes the paper along with the future work.
In the recent years a lot of research has been focused on image forgery detection. Both Active and Passive methods have been proposed by the research community for efficiently filtering the forged images from the pristine ones. Here, we discuss methods relating to the Passive techniques.
Ng et al. [3] proposed an image forgery detection model which combined the phase and the magnitude features of higher order bicoherence statistics. The accuracy obtained for this model on Columbia Image Splicing Detection Evaluation (CISDE) [12] dataset was 72%. The authors of [13] devised a technique which detected sharp image edges introduced as a result of image forgery using the 2D phase congruency along with the moments of characteristic functions in the Wavelet domain. The 120-dimensional feature vector thus obtained resulted in an accuracy of 82.32% with the CISDE dataset. Dong et al. [14] represented the discontinuities among adjacent pixels of forged images by identifying the sharpness and run length features from the image. This method attained accuracy of 76.52% on CISDE dataset. He et al. [15] investigated the Markov features from the DCT and DWT domains to identify the presence of image forgery. RBF kernel based SVM was used as the classifier and this method yielded an accuracy of 93.55% and 89.76% in the CUISDE and CASIA v2.0 datasets respectively. Zhao et al. [16] used the Run Length Run Number (RLRN) features from the chroma spaces to effectively determine the discriminating features for detecting image splicing using the SVM classifier. The 60-dimensional feature vector resulted in an accuracy of 94.7%. Muhammad et al. [17] obtained a blind image forgery detection technique using Steerable Pyramid Transform (SPT) and Local Binary Pattern (LBP). The LBP histograms of SPT sub bands were extracted and fed to an SVM classifier. Colombia-color [12], CASIA v1.0 and CASIA v2.0 obtained accuracies of 94.8%, 96.39% and 97.33% respectively. The authors of [18] proposed a robust technique based on spatial Markov features from the LBP and Discrete Cosine Transform (DCT) of the image to detect the variation in pixel correlations that occur as a part of image forgery. The SVM was used for classifying the images. This method obtained an accuracy of 99.82% on Columbia Digital Video and Multimedia Lab (DVMM) dataset. Vidyadharan and Thampi [19] proposed a compact multi-texture feature vector by combining four texture descriptors which are: LBP, Local Phase Quantization, Binarized Statistical Image Features (BSIF) and Binary Gabor Pattern (BGP). These features are extracted from the SPT sub-bands of the input image are combined together to form the compact multi-texture descriptor. The descriptor so obtained is reduced using ReliefF method and is given to a Random Forest classifier for classifying images into forged and pristine. This method gained accuracies of 94.13% on CASIA v1.0, 97.03% on CASIA v2.0 and 92.01% on Colombia dataset. LBP pattern variations in the DCT domain from the chrominance channels of the image was used by Alahmadi et al. [20] to capture the image forgery related artefacts. They divided the input image into overlapping blocks and extracted the LBP-DCT features. The standard deviations of the DCT coefficients obtained was given to the SVM for classification. Accuracies of 98.33%, 95.41% and 91.14% was observed in CASIA v2.0, CASIA v1.0 and Colombia respectively.
Proposed work
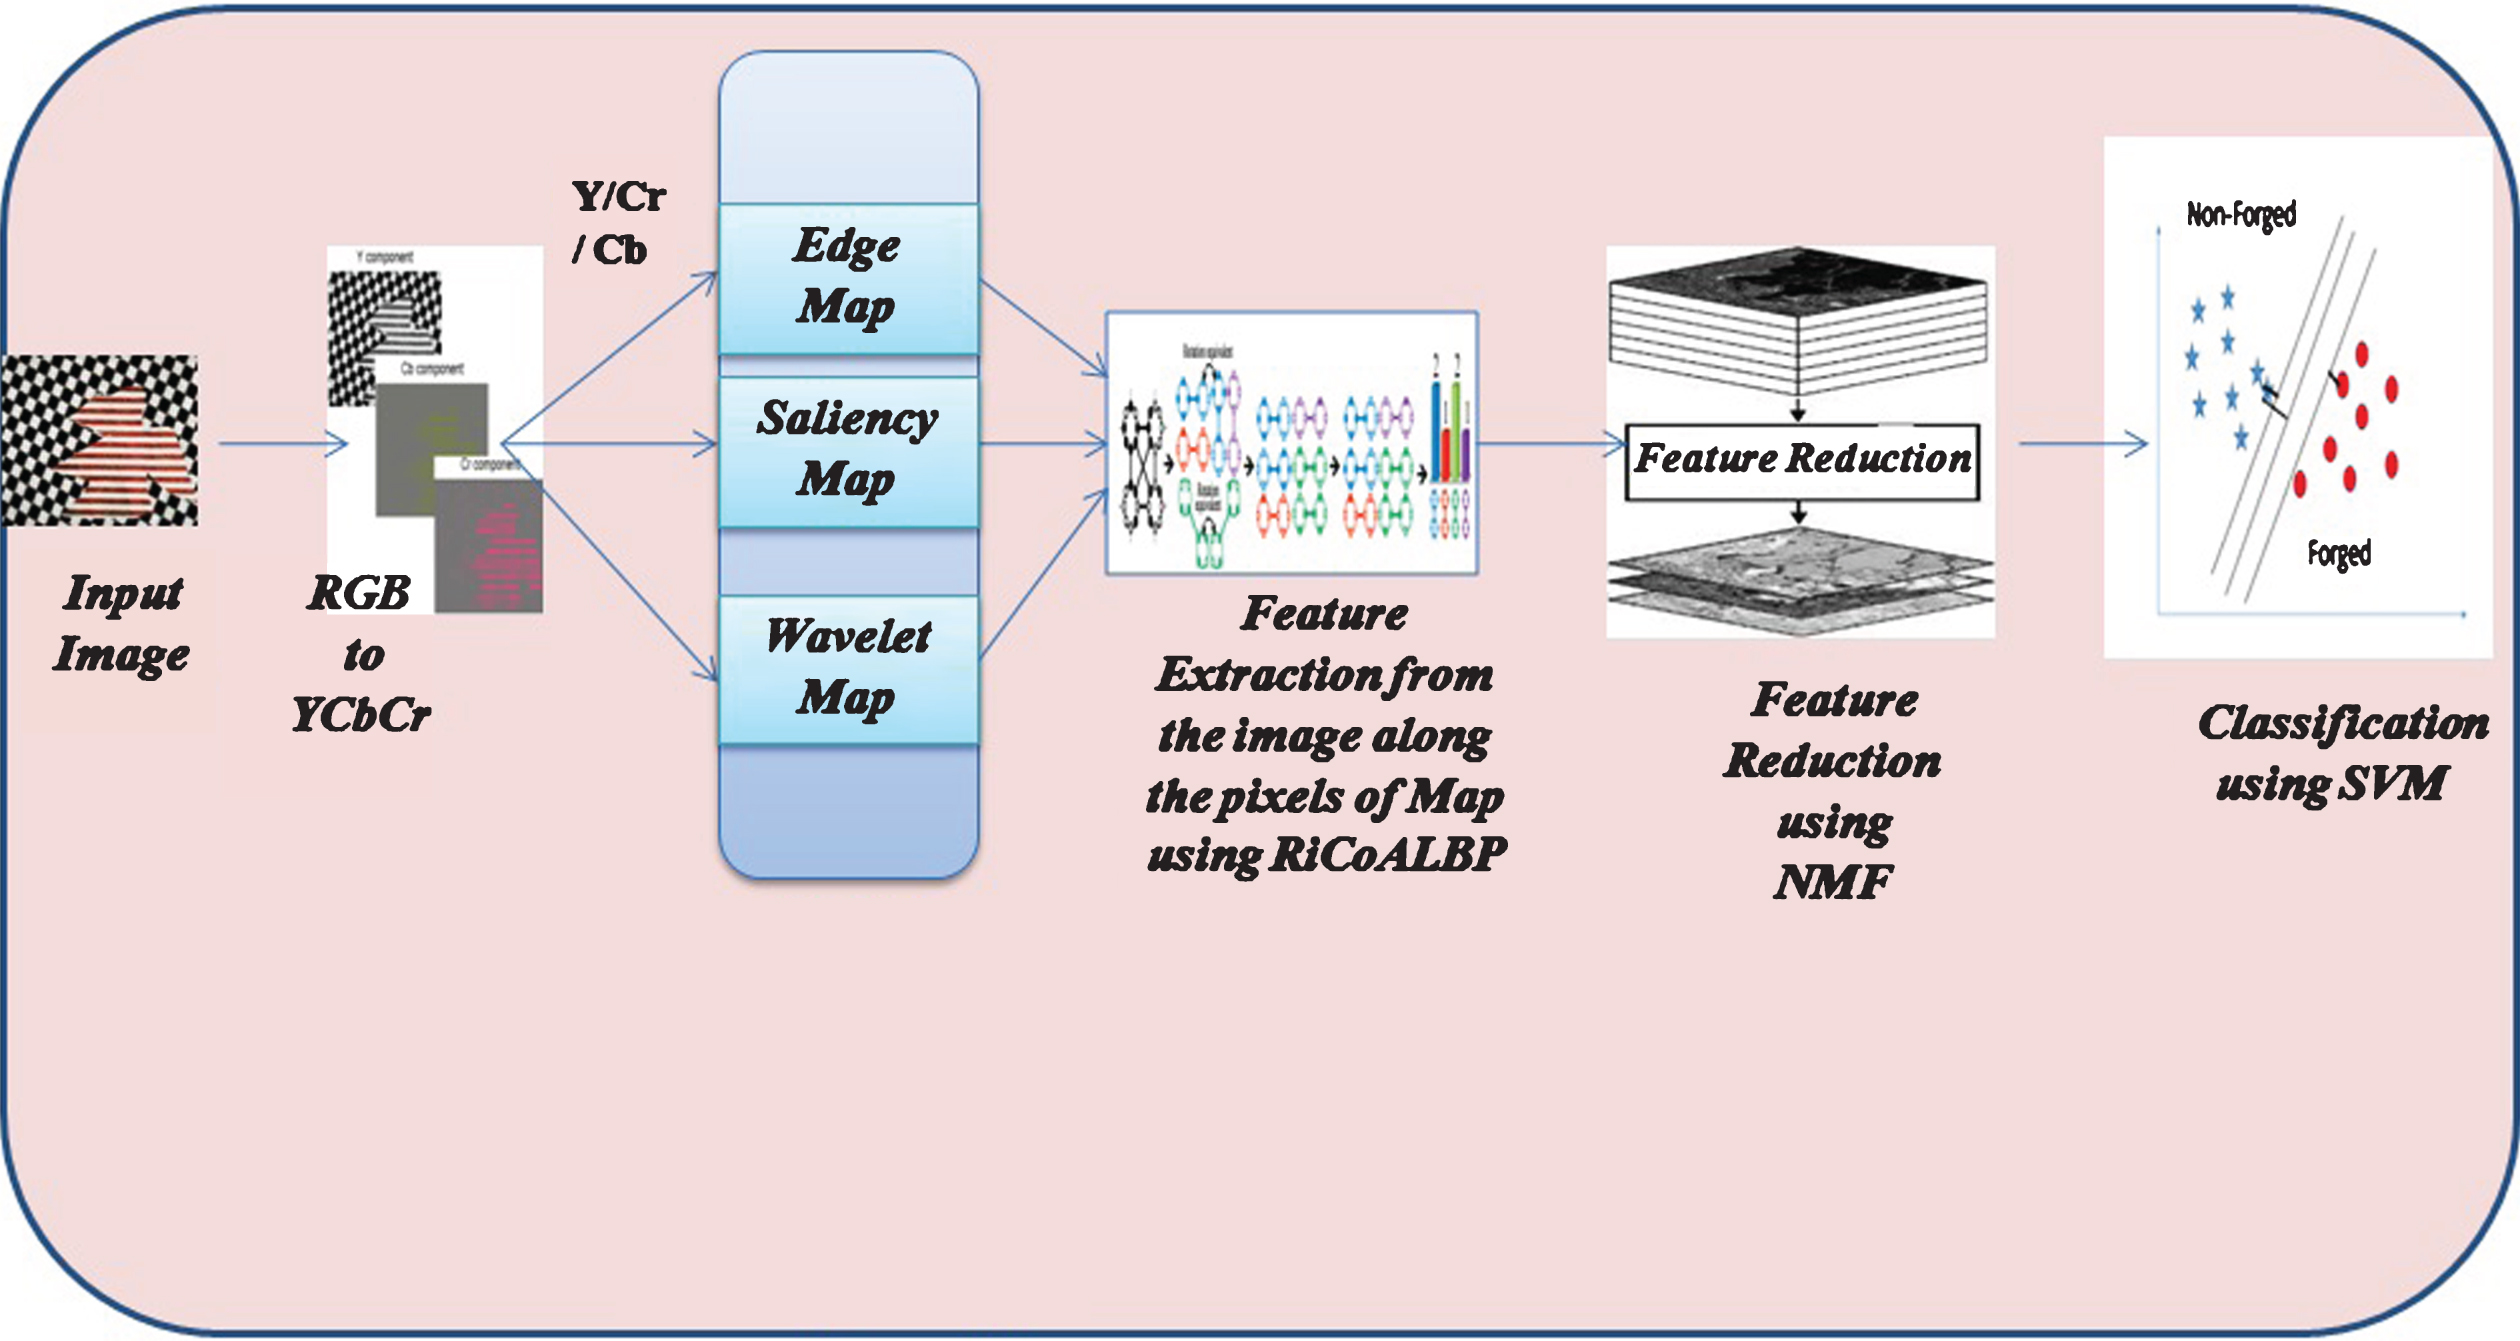
Figure 2 gives a block diagram of the proposed work. As illustrated in the diagram, there are five main modules in this work:
Conversion of the RGB image to YCbCr colorspace. For each Region Detection approach (Edge-based Region Detection/Saliency-based Region Detection/Wavelet-based Region Detection) regions are extracted from the Y or Cb or Cr image using the three approaches. Feature extraction using RiCoLBP for each of the region extracted in Module 2. Dimensionality reduction using NMF. Classification of the reduced features using SVM into forged and non-forged images.
A flowchart of the Proposed Work.
In
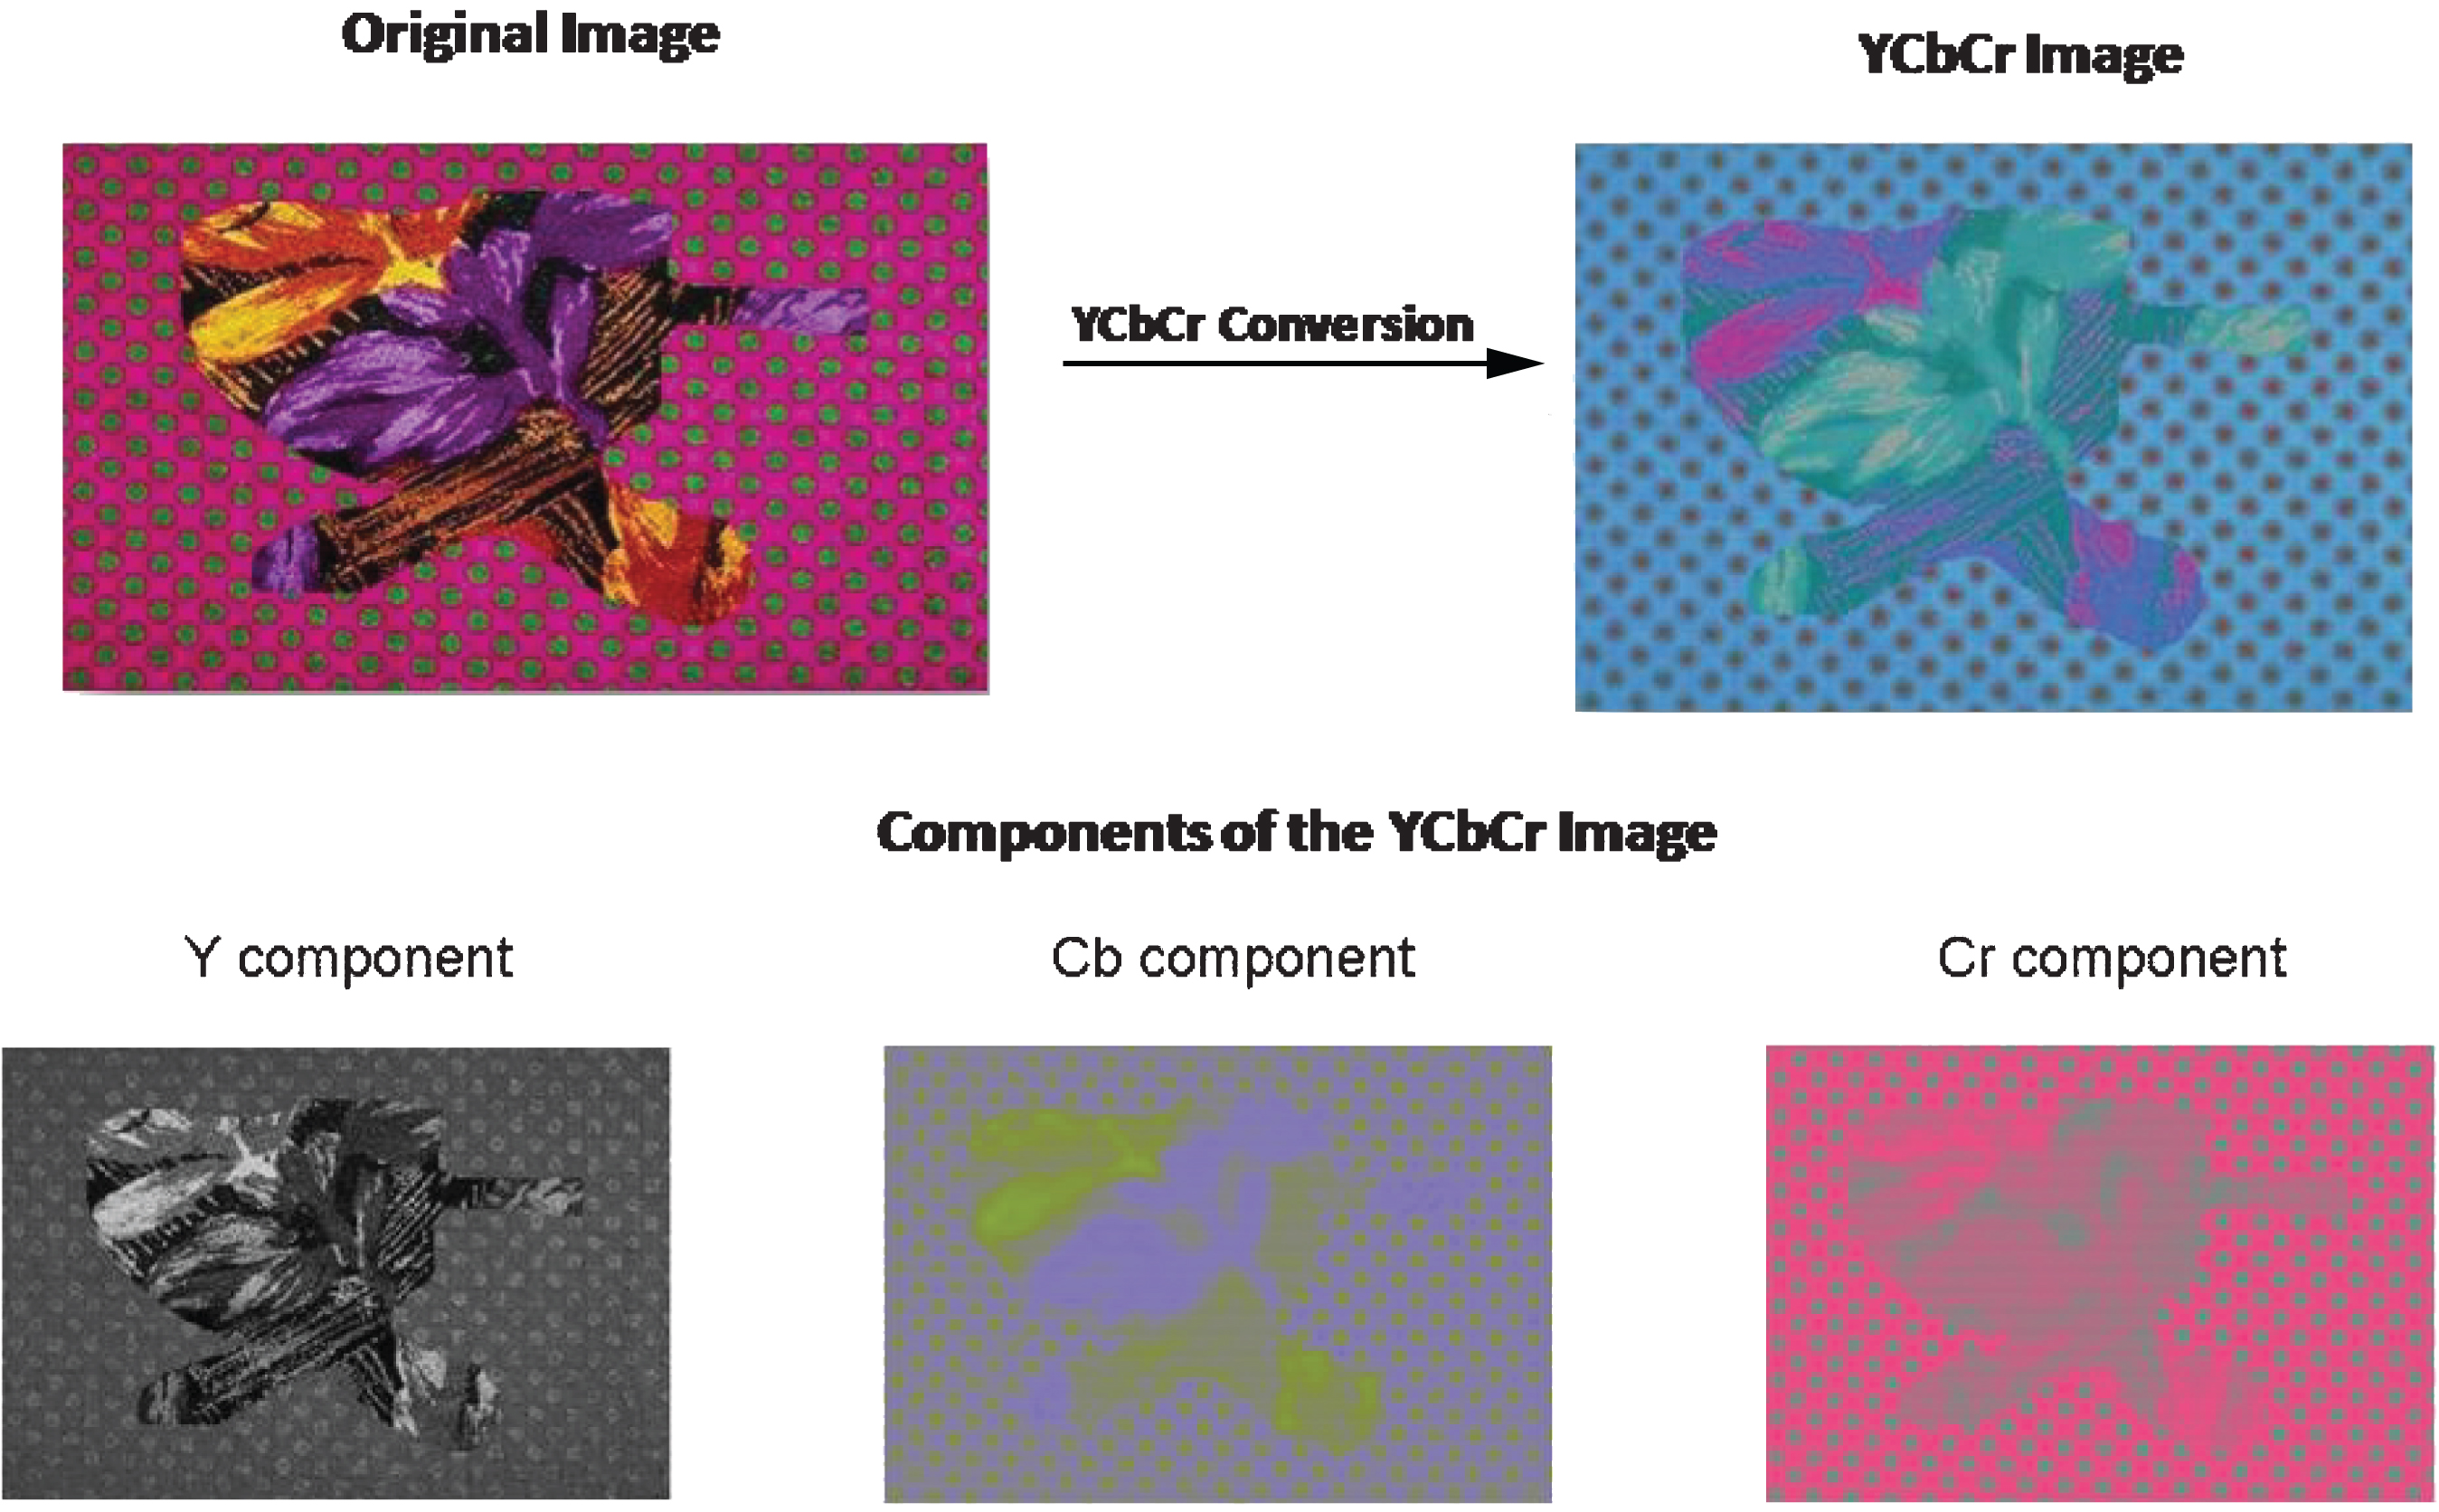
The sample image is taken from the CASIA v1.0 dataset. The first row shows the input image converted to YCbCr domain. The second row shows the Y, Cb and Cr images respectively.
In
Salient regions locate the relevant objects or area in a picture [25]. ‘Salient object detection’ – identifies and segments the salient portions in the image. Image Saliency and its relation to image forensics are less explored and only very few works like [26, 27] are noted in the literature. Here, we consider the saliency map as the region of interest because the sharp boarders observed in spliced images can be seen as salient regions in the chrominance channels obtained in Module 1. So the region of saliency can be considered for further analysis for detecting image forgery.
Wavelets can analyze abrupt changes in signals [28] when compared to the Fourier Transforms. The sudden changes denote sharp edges, texture variations, contrast differences and so on. These variations can be closely examined when a wavelet transformed is performed on the image.
In
In
Finally in
The following subsections contain a detailed description of the methods used in each phase: The YCbCr conversion, Region-based approaches - Edge-based Region Detection, Saliency-based Region Detection and Wavelet-based Region Detection, the feature-reduction technique: NMF and the SVM classifier.
The JPEG2000 standard is used to transform the input color image to the YCbCr color space. The equation used for conversion is as follows:
The input values from the Red(R), Green(G) and Blue(B) channels of the color image are transformed to the Y(Luminance), Cb(Y-B) and Cr(Y-R) domain.
Three Region Detection approaches are used in our experiments. They are explained in detail in the subsequent subsection.
Edge-based region detection
The Edge-based Region Detection operators used in our experiments are: Sobel, Canny, and Prewitt. These descriptors are chosen based on their efficiency and popularity in detecting edges.
Sobel operator
The Sobel operator is made up of a pair of masks which when convolved with the input image gives the first order partial derivatives at the center of the 3 × 3 window. The first order derivatives denote the gradient changes in the vertical and the horizontal directions. The responses corresponding to the vertical and horizontal gradients (Gx and Gy respectively) are combined to form the absolute magnitude and the orientation at each pixel location.
Canny operator
Canny operator finds the local maxima of the gradient of the image to identify the edges. Strong edges and weak edges are detected separately by the operator, and the output includes the weak edges only if it is connected to the strong edges. This method is robust to noise variations.
Prewitt operator
Prewitt operator is a fast edge detector comprising of a 3 × 3 convolution mask very similar to the Sobel Operator. Here, the image intensity gradient along the vertical and horizontal directions is detected by a pair of masks.
The disadvantages of Sobel and Prewitt is that they are sensitive to noise. Canny is considered to be more accurate for noisy images, except for its complex calculations.
Saliency-based region detection
The Saliency-based Region Detection techniques used in our approach are the Graph-Based Visual Saliency (GBVS) [33] and the saliency model proposed by Itti et al. in [34]. These are the most widely used models for Saliency detection.
Graph-based visual saliency
GBVS extracts the ‘Saliency map’ from the input image by identifying features at mutiple spatial scales. Image properties like color, texture, and orientation are taken for extracting the spatial scale features. A fully connected graph based on each of these attributes is taken, and a Markov Random Field Framework is derived from this graph. The equilibrium distribution of nodes, states, edge weights and the transition probabilities is treated as the saliency maps. In the equilibrium distribution, nodes that are highly dissimilar to surrounding nodes are assigned larger values.
Itti koch model
One of the earliest attention model was proposed by Itti et al. [34] in 1998. This model used multi-scale image features based on orientation, color and luminance which capture and combine details of each location on the image into a saliency map. A bottom-up approach was used to generate the map.
Wavelet-based region detection
Wavelets are widely used in many image processing applications like image compression, noise removal, object detection etc. A two-dimensional Wavelet consists of a 2D Scaling function φ (x, y) and three 2-D wavelet functions ψ i (x, y). Here i denotes the variation in intensity along the Horizontal(H), Vertical(V) and Diagonal(D) directions. These functions are applied on the input images to obtain the three directional details at different scales. The wavelet functions used in our approach are the DCT and DWT wavelets.
Rotation invariant Co-occurrence among adjacent LBP (RiCoLBP)
Rotation invariant Co-occurrences among adjacent LBPs (RiCoLBP) was proposed by Nosaka et al. in 2013 which is an extension of their earlier work [35] (Co-occurrences among adjacent LBP-CoALBP). The basic-LBP lacks the structural information among the binary patterns. To incorporate this information, the spatial co-occurrences among adjacent LBP pairs is obtained by calculating the auto-correlation matrix among each LBP pair in the image. The CoALBPs obtained for the entire image is converted to a single CoALBP histogram feature. The CoALBP at r is represented as:
Inorder to select the relevant features and to reduce the dimensionality of the feature vectors we use NMF. Let
Following the feature reduction is the classification phase where the authentic images and forged images are filtered into two classes. The classification or filtering is achieved using the SVM classifier [36]. The RBF kernel of the SVM transforms the input feature space into a larger dimensional feature domain where it can be linearly separated. The SVM hyperplanes which separates the classification boundary determines the maximum margin for separating the data points in the new feature space. On initial testing, Radial Basis Function (RBF) was found superior to other kernel functions like linear, polynomial and sigmoid. The RBF kernel function is defined as follows:
This section describes the datasets used for evaluation, the experimental settings, the performance metrics and the experiments and their results.
Datasets
The proposed method is evaluated using three datasets: CUISDE, CASIA v1.0 and CASIA v2.0. A brief description of the datasets is given in Table 1.
Description of datasets
Description of datasets
CUISDE dataset: This dataset consists of 183 pristine images and 180 forged images with the image resolutions in the range 757 × 568 to 1152 × 768. All the images are stored in the tiff format.
CASIA v1.0 dataset: CAIA v1.0 contains 800 authentic images and 921 forged images, all of which are stored in the jpeg image format. All the images have a resolution of 384 × 256.
CASIA v2.0 dataset: This dataset is an extended version of CASIA v1.0, incorporating with it a total of 12614 images of which 7491 are authentic and 5123 are spliced. It has images stored in a variety of image formats like jpeg, tiff and bmp. The image resolutions also vary between 384 × 256 and 900 × 600.
The proposed method is implemented using MATLAB 2014a. For each dataset, the input images are read one-by-one and converted to the YCbCr domain after which the corresponding region (Edge- based Region or Saliency-based Region or Wavelet-based Region) is extracted. The pixels that are included in the extracted region alone are considered for obtaining the RiCoLBP texture features. The dimensionality of the features thus obtained, is reduced using the NMF. The reduced feature vector is given to a RBF kernel-based SVM classifier for classification. As a testing protocol, a ten fold-cross validation is performed by randomly dividing the input data into 10 equally-sized sub-samples. From the 10 sub-samples one is retained for testing and the rest for training the data. This step is repeated ten times (folds), thus obtaining ten results which are averaged to give the final value. A ten-fold grid search is also performed in order to effectively tune the Cost and Gamma values of the RBF kernel. The same procedure is repeated on all the datasets.
Performance evaluation matrics
On labelling the images in the dataset for training and testing, we consider the doctored images as positive and the pristine images as negative. We have used the following performance metrics to evaluate our results.
Here, TP, TN, FP and FN denotes the True Positives (TP – the forged images that are classified as forged), True Negatives (TN – the pristine images which are classified as pristine), False Positive (FP – the pristine images which are classified as forged) and False Negatives (FN – the forged images which are classified as pristine).
Accuracy denotes the percentage of images which are correctly classified and it ranges between 0 and 100. Precision and Recall are calculated based on Equations 9 and 10. Precision gives the probability that the detected images are actually the tampered ones. Recall gives the probability that all the tampered images are detected correctly or it is otherwise the True Positive Rate (TPR). F-Measure gives the Harmonic Mean of the Precision and Recall values. It combines the Precision and Recall into a single value. Equation 11 calculates the F-measure using the Precision and Recall. The False Positive Rate (FPR) calculated in equation 12 gives the percentage of pristine images which is incorrectly classified as tampered.
Several experiments are performed to examine the efficiency of our method. The following set of experiments are conducted on each category of region detectors (Edge-based Region Detector, Saliency-based Region Detector and Wavelet-based Region Detector): The effect of Gray, Y, Cb and Cr channels on the accuracy. The effect of different region detection algorithms on various performance metrics. The effect of different RiCoLBP scales and radii on the accuracy. The effect of Feature Reduction on the accuracy.
The experiments from Sections 4.4.1 to 4.4.5 are conducted on CASIA v1.0 dataset. The parameters obtained for the best results on CASIA v1.0 are noted and are used to perform further experiments with CASIA v2.0 and CUISDE dataset. Finally, a comparison of our method with the state-of-the-art methods is presented.
The effect of Gray, Y, Cb and Cr channels on the accuracy
In this experiment, we study the effect of Y, Cb and Cr channels in detecting forged images. We perform the experiment as in Fig. 2 taking each channel separately and identifying region descriptors using Sobel operator for Edge-based Region Detection, GBVS algorithm for Saliency-based Region Detection and DWT for Wavelet-based Region Detection. This is followed by extracting the texture descriptors for each using simple RiCoLBP (scale = 1, radius = 2). Figure 4 shows the results obtained. In the case of Edge region detector, Cr channel shows the highest accuracy of 92.16%. The accuracies calculated for Salient regions are lower when compared to the Edge-based regions. In the case of Salient Regions, the chroma channel Cb gives the highest accuracy value of 76.23%. The Wavelet based region detection method gives the highest accuracy of 82.28% for the Cr channel. The results indicate that in all the cases, Cb or Cr channel has the highest accuracy. This shows the efficiency of the chroma channels in detecting image forgery.

Accuracies of Gray, Y, Cb, and Cr channels for the three Region Based methods – Edge, Saliency and Wavelets.
This experiment is performed to determine the best region detection algorithm suitable for our method. To conduct this experiment the algorithms used for each region detectors are – The Sobel, Prewitt and Canny algorithms for detecting Edges, The GBVS and Itti-Koch-Niebur for detecting Salient Regions and the DCT and DWT for identifying the Wavelets. The Cr channel of the input image is taken for performing this experiment.
The Table 2 shows the results obtained by our experiments. Among the Edge-based Region Detectors, the Sobel detector gives the best performance with an accuracy of 92.16% though it does not vary much from the other detectors like Prewitt and Canny. In the case of Saliency-based Region Detectors, the GBVS algorithm gives the highest accuracy of 74.61% when compared to the standard Itti-Koch-Niebur algorithm. This is because the GBVS algorithm detect Salient regions better than the Itti-Koch-Niebur. The DWT outperforms DCT in detecting forged images from the authentic ones, the accuracies of each being 82.28% and 79.7% respectively.
A comparison of accuracies for the different Region-based methods
A comparison of accuracies for the different Region-based methods
In this section, we perform a series of experiments to determine the effect of the scales and radii of the RiCoLBP texture descriptor in determining image forgery. The results of this experiment is given in Fig. 5.

Accuracies for different RiCoLBP Scales and Radii for various Region detectors. (a) Accuracies for different scales and fixed radii. (b) Accuracies for different radii and fixed scale.
Keeping radius constant and varying scale In the first experiment, we have assigned the radius of RiCoLBP a constant value (R = 2) and varied the scale with values S = 1, 2, 4. Here we obtain three results, to compare (See Fig. 5(a)) which are: Scale 1 and Radius 2(S1R2), Scale 2 and Radius 2(S2R2) and Scale 4 and Radius 2(S4R2). We have analyzed the results on all the three region descriptors and we observed that Scale 1 and Radius 2(S1R2) gives the the maximum accuracy for all the region descriptors. The maximum accuracies obtained for various region descriptors are: 92.16% for Edge-based Region Detector, 74.61% for Saliency-based Region Detector and 82.28% for Wavelet-based Region Detector.
Keeping scale constant and varying radius In the second experiment, we have kept the scale of RiCoLBP as a constant value (S = 1) and changed the radius with values R = 2, 4, 8. As earlier, we obtained three results (See Fig. 5(b)) which are: Scale 1 and Radius 2(S1R2), Scale 1 and Radius 4(S1R4)and Scale 1 and Radius 8(S1R8). From the results we can observe that Scale 1 and Radius 2(S1R2) gives the maximum accuracy for all region descriptors, the Accuracies being 92.56%, 74.61% and 82.28% for Edge-based Region Detector, Saliency-based Region Detector and Wavelet-based Region Detector respectively.
In this section, we study the effect of combining different RiCoLBP Scales and Radii to obtain a composite feature descriptor. The three scale and radii combinations of the previous experiment (S1R2, S2R2 and S4R2) are concatenated to obtain the combined feature descriptor. The size of feature descriptor so obtained is 136 × 3 =408. The result of the combined feature descriptor for various Region Descriptors are given in Fig. 6. For the Edge-based Region Detector, the combination gives best results for Cr channel with an accuracy of 95.24%. In case of the Saliency-based Region Detector, the accuracy obtained is highest for Cr descriptor with an accuracy value of 78.21%. On applying the Wavelet-based Region Detector, the maximum accuracy is for the Cr channel with an accuracy of 85.67%. It can be observed that in all the cases, the combination gives a better result than the individual scale-radius pair.

Accuracies of combined RiCoLBP Scales and Radii–(S1R2 + S2R2 + S4R2) of the Region detectors (Edge-based Region Detector, Saliency-based Region Detector and Wavelet-based Region Detector) of CASIA v1.0.
To examine the effect of Feature Reduction, we use the combination used in the previous experiment (S1R2 + S2R2 + S4R2). As specified in Section 3, the NMF method is used for Feature Reduction. The results of Feature Reduction are presented in Fig. 7(a) and (b). NMF could reduce the feature vector sizes from 408 to 80 on average. Figure 7(a) shows the effect of feature reduction on the individual channels of YCbCr. The accuracy obtained before applying NMF and after applying it is presented along with the individual channels. The performance has increased on applying feature reduction. The individual accuracies after applying NMF for Y, Cb and Cr channels are: 65.14%, 97.15% and 97.15% respectively. Except for the Y channel, Feature Reduction has increased the accuracy for Cb and Cr channels. Figure 7(b) shows the accuracies for each region detectors. The accuracy yielded for Edge detector has increased from 95.24% to 97.15%, and that of Saliency-based Region Detector has raised from 78.21% to 86.75%. The accuracy value for Wavelets have hiked from 85.67% to 90.90%. As we can see from the Fig. 6(b), the accuracy rates of all the region based descriptors have increased atleast by 1% on applying the NMF.

Feature Reduction results. (a) The accuracies on individual channels of CASIA v1.0 before and after Feature Reduction. (b) The accuracies on the Region detectors of CASIA v1.0 before and after Feature Reduction.
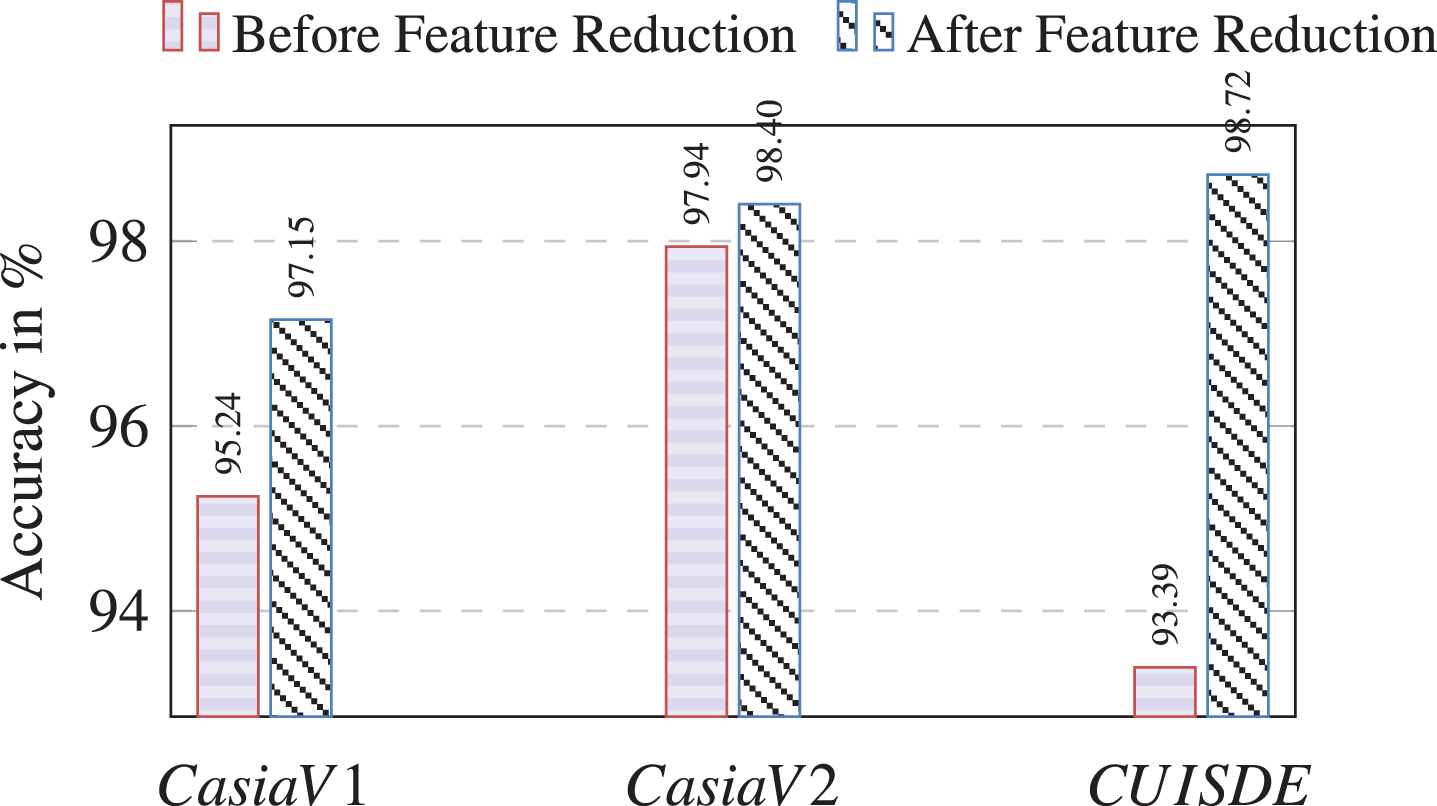
In order to confirm the efficiency of our method, we have evaluated our work on two more datasets: CASIA v2.0 and CUISDE. The experiments were performed in the similar manner as with the CASIA v1.0. The results are reported in Fig. 8 considering the Cr channel and the Edge Region detector for the input image as it gave the best values on all the datasets. The accuracies obtained before and after feature reduction are mentioned in the figure. It can be observed that the accuracies on all the datasets exceeds 97% the accuracies being 98.40% for CASIA v2.0, 98.72% for CUISDE and 97.15% for CASIA v1.0.
Accuracies of CASIA v1.0, CASIA v2.0 and CUISDE datasets.
The proposed method is compared with other state-of-the-art methods on similar datasets. The comparison results are presented in Table 3. The best results of state-of-the-art methods are taken directly from their respective papers. From the table it can be noted that the detection accuracies for CASIA v2.0 (98.40%) and CUISDE (98.72%) exceeds other state-of-the-art methods. The accuracy obtained on the CASIA v1.0 (97.15%) dataset for our method differs from other methods by a negligible value.
Comparison of Accuracy (%) of the proposed method based on Edge Region detector with the state-of-the-art methods.
Comparison of Accuracy (%) of the proposed method based on Edge Region detector with the state-of-the-art methods.
In this work, we propose a passive technique for Image Forgery Detection. Forgery detection is achieved by identifying texture variations in specific regions of the image like –the Edge-based Region, Saliency-based Region and Wavelet-based Region. The forgery induced texture variations are detected using a recently proposed efficient texture descriptor – the Rotation invariant Co occurences among Adjacent LBPs (RiCoLBP). A feature reduction is performed using NMF and the classification of images to forged and non-forged classes is performed using SVM with Grid Searching method. A 10-fold cross validation is also performed to increase the reliability of our results. This technique is extensively evaluated on three benchmark datasets – CASIA v1.0, CASIA v2.0 and CUISDE which contains images with different kinds of forgeries. We have obtained the results with accuracies of 97.15%, 98.40% and 98.72% on CASIA v1.0, CASIA v2.0 and CUISDE respectively for the Edge-based Region Detectors. Our method outperforms the state-of-the-art methods on CASIA v2.0 and CUISDE. On CASIA v1.0 dataset, our method shows a comparable performance. In future, we aim at localising the image forgeries in tampered images.