
Abstract
Aircraft maneuver partition, which dividing flight data into meaningful maneuvers, is an essential preprocess method for health monitoring, flight simulation and flying quality evaluating. Maneuver partition usually needs flight testing and manual interpretation, which is time-consuming, higher cost, and lower versatility. In this paper, a non-supervised automatic method of aircraft maneuver partition (NSAM) is proposed by using data mining without any priori knowledge: Select 6 parameters, height, speed, angle of pitch, angle of bank, angle of yaw, and normal overload; Extract action parts according to the trends of the normal overload, the main parameters; Use the iterative self-organized data analysis algorithm (ISODATA) and divide action parts by numeric features of parameters into classes that represent maneuvers. Applying the NSAM into the small-scale and large-scale data respectively has the results that at least 89% of the maneuvers can be recognized and classified correctly. It indicates that the NSAM is effective and meets the requirements of engineering accuracy.
Introduction
Aircraft flight is a complicated process, and it is difficult to summarize the flight rules from the complete flight takeoff and landing data. However, controlling flight rules is the primary task of structural health monitoring, fault detection, flight quality evaluation, flight data visualization, etc. [1, 2, 3, 4]. It is the most effective way to divide flight actions into a series of specific maneuvers. The so-called maneuver division is to classify the multifarious flight data into several maneuverable action parts with clear physical meaning.
At present, maneuvering division methods mainly include artificial recognition, knowledge base matching pattern recognition, support vector machine, and neural network [5, 6, 7, 8, 9, 10, 11]. These methods, called the supervised learning, rely on the priori expert knowledge. They all require manual interpretation of a large number of flight parameters and the summarization of the partitioning principles from them, or the provision of divided training data. It leads to huge workload and the results obtained are only applicable to specific models, not universal.
In recent years, some researchers put forward the recognition rules for automatically generating the maneuvering identification knowledge base by using optimization algorithm. These rules aim at reducing manual work and have achieved certain effects [12, 13]. However, these methods still rely on prior knowledge and expert experience. The research to overcome this defect is very meaningful.
In this paper, a non-supervised automatic method of aircraft maneuver partition, written as the NSAM, is proposed. The NSAM does not rely on priori knowledge and can divide the complete take-off and landing data into action parts only by the numerical features of parameters. In this method, trend identification technique is adopted to separate flight parameters that may contain maneuvers, and iterative self-organizing cluster analysis is used to classify action parts. Applying the NSAM to the complete flight data of take-off and landing from a certain type of aircraft classifies 13 classes successfully. The physical meanings of a few action parts are explained. It shows that the NSAM is effective.
The non-supervised automatic method of aircraft maneuver partition (NSAM)
The flight data is a series of discrete time series data. The maneuver partition is to divide a long sequence of flight data into several continuous sub-sequences. In the absence of priori knowledge, the isolated flight data is of little significance, and only by dividing the sequence according to the trend changes of flight parameters can the corresponding maneuvers be recognized: When the flight is horizontal, each parameter basically remains stable, and when the maneuvering is under way, the corresponding parameters change according to the trend. Therefore, we propose the following maneuver partition method.
A key parameter is selected as the main parameter, and the flight data is divided into a series of “trend parts” with the trend identification method, in which the main parameter only contains a single trend. Divide and merge the trend parts, and screen out the “action parts” with maneuvering, and calculate the mean and variance of each flight parameter in “action parts”. Then, each “action part” can be uniquely represented by a feature vector composed of means and variances. Clustering analysis is carried out on the feature vectors, and a few sets of action parts are obtained. Ideally, these sets are the classes of maneuvering. Generally, it is necessary to test the clustering results, observe the flying parameter curve, and eliminate the wrong classification.
The algorithm flow chart is shown in Fig. 1.
Flow chart of the NSAM.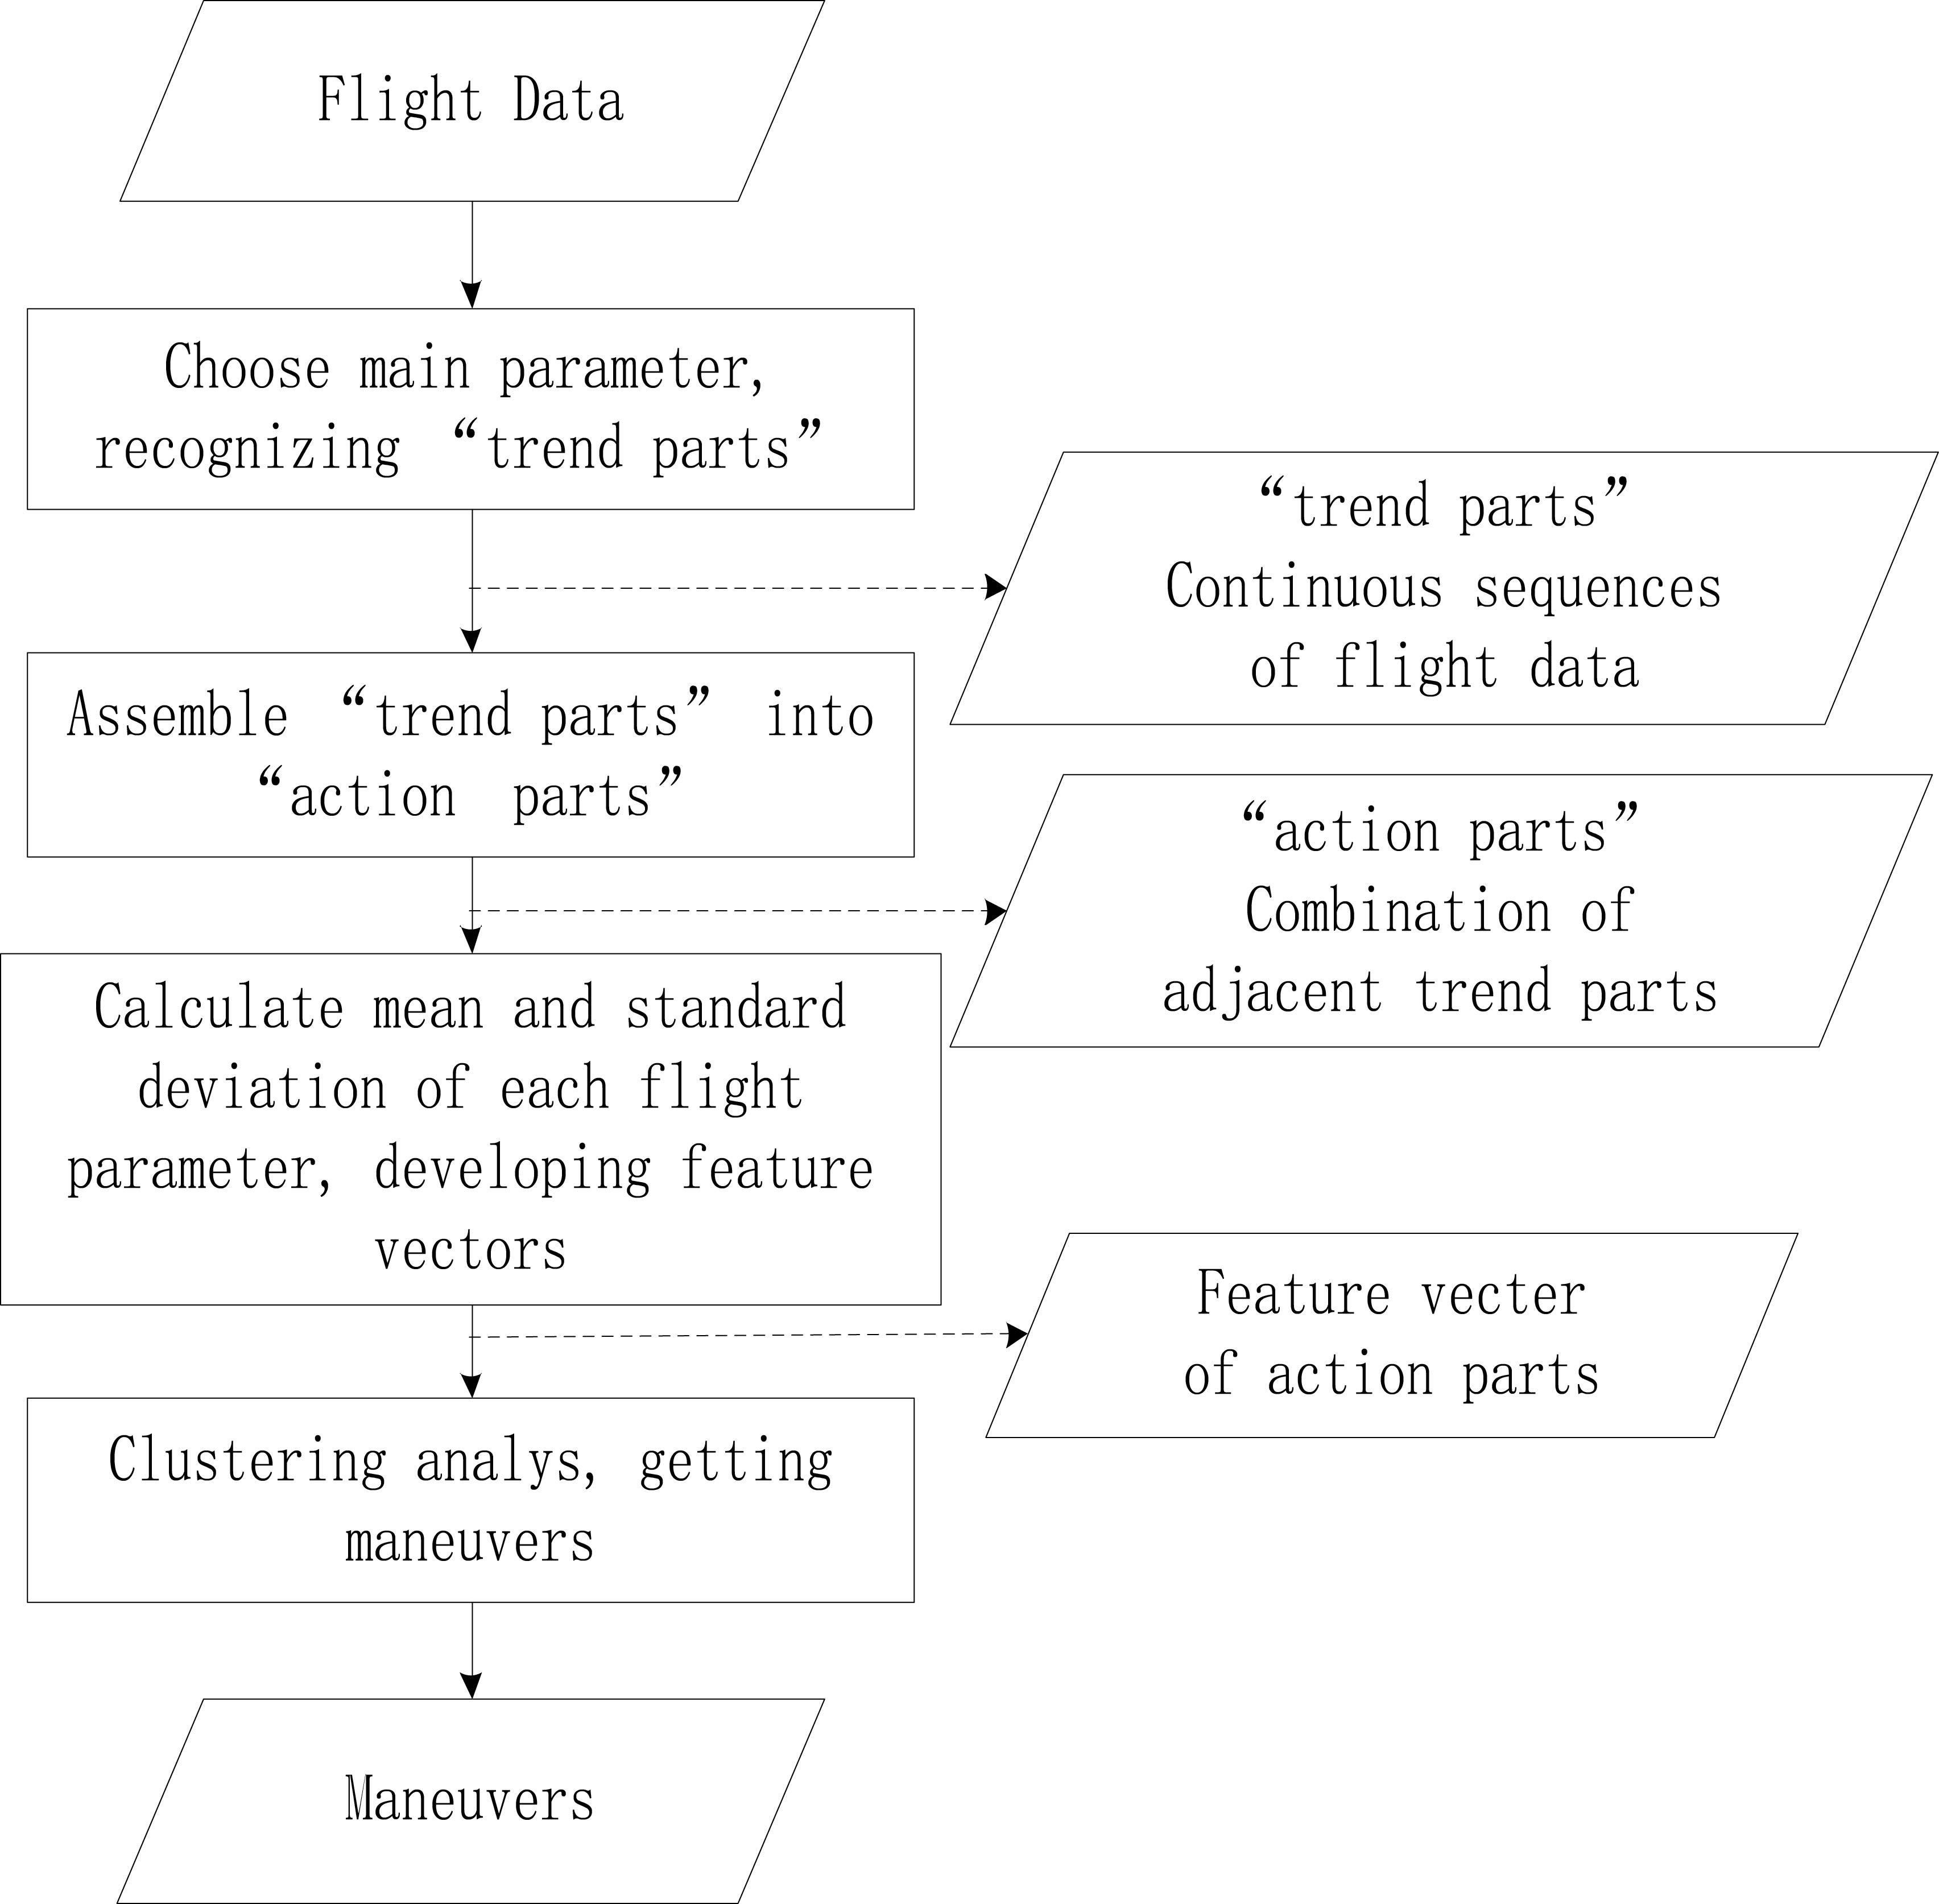
Trend recognizing method with double windows
Trend recognizing technique extracts trend information from noised process data [14, 15]. It extracts qualitative information from quantitative data and describes them. The basic units of describing trends, called “primitives”, generally has nine types, as shown in Fig. 2. The signs of the first and second derivatives of the fragment fitting function can uniquely determine one primitive.
Nine primitives.
Considering the characteristics of high signal-to-noise ratio, clear trend and obvious linear trend of flight data, we propose a simple trend recognition method with double windows.
Three linear primitives for recognition are selected, ascending, descending and leveling, that is, A, C and F in Fig. 2, which is distinguished by slope data of piece-fitting functions.
Denote the fragment sequence containing
where,
and
The fitting parameters can be obtained by the least square method
Specify the slope threshold
If
If
If
Considering the actions often involved in flight with low slope but long lasting, such as slow climbs or hovers, it is obviously improper to use slope only to classify the trend. Define the height difference
Introduce the height difference threshold
The size of the window will affect the effect of trend recognition. If the window is too large, it will ignore the local trend and cause aliasing. If the window is too small, it will be too sensitive to the local details and unable to grasp the overall trend information. We propose a double-window method to solve this problem.
Schematic of double-window model.
In our algorithm, two windows are set (see Fig. 3): one is a sliding window with fixed size, the other is a fixed window with adjustable size. The ends of the two windows overlap and the initial size of both windows is
Data in the windows is up or down. In this case, the sliding window slides 1 unit forward and the fixed window expands accordingly. Examine the slope Data in the windows is flat. In this case, the sliding window slides 1 unit forward and the fixed window expands accordingly. Fit the data in the fixed window and the sliding window respectively, then examine the slope
If If If
The values of three parameters have a great influence on the algorithm.
From the above, given the appropriate slope threshold
The variation of flight data in a maneuvering is not a single trend, but an “undulating” shape formed by the combination of many adjacent trend parts. It is impossible to complete the maneuvering division with only one trend part, so adjacent trend parts need to be combined into meaningful “action parts”.
Considering that data of the horizontal state in flight occupies the majority, furthermore, in the general flight training course, it is usually required to return to the horizontal state after maneuverings. Therefore, as long as each horizontal state is identified, trend parts between the two horizontal stats can be merged into one action part containing maneuvering.
Since the maneuvering may also contains a transitory and similarly horizontal flight, we introduce the minimum length threshold of horizontal flight, denoted by
As the end, it is necessary to make a correction to the partition result. This is mainly due to the fact that the abrupt noise is likely to cut a long horizontal trend part in two, and then the noise between the two horizontal trend parts will be recognized as maneuvering, which is obviously unreasonable. To solve this kind of problem, we only need to decide the lengths of the action parts and cancel those parts with insufficient lengths. The length threshold can be set to twice the length of the initial window, that is,
It should be noted that the action parts obtained so far are only the results after the horizontal flight data are extracted. It’s not clear what kind of maneuvering each part is. It still requires to be classified according to features of flight parameters for each action part. This can be attributed to a pattern recognition problem without supervising, which can be solved by clustering algorithm.
Iterative self-organizing data analysis algorithm
Introduction to algorithm
Iterative self-organizing data analysis algorithm, also known as the ISODATA [16], is a dynamic clustering method that automatically modifies the center and the number of class. The algorithm will automatically select several samples as the clustering center, and adjust the class center through the iteration of the sample mean in following calculations. The algorithm adjusts the number of clustering centers by merging and splitting pattern classes. The basic principle of the ISODATA is to merge the classes with too close distances, cancel the classes with very few samples, and subdivide the classes with too large dispersions. The implementation of the ISODATA is relatively complex, and the detailed process of the algorithm is shown in [16]. Here, we only describe the ideas of the algorithm.
Initialize parameters of the algorithm. There are totally 6 parameters in the algorithm:
Select certain samples as the initial clustering center, classify all samples according to the nearest neighbor principle, and calculate the new class center. Calculate the number of samples in each class, the standard deviation in each class, and the distance between classes. Determine whether to adjust the number of class centers according to values of the given parameters. Determine whether the result meets the requirements. If so, end the calculations; otherwise, return to (b).
The action part is the temporal sequence of flight parameters, so the ISODATA cannot be used directly. It is necessary to extract the features of the sequence to form a feature vector that can represent the action part. In [1], the mean and the variance are used to represent a flight parameter sequence and had already been successful. We use for reference this method to establish feature vectors.
Let
be an action part containing
Firstly, in order to eliminate the difference of numerical magnitude between flight parameters, it is necessary to normalize flight parameters. In this paper, the flight parameters are normalized [
Then, calculate the mean and the variance of each flight parameter.
and
Finally, construct the feature vector
Classification of action parts can be implemented by applying the ISODATA to classify the feature vectors.
In the absence of verified data sets, the relative evaluation method is generally used to evaluate the clustering results [17, 18]. In this paper, the following two indicators are selected.
Distance between class centers. Generally, Euclidean distance is selected.
Where, Sample standard deviation in class,
where,
It can be seen that the function value will be larger when the class spacing is larger and the standard deviation within the class is smaller. It also means that the clustering evaluation will be relatively higher.
The flight data used in our experiments comes from three take-off and landing of certain plane. Learning from [1, 2, 3, 4, 5, 6], we choose 6 parameters, height, speed, angle of pitch, angle of bank, angle of side slip, and normal overload, for analysis. Height is selected as the main parameter because the data of height is small noised, its curve fluctuation is obvious, and meanwhile, the maneuvering are mostly accompanied by regular height changes.
Trend recognizing
After many attempts, a better parameter setting is shown in Table 1.
Parameter setting of trend recognizing
Parameter setting of trend recognizing
The recognition results are shown in Fig. 4. Where, the blue curve shows a horizontal trend, the red curve shows an upward trend, and the green curve shows a downward trend. It can be seen that the accuracy of recognition results is very high.
Trend recognizing result of height parameter (part).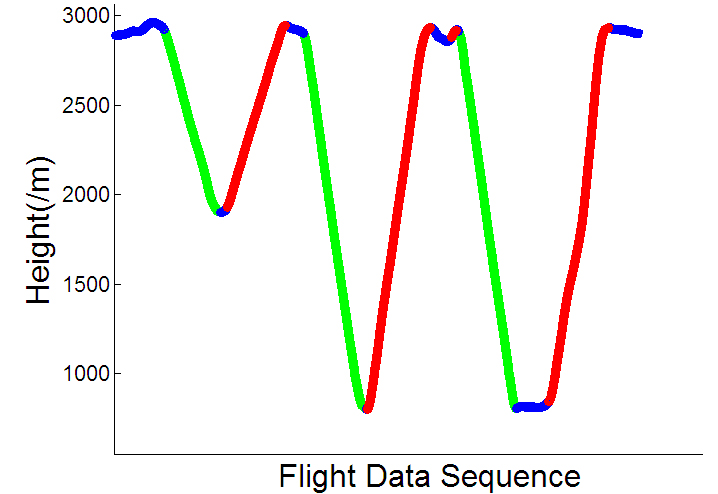
It should be noted that the values in Table 1 are obtained from many tests and have certain universality for height parameters of different models, which are only for reference. It is recommended to choose parameters according to actual data when analyzing different models or selecting different main parameters. If necessary, parameters can be manually set for samples using optimization algorithm (such as the genetic algorithm used in 3.3).
Set
Result of action parts partition (part).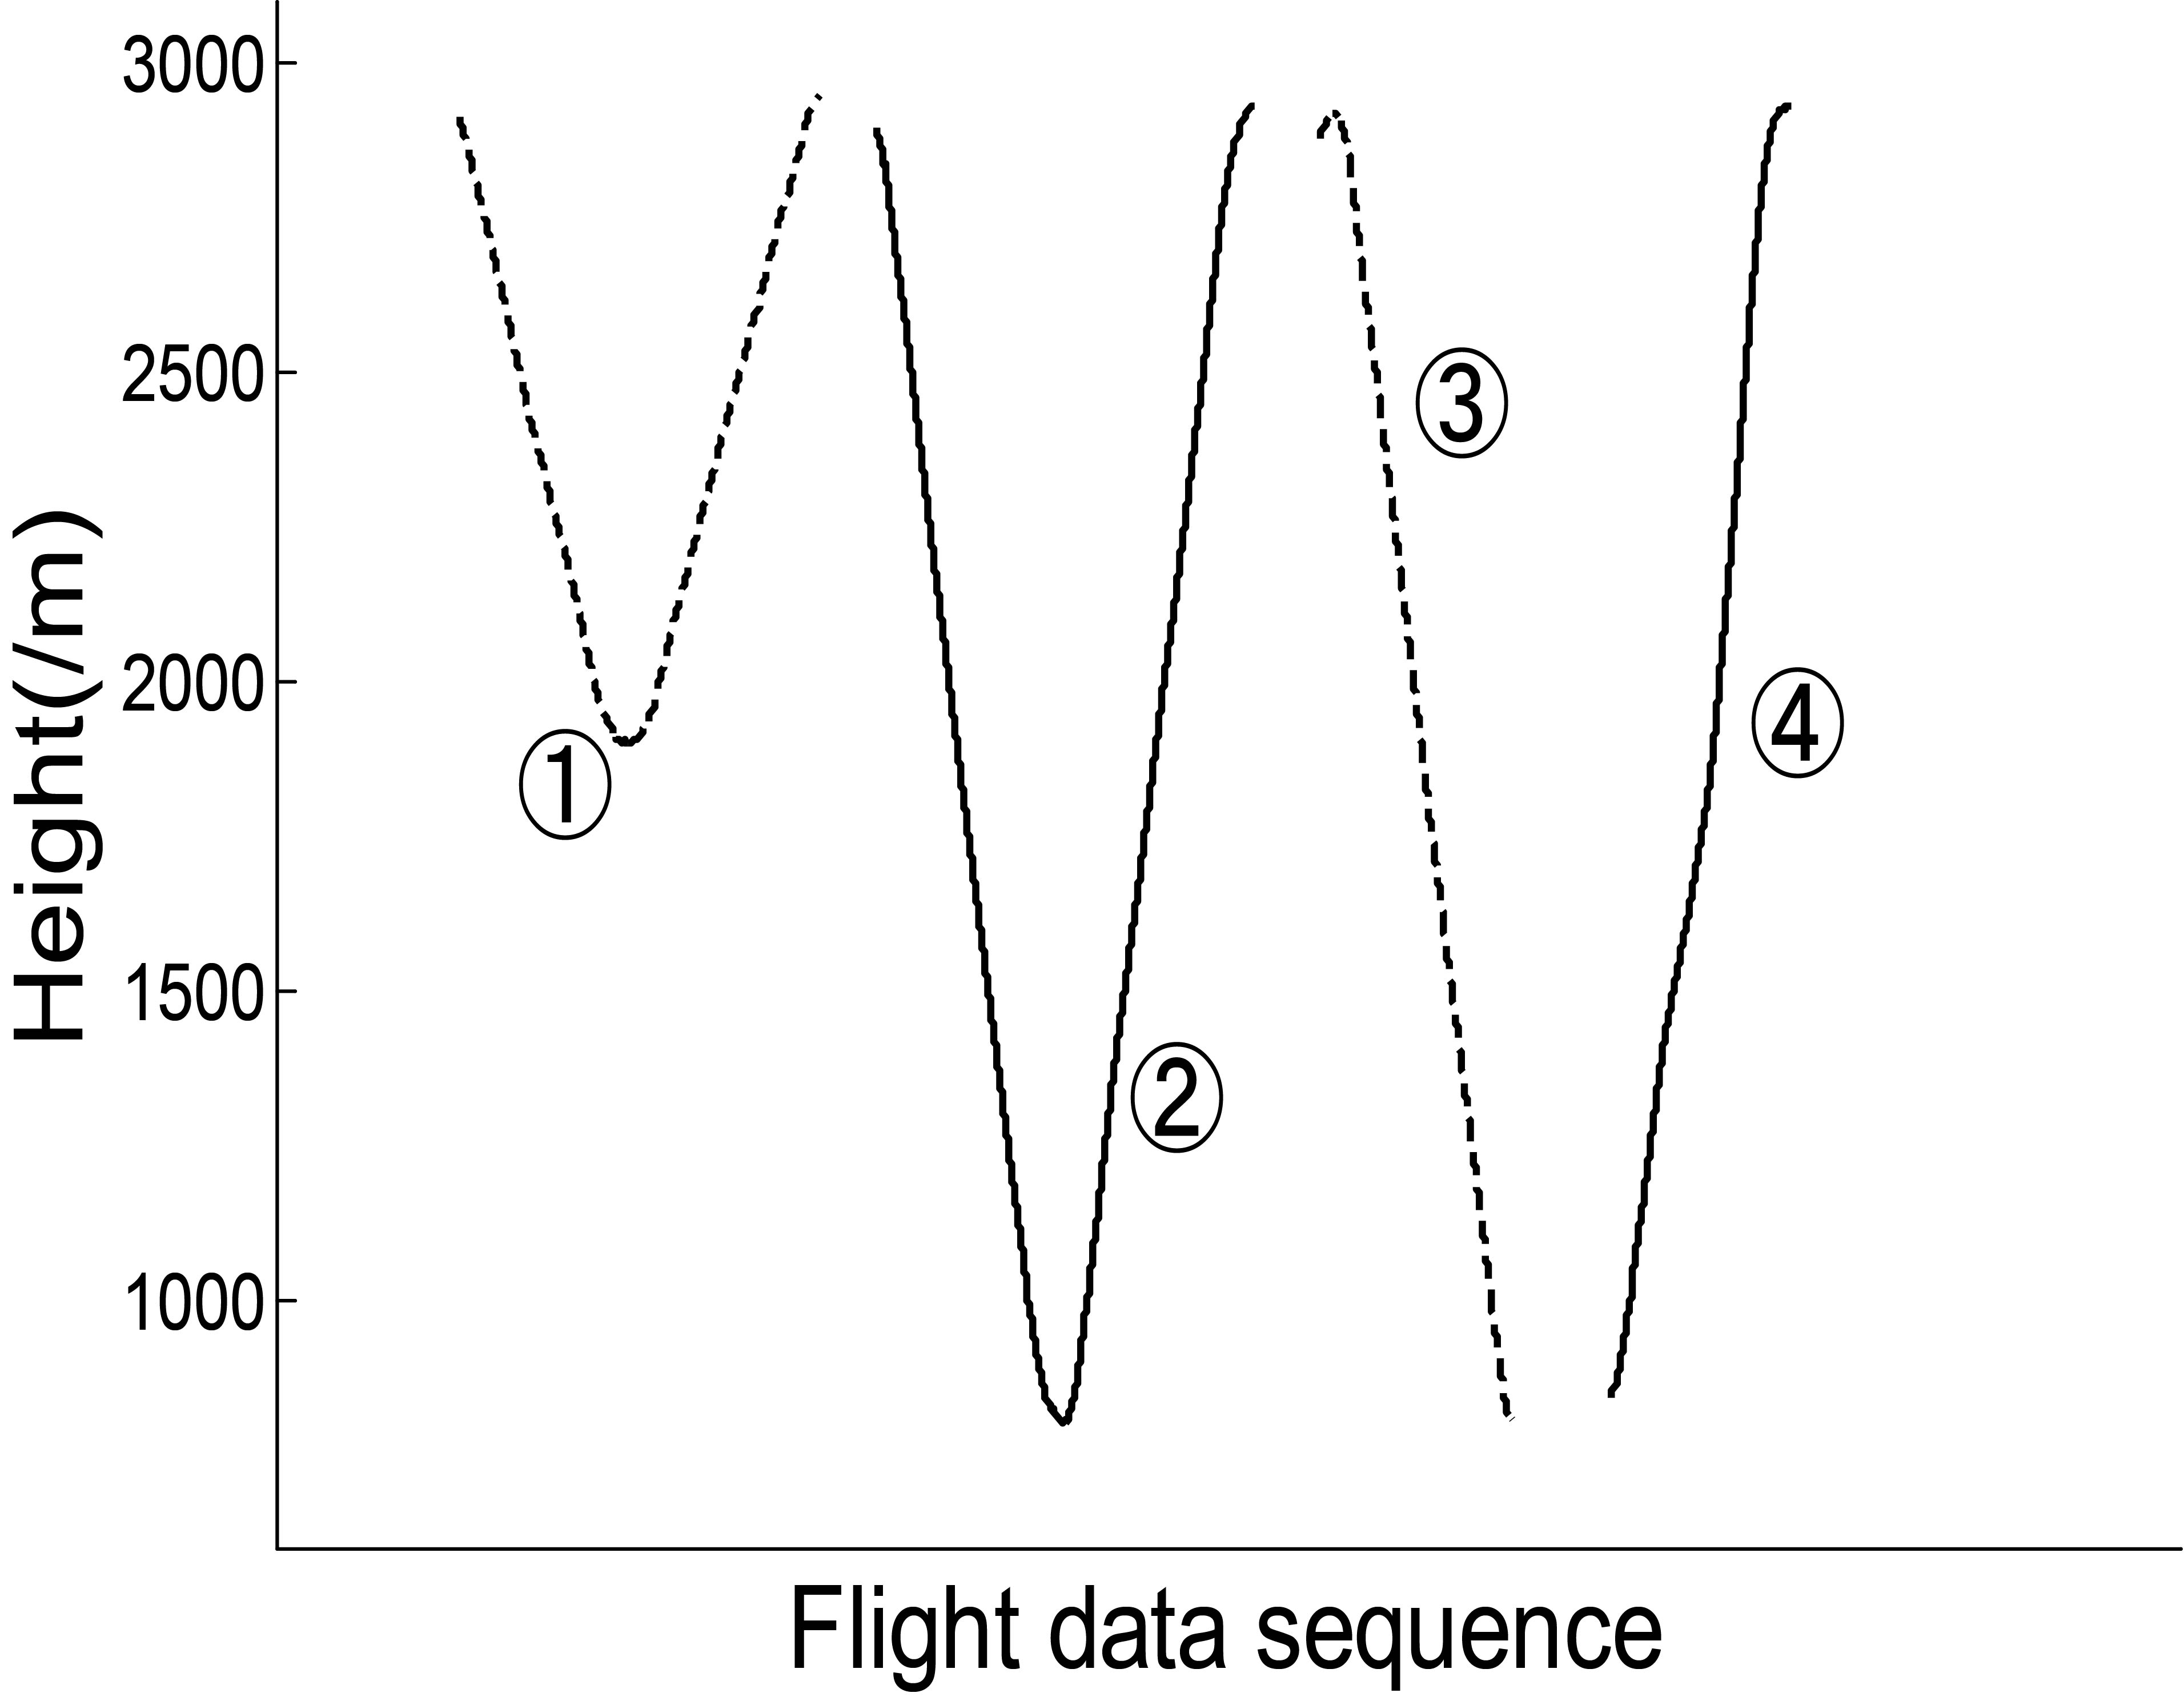
The final result is that 75 action parts and 76 horizontal flight parts are divided from the three take-off and landing data. It can be seen from the local results that the partition of the action parts is basically reliable and can identify the characteristic fluctuations. By using Eq. (4), the parameters in action parts are normalized. By using Eqs (5) and (6), the mean value and variance of parameters in each action part are calculated to construct the feature vector. The results of feature vectors are shown in Table 2. (Only partial results are given due to space limitations).
Feature vectors of action parts
For the six parameters in the ISODATA,
The parameter setting results of the genetic algorithm are shown in Table 3.
Parameter setting of genetic algorithm
The evolution results of the genetic algorithm are shown in Fig. 6.
Evolution curve of genetic algorithm.
The algorithm basically converges at the 70th generation, and the final values are
Set the clustering parameters as
Clustering results
Clustering results
Flight parameter curves of action parts in class 1.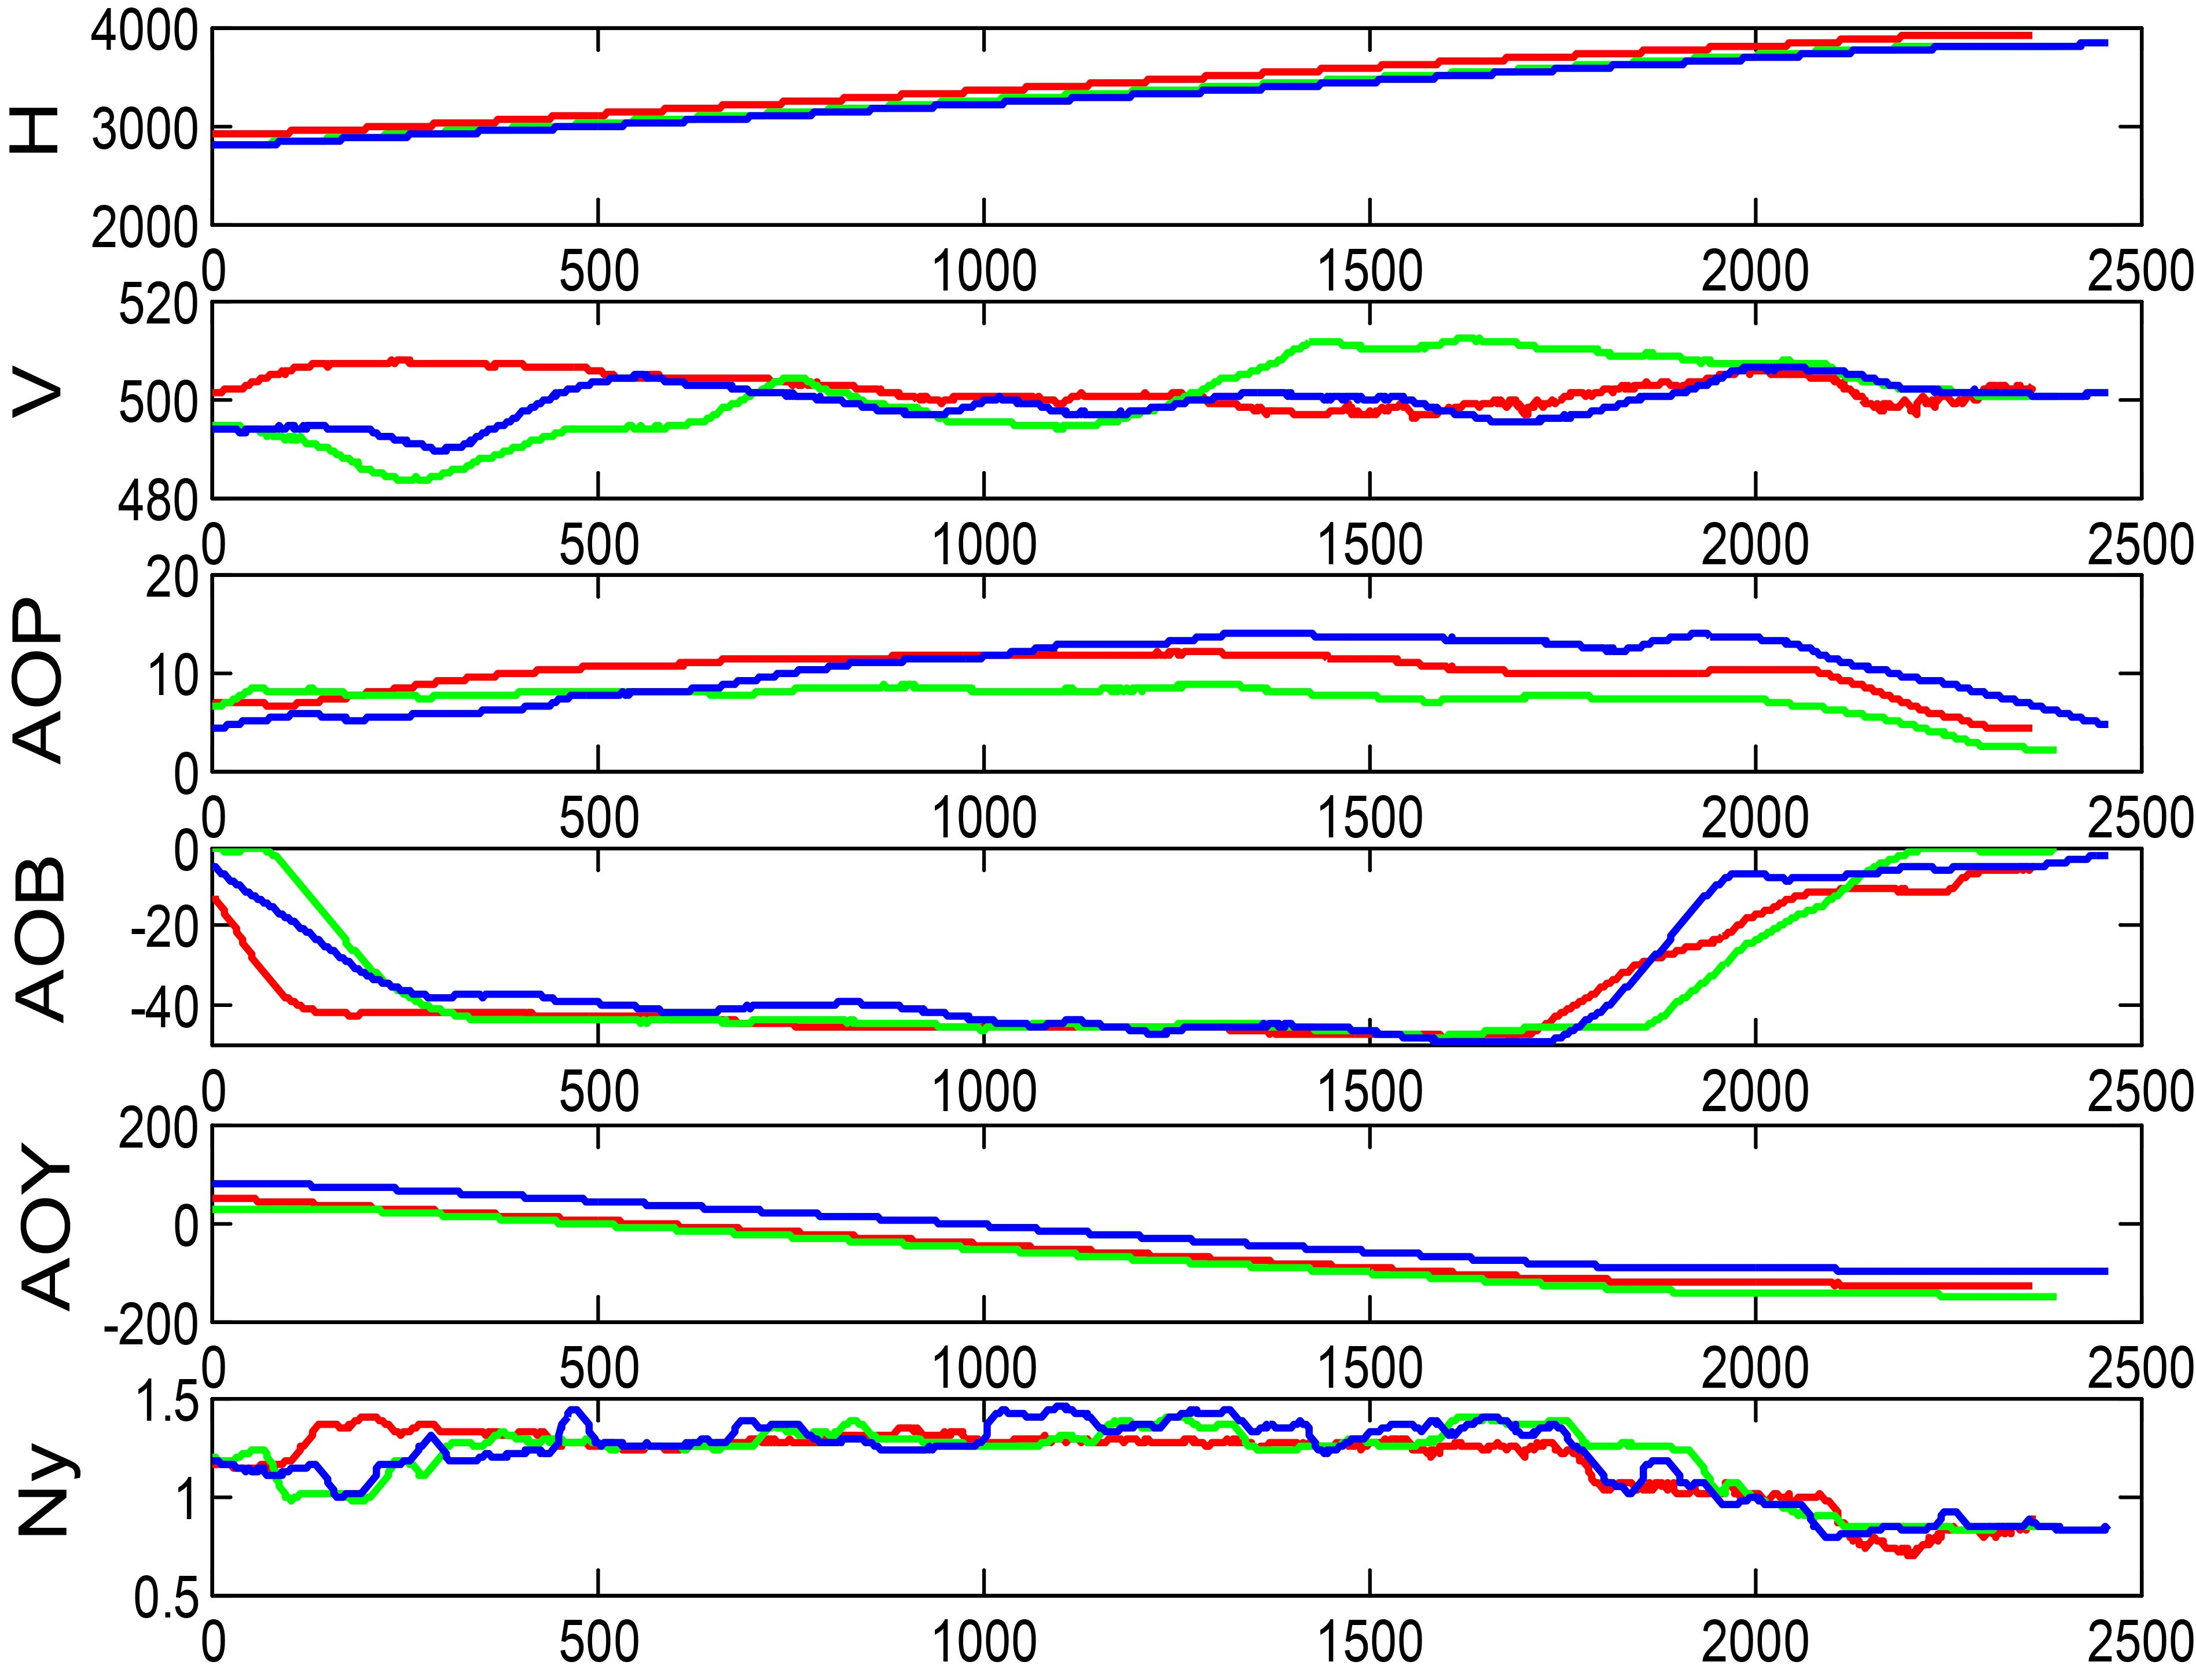
In order to further verify the results of cluster analysis, we select three classes, class 1, 3 and 6, which contains the most action parts. From each of the three classes, three action parts are selected to draw the parameter curves, as shown in Figs 7–9. Where, H is the height, V is the speed, AOP is the angle of pitch, AOB is the angle of bank, AOY is the angle of yaw, and Ny is the normal overload.
Flight parameter curves of action parts in class 3.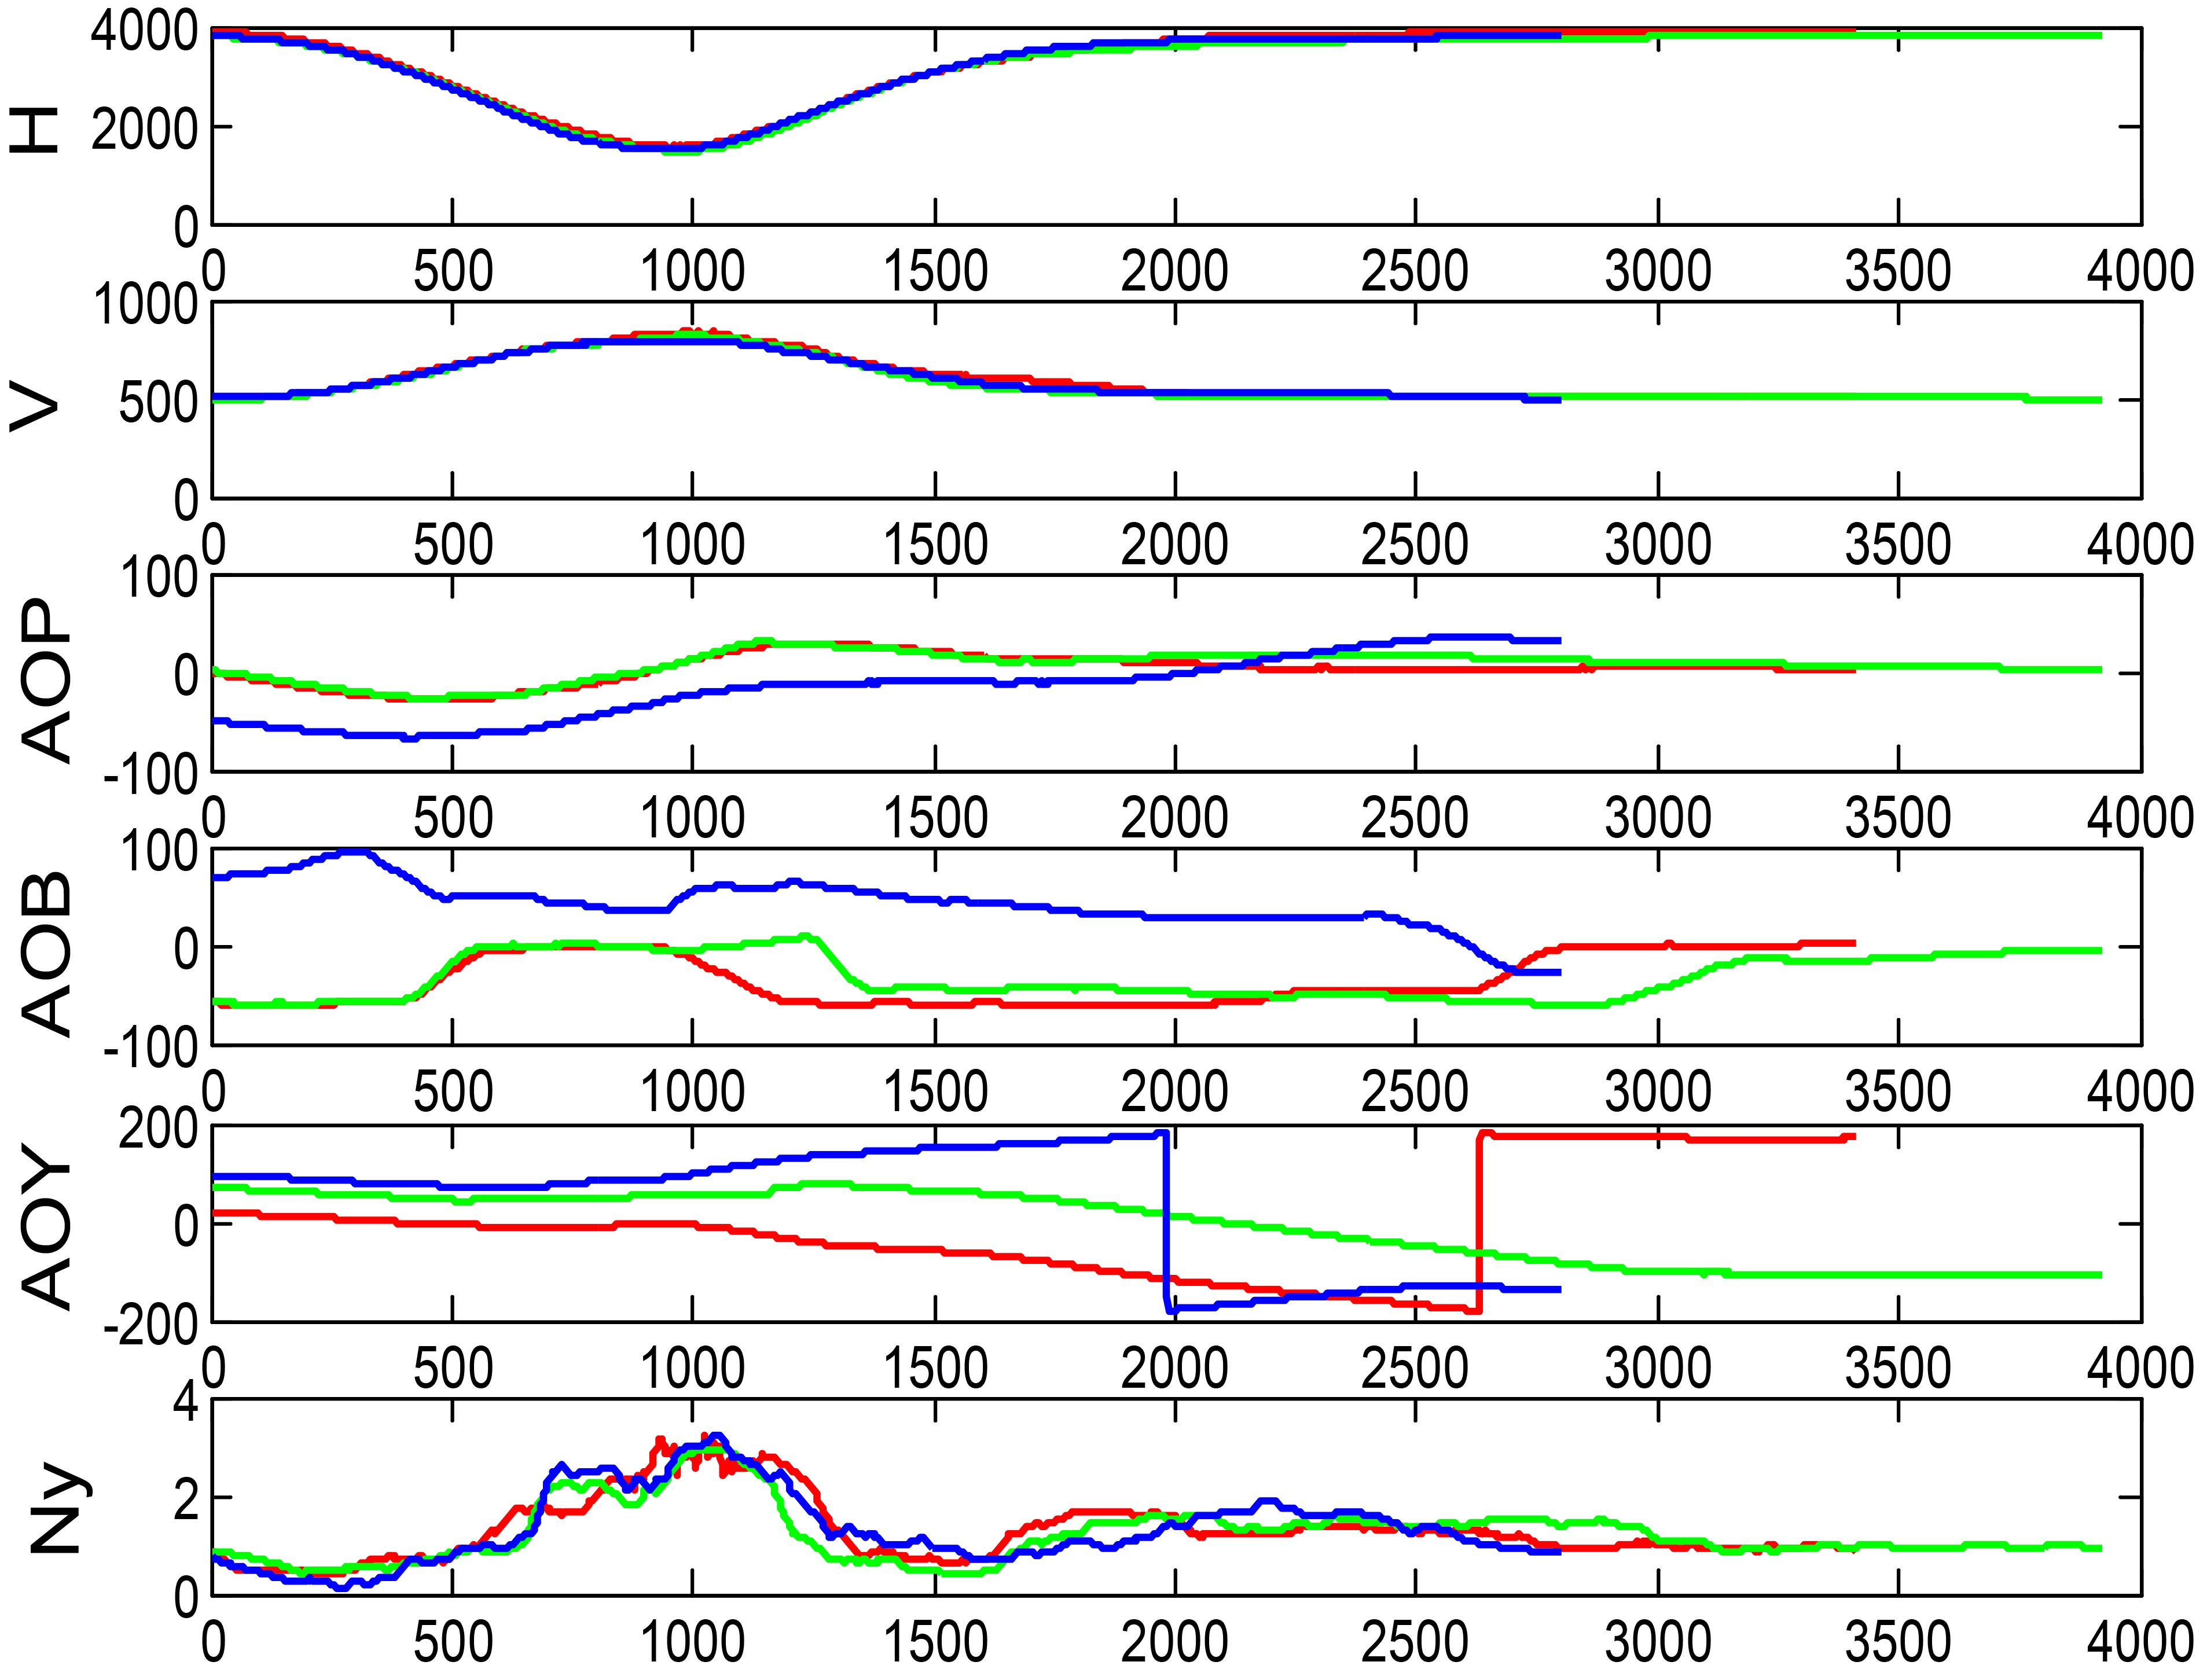
Flight parameter curves of action parts in class 6.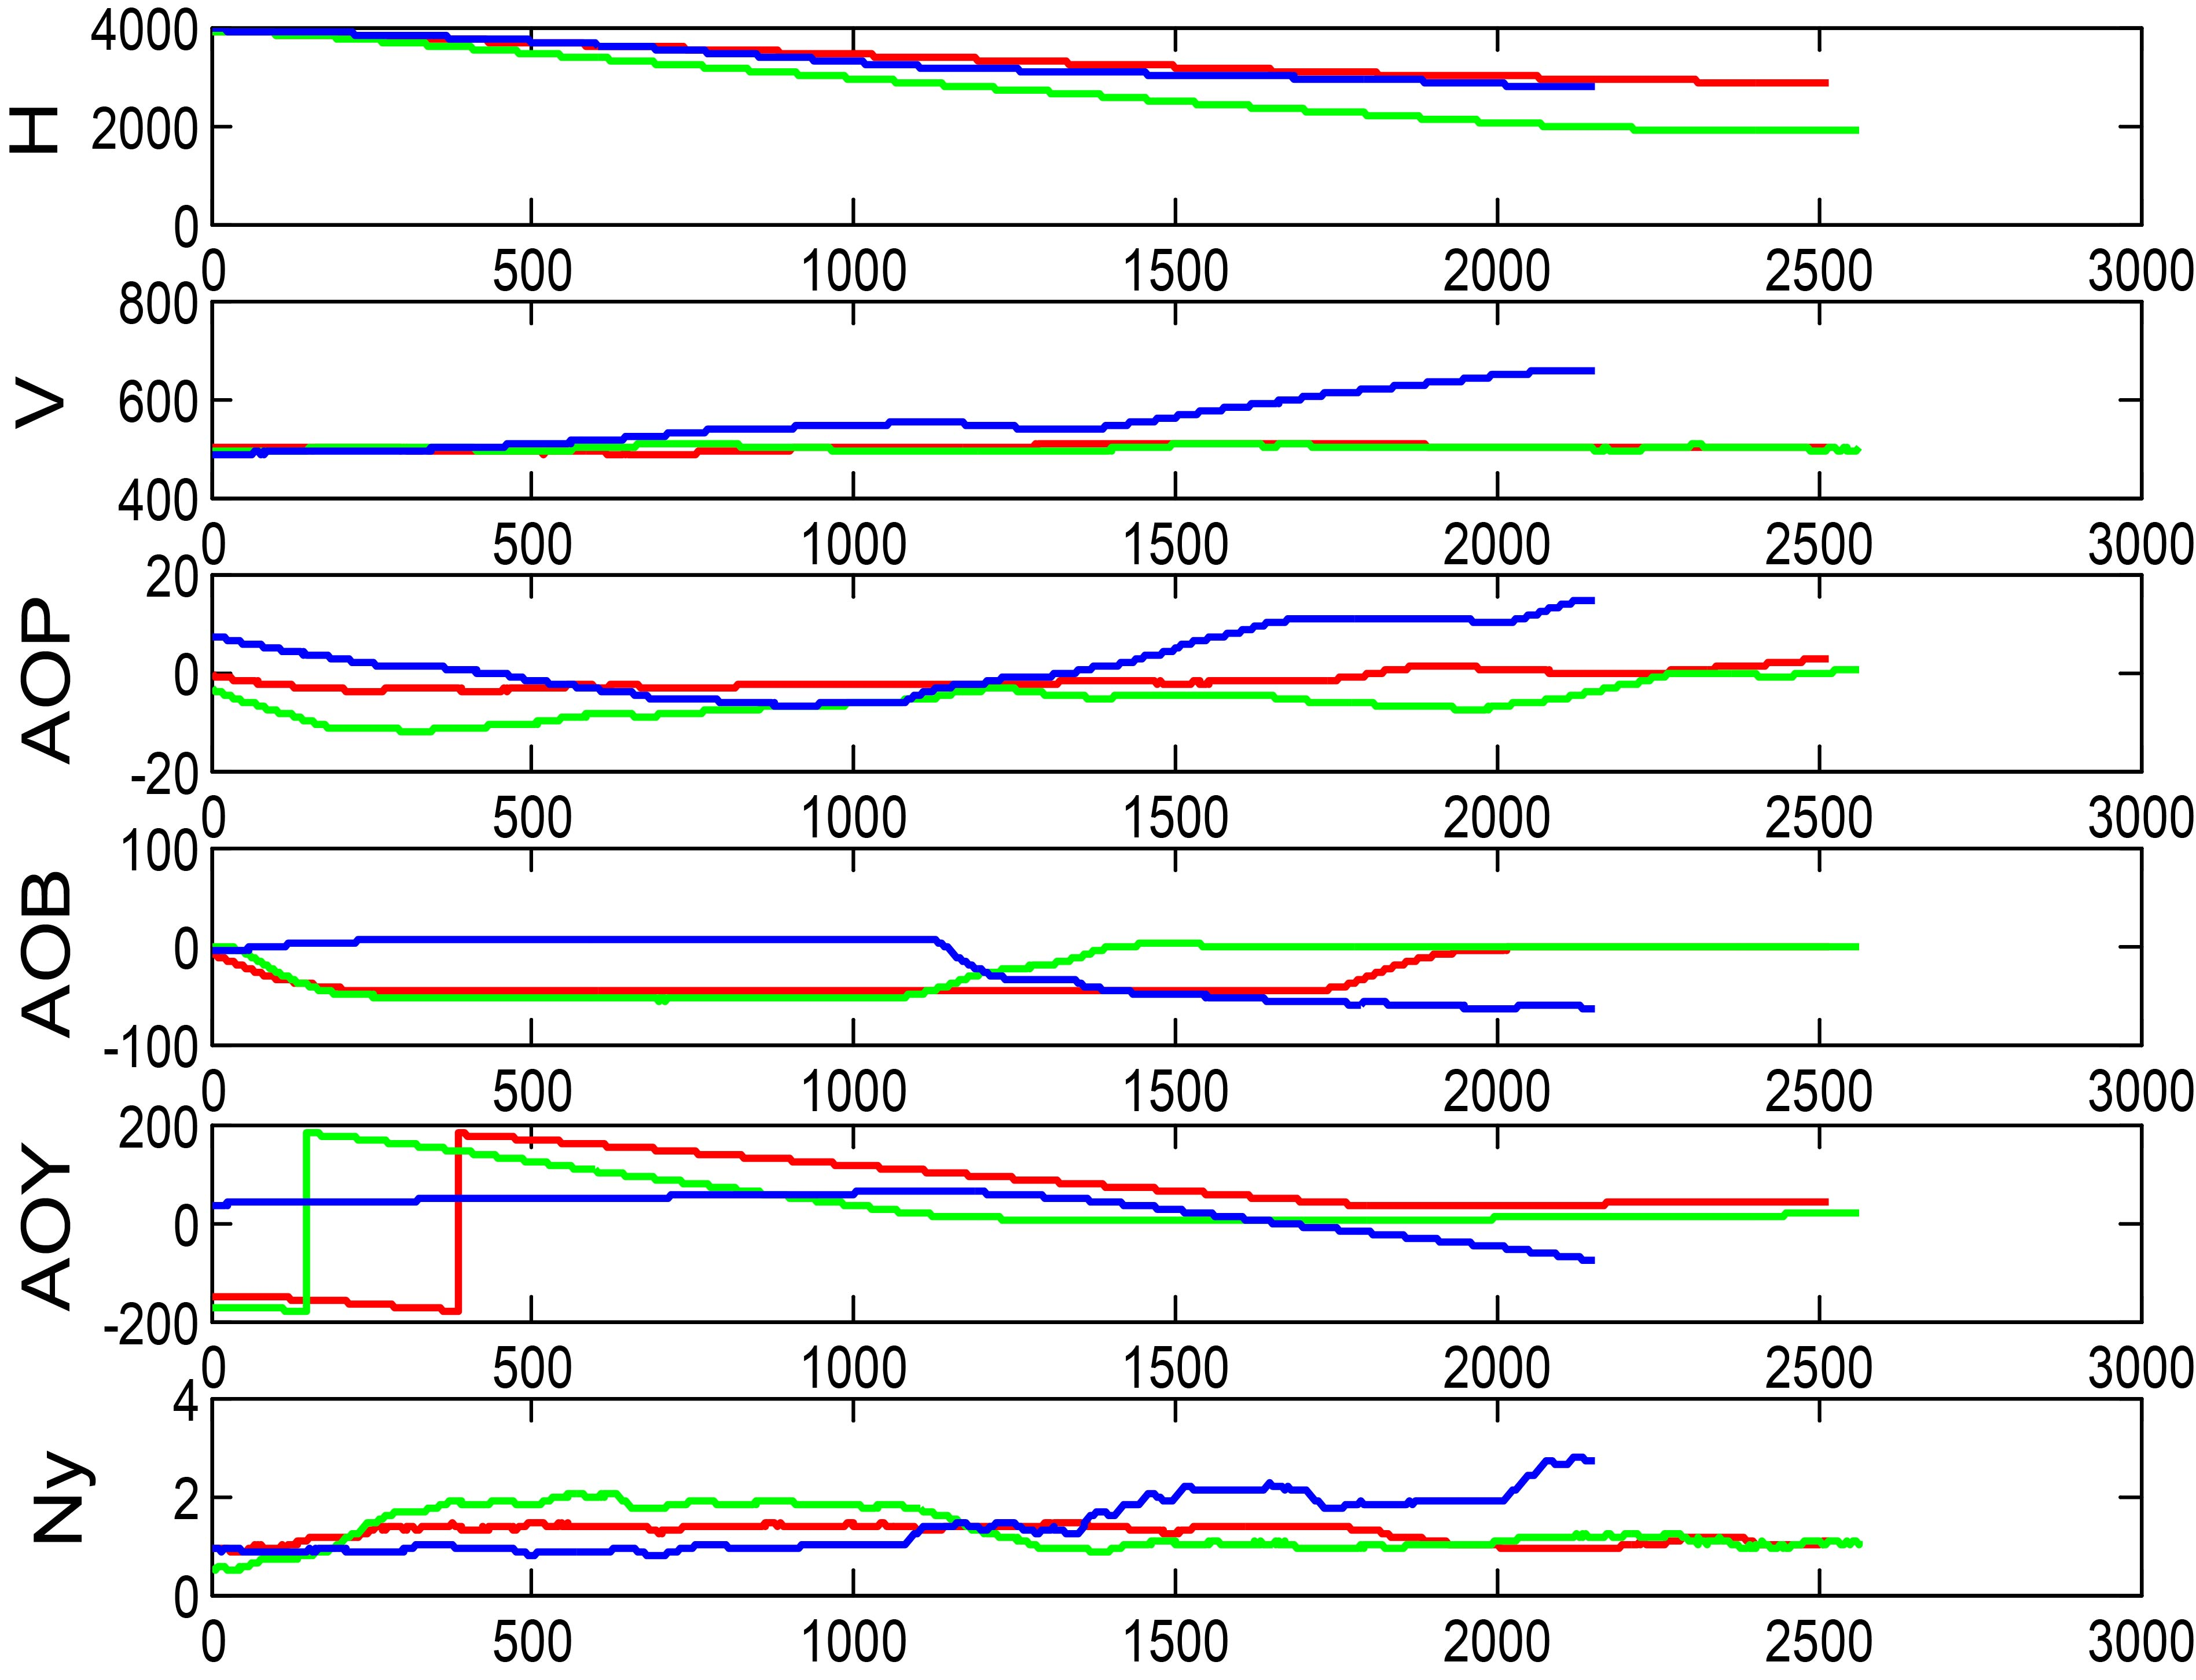
It can be seen that the trends of flight parameter curves in each class are similar, and the clustering result is clear. In Fig. 7, the three curves have the same trend and similar shape. In particular, it catches the feature that the AOB goes down first and then goes up. It can be roughly concluded that class 1 is a tilt hovering action. In Fig. 8, the H curve and the V curve almost coincide, and the variation trends of other flight parameter curves are roughly similar. It can be judged that class 3 is an action with pulling up again from a tilt hovering dive. In Fig. 9, the trends of all curves are basically same and relatively flat, which can be preliminarily identified as smooth turning.
For the results, there are some things that need to explain. (i) The range of the AOY is (
The non-supervised automatic method of aircraft maneuver partition (NSAM) proposed in this paper implements partitioning automatically of the flight data without priori knowledge. The NSAM is applied to the flight data of three take-off and landing, and 13 types of maneuverings are obtained. By observing the data curves, the maneuverings with obvious physical meaning can be divided, which indicates that the NSAM proposed in this paper is effective.
The NSAM is significant in two ways:
It provides basis and data support for the establishment of the new aircraft maneuvering library. The establishment of the new aircraft maneuvering library requires manual interpretation of a large number of flight data, and the NSAM can automatically divide and classify the flight parameters. Classifying the massive data into more than ten types with certain significance will greatly reduce labor consumption and improve work efficiency. It provides an effective classification principle for structural health monitoring and load identification. In Figs 7–9, the normal overload curve trend of each type of flight parameters can be well matched, indicating that the overload features of each class are basically the same. Therefore, this classification principle has a good engineering application value in load identification and monitoring.
The NSAM also has some problems, such as, the trend turning in trend identification is not clear, the single main parameter has limitations in dividing action parts, the algorithm parameters are difficult to adjust, etc. At present, some new methods are being studied, such as using wavelet threshold algorithm to reduce noise [20], and using local support vector regression to separate data [21]. These will be the focus of future research.