
Abstract
The prediction and recommendation of financial stocks are of great values. This study mainly analyzed the application of K-means clustering algorithm in stock forecasting and recommendation. Firstly, it introduced the k-means algorithm briefly and analyzed its advantages and disadvantages. Then, the k-means algorithm was optimized by introducing artificial fish swarm algorithm (AFSA) to obtain KAFSA. Then 100 stocks of listed companies were taken as the research subject and predicted by KAFSA designed in this study. The prediction results were verified through closing price, price earning ratio, earnings per share and return on net assets. The results showed that there were obvious differences between A and B stocks divided by KAFSA, and the differences of B stocks were significantly larger than those of A stocks. It shows that 100 stocks are well divided into high performance stocks and poor performance stocks through clustering, which provides a good reference for investors to invest in stocks and is worth of further application.
Introduction
Stock forecasting is an important part of the financial stock market [15], which is a very challenging task [14]. Financial stock prediction refers to the prediction of the future trend of stocks through the analysis of historical stock data [5]. Successful prediction can help investors make considerable profits [9]. With the development of the stock market, stock forecasting becomes increasingly complex [17]. The stock information accumulated brings great difficulty to data processing and analysis. The emergence of data mining technology effectively solves the problem [19]. Data mining technology can observe, process and analyze a large amount of complex financial data. Stock forecasting by data mining technology has been widely studied. Sadaei and Enayatifar [10] fuzzified historical data into difference fuzzy set using the method of fuzzy time series, established difference fuzzy logic groups, made stock prediction in defuzzification, and improved the accuracy of the algorithm by imperialist competition algorithm, and verified through the experiment that the method had better performance in stock prediction. Wang et al. [13] combined support vector regression (SVR), principal component analysis (PCA) and brainstorm optimization (BSO) for stock forecasting, took Shanghai-Shenzhen stock exchange and Shenzhen stock exchange as examples, and found that the designed forecasting model was an effective tool with simple calculation and high accuracy for stock forecasting. Das et al. [6] clustered the data of well-known stock markets using K-means clustering algorithm, then determined the classification rate by grey wolf optimizer, predicted the stock market by the nonlinear autoregressive exogenous neural network algorithm, and verified its prediction performance through experiment. Berradi and Lazaar [18] combined Principal Component Analysis (PCA) with recurrent neural network (RNN) to predict 29 days of data of Casablanca stock exchange. They found that the error of the method in stock prediction was only 0.00596, which showed a good performance. Chou and Nguyen [12] predicted the stock price of Taiwan construction companies using sliding window meta heuristic optimization, which makes some contributions to the guidance for the decision-making and trading of investors. Chen et al. [11] analyzed the application of nonlinear support vector regression (SVR) method in stock forecasting and optimized it by grid search (GRID), particle swarm optimization (PSO) and genetic algorithm (GA). They found that the minimum root mean square error (RMSE) of the GA-SVR model was 15.630, which showed that the model could provide investors with good technical reference. Kaur et al. [8] predicted the stock market of Bombay Stock Exchange using the adaptive network fuzzy inference system (ANFIS), combined with the least square method with back propagation gradient method to train the system, and verified the effectiveness of the method in stock market prediction. K-means algorithm has an excellent performance in data classification. To realize an accurate prediction and recommendation of stocks and improve the benefit of investors, this study selected the K-means algorithm, realized the prediction through stock clustering, and optimized the K-means algorithm by artificial fish swarm algorithm (AFSA) against the shortcomings of the algorithm. Taking 100 stocks as an example, the prediction performance of the optimized clustering algorithm was verified to understand the feasibility of the algorithm in stock prediction. This study found that the proposed method could make an accurate classification on stocks, which can provide a reference for investors and help them to make correct investment choice and gain good benefits. It was found from the experimental results that the optimization on the clustering algorithm was effective, and it significantly improved the performance of the algorithm; moreover, the clustering algorithm had an excellent performance in stock prediction and could be promoted and applied in practice. On the one hand, the clustering algorithm can help investors obtain better benefits; on the other hand, it is beneficial to master changes of the stock market and make timely responses.
Financial stock forecast
Financial stocks have existed for more than 200 years. The increasingly prosperous financial stock market is an important driving force for economic development and an important component of the market economy. It has become the focus of attention of more and more investors. However, the stock market fluctuates greatly, and a little careless will cause huge losses. Stock prediction is very important for investors. It can help investors master the information of stock changes, effectively avoid risks, and obtain greater benefits. With the growth of the stock market, the difficulty of forecasting financial stocks has increased. The emergence of data mining technology provides a new idea for stock forecasting. Methods sch as neural network [1], clustering algorithm [4], multiple regression [2] and emotion analysis [7] have good applications in stock prediction. Some classification algorithms can classify the stocks with high returns, while methods such as sentiment analysis are mostly used for targeted recommendation to users. However, in stock forecasting, the effect of supervised algorithms such as neural network and multiple regression is not as good as that of unsupervised algorithms such as clustering algorithm as the corresponding label of financial system is not known. Obtaining the law of stock changes by analyzing and processing a large amount of historical stock information through data mining technology and investing the best stock has become the choice of many investors.
Optimization of K-means clustering algorithm with artificial fish swarm algorithm
K-means clustering algorithm
Clustering is a method of data classification, i.e., data are divided into several categories according to some feature, so that data in the same category has the maximum similarity and data in different categories has the minimum similarity [16]. K-means clustering algorithm is a very widely used clustering algorithm. Objects participating in the cluster are divided by the setting of the number of clusters. It makes the similarity of objects in the same cluster as high as possible and the similarity of objects between different cluster as low as possible. The algorithm is simple and has high clustering efficiency. It has been extensively applied in fields such as data mining, pattern recognition and image analysis. In the prediction of stock, it can compute in a high speed and obtain accurate clustering results, but it also has problems such as sensitive to initialization and easy to fall into local extremum. The process of the K-means algorithm is shown in Fig. 1.
The flow of K-means clustering algorithm.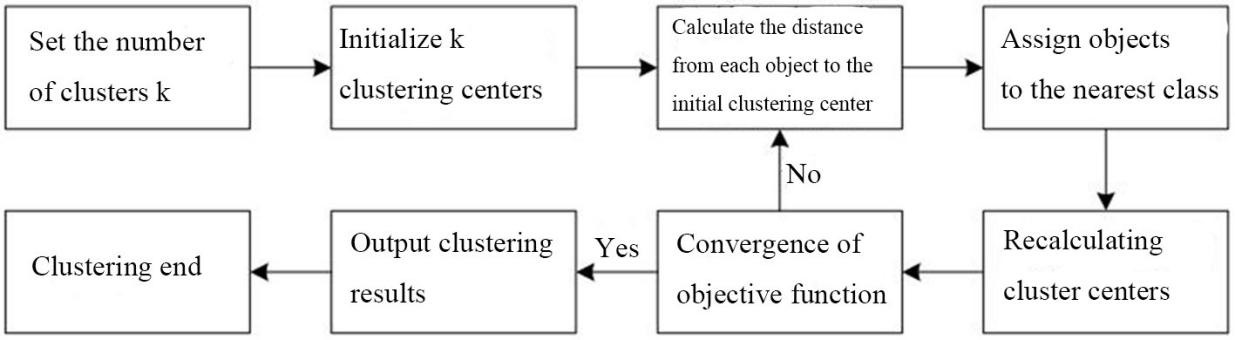
The algorithm steps are as follows.
Data set The distance from the
The minimum distance
The mean of objects in the same class is calculated. Cluster center is updated:
where Steps (2)–(4) are repeated until the function converges.
K-means clustering algorithm generally judges the clustering effect using the error square sum function:
where
However, K-means clustering algorithm also has some shortcomings. Firstly, the number of clusters k is determined by human random, which can only be determined by experience. Different k values may result in different clustering results. Secondly, different distance calculation methods can resulted in different clustering results. Thirdly, the objective function is easy to fall into local extremum.
In order to make up for the shortcomings of K-means clustering algorithm, artificial fish swarm algorithm was introduced for optimization. AFSA is a bionic algorithm which is not sensitive to initialization and can overcome local extremum to obtain the global optimal solution, i.e., it can effectively make up the shortcomings of K-means clustering algorithm. It has strong robustness and high convergence speed and flexibility. The algorithm steps were as follows.
(1) Initialization of parameters
Parameters such as the total number
(2) Updating of the artificial fish state (
The first one was foraging behavior, i.e., the behavior of fish towards food.
Next was cluster behavior, i.e., the behavior of artificial fish moving closer to the center of the school.
The third one was rear – end behavior, i.e., the behavior of nearby fish swimming towards less crowded and more food. The biggest fish acceptable in the field was
The last one was random behavior, i.e., the artificial fish moved freely to forage or search for partners to ensure optimal efficiency,
(3) Evaluation behavior: the fitness function (food concentration)
The clustering center in the K-means algorithm was represented by the fitness function of the artificial fish swarm algorithm:
where
The specific flow of KAFSA combined with artificial fish swarm algorithm is shown in Fig. 2.
Flow chart of KAFSA.
One hundred A-share listed financial companies were selected randomly. Six data, including closing price, price earning ratio, earnings per share, return on net assets, provident fund per share and net assets per share, were obtained from the comprehensive data of stock in 2017 in RESSET database. The six data could reflect the abilities of the company, such as profitability, debt paying ability, and growth ability, and embody the financial condition of the company. The KAFSA algorithm was used for classification. The data obtained is shown in Table 1.
Data of the 100 listed companies
Data of the 100 listed companies
In the preprocessing, the duplicate data were deleted, and the missing data were filled up by the mean value. Data were standardized using maximum-minimum normalization,
Cluster analysis was carried out in MATLAB. The clustering performance of the traditional K-means algorithm and balanced iterative reducing and clustering using hierarchies (BIRCH) algorithm was compared with that of the KAFSA proposed in this study. Parameters were set as follows:
Comparison of the clustering performance
It was seen from Table 2 that the standard deviation and silhouette coefficient of the traditional K-means algorithm and BIRCH algorithm were not as good as the KAFSA though it converged fast; the standard deviation and silhouette coefficient of the clustering result obtained by the KAFSA was 0 and 0.99 respectively, indicating that the algorithm had good clustering effect.
The 100 listed companies were divided into two categories according to the KAFSA, and details are shown in Table 3.
Stock clustering results
In order to verify whether the algorithm was effective for stock prediction, two types of stocks were compared in aspects of closing price, price earning ratio, earnings per share and return on net assets. The results is shown in Figs 3 and 4.
The comparison of closing price and price earning ratio between A and B stocks.
Comparison of earnings per share and return on net assets between A and B stocks.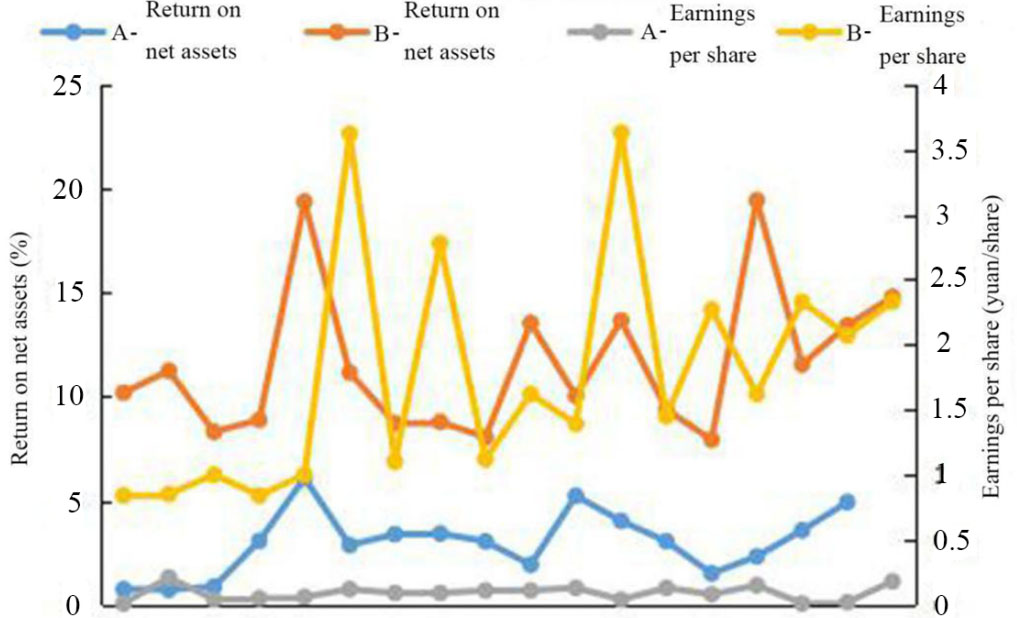
Figure 3 showed the comparison of closing price and price earning ratio between the two types of stocks. Figure 4 shows the comparison of earnings per share and return on net assets between the two types of stocks. It could be found that there were obvious differences between the two types of stocks. Stock indicators were the main reference for investors when investing. It could be found from the comparison chart that A stocks generally performed poorly in the four indicators; the closing price and price earning ratio of A stocks were low, earnings per share of A stocks was between 0 yuan/share and 0.5 yuan/share, and the return on net assets was basically lower than 5%, which could be classified as poor-performance stocks; B stocks had significantly higher closing price and price earning ratio than A stocks and high earnings per share and return on net assets, which was classified as high-performance stocks. The above results showed that the algorithm proposed in this study was correct in stock prediction and could accurately recommend high-performance stocks to investors.
The importance of financial stocks has been demonstrated over time. More and more people are joining the stock market and choosing stocks for investment. With the development of the financial industry, there are more and more financial data. In order to process and analyze these data effectively, data mining technology is introduced and applied well. Through data mining technology, financial stocks can be analyzed and predicted based on the analysis of historical data to dig out the changing rules and trends of the stock market, so as to make the scientific and reasonable investment and obtain greater benefits [3].
In the study, K-means clustering algorithm was selected to realize stock prediction. In order to improve the sensitivity of the clustering algorithm to the initial K value and solve the problem of easy to fall into local optimization, the artificial fish swarm algorithm was introduced to optimize the algorithm. KAFSA was obtained and applied to the prediction and recommendation of financial stocks. The 100 stocks were divided into A and B categories, and it could be found from the comparison of closing price, price earning ratio, earnings per share and return on net assets that the clustering results obtained were accurate. The closing price, earnings per share and return on net assets could well reflect the operating conditions of listed companies. It was observed from the comparison chart that the closing price, price earning ratio, earnings per share and return on net assets of A stocks were lower than those of B stocks. It indicated that the listed companies which were classified as A had general operating conditions and poor profitability, which were not recommended to investors for investment. The listed companies which were classified into category B had good profitability and development prospects, which were worth recommending to investors for long-term investment and could bring better returns to investors.
In summary, the optimized K-means clustering algorithm has a good performance in financial stock prediction and recommendation. It can accurately classify stocks through historical data analysis, predict high-performing stocks and low-performing stocks, and make scientific recommendations to investors, which is worth a widespread application. In the future study, experiments will be carried out on data samples with a larger scale, and the K-means algorithm will be further optimized to improve the stock prediction ability better.