



Abstract
Dyslexia is a disability in language and phonetics, with difficulties in learning and reasoning, affecting around 20% of the worldwide population. Detecting dyslexia at an early stage is vital to provide appropriate remedial teaching aid to improve the learning skills of the affected. The key objective of this study is to identify dyslexia based on Anatomical and Functional MRI data. Convolutional Neural Networks and Time Distributed Convolutional Long-Short Term Memory Neural networks are proposed for screening the neuroimaging data. A multimodal fusion technique is proposed to provide a final combined classification based on the anatomical and functional data. Experimental results demonstrate the performance of the multimodal approach over individual modes of MRI data. The result analysis shows that image segmentation has a significant contribution towards improving classifier performance.
Keywords
Introduction
Dyslexia has been a research area worldwide and different techniques have been proposed by researchers to detect developmental dyslexia at an early stage. Conventional methods examined dyslexia using physical assessment of the children and analyzing their behavioral aspects over a long period. But it was often time-consuming and has implications such as failing to detect potential cases of dyslexia. Identification of dyslexia particularly in young children is challenging for both parents and teachers because of the signs and symptoms being non-obvious. This results in delayed diagnosis which leads to the detriment of the student, causing them to lose critical years of learning. An accurate detection at an early stage and with proper educational intervention, the long-term effects of dyslexia can be suppressed and the children can read and write normally in the future.
The different modes of data based on which dyslexia can be screened include test analysis data based on reading and writing, dynamics of handwriting, gaming data, eye movement data, neuroimaging (MRI), and Electroencephalography (EEG) data. An auditory processing method that involves reading and writing tests detects early dyslexia symptoms such as problems with writing and pronunciation. Another test based on eye movement monitoring while reading tasks is conducted to check for rapid saccades or fixations that pertain to dyslexia. Handwriting data has been the widely used mode to identify dyslexic subjects which involves analyzing the dynamics of the handwriting of the affected dyslexics. Various studies related to the brain activity of dyslexic individuals based on EEG and MRI data have also vastly contributed to detecting the severity of developmental dyslexia. A multimodal screening tool for handwriting and eye-tracking has been developed previously to analyze and detect the symptoms of dyslexia by the authors of this paper [2].
Recent brain imaging studies of dyslexia based on Magnetic Resonance Imaging have shown a significant difference between dyslexic and normal subjects in structural and functional aspects. Dyslexic subjects show reduced activation in the left posterior area of the brain and less grey matter in the left temporal area of the brain when compared to normal readers. The abnormalities in different brain volumetric structures of dyslexics can be identified from static anatomical MRIs. They show the reduced grey and white matter concentration, increase in the volume of the corpus callosum, and abnormal asymmetry in the cerebellum shape. The Functional MRIs easily show the abnormality in the activation patterns across the right brain hemispheres of dyslexics.
MRI data has been selected as one of the modes for analysis because it detects potential neurobiological abnormalities in the brain activity of dyslexic subjects which cannot be detected through other basic screening techniques. The MRI screening not only screens dyslexics but also identifies the severity of dyslexia in the affected individual. This helps in assessing the proper level of remedial training and medical aid required to improve the condition of that candidate.
The objective of this proposed research work is to identify dyslexia in individuals based on anatomical and functional Magnetic Resonance Images (fMRI). The proposed work classifies the subjects as dyslexic and non-dyslexics, based on deep learning approaches like Convolutional Neural Networks and Long-Short Term Memory Neural Networks. A 2D Convolutional Neural Networks model with image segmentation for the anatomical MRI data and Time Distributed 2D Convolutional Neural Networks-Long Short Term Memory model with image segmentation for the functional MRI data is proposed. The proposed approaches were implemented and the results were analyzed. Further, a Multimodal Fusion approach is proposed to concatenate the Anatomical and Functional MRI models to provide an improved screening experience than the existing approaches. The obtained results were analyzed based on classification performance and are summarized for future enhancements.
The remainder of this paper is ordered as various sections. The Section 2 of this paper describes the prevailing works of the researchers in the diagnosis of dyslexia. The Proposed work is covered in Section 3. Section 4 describes the implementation of the prediction models proposed for the identification of dyslexia. Section 5 presents the performance metrics suitable for evaluating the model and the results obtained from implementation. A comparative analysis of the performance of various models is given in this section, while Section 6 provides concluding remarks and future enhancements.
Literature survey
Dyslexia is a kind of learning disability that has gained awareness and various approaches have been used to detect and diagnose these disabilities. Various Deep neural networks with time-related prediction have been used in several domains including traffic flow prediction in VANETs [29] and in predicting travel demands [30].
Booth and Burman [1] in 2001 found that people with dyslexia have less grey and white matter in their left parietal temporal area of the brain than normal individuals. Having less grey matter leads to problems in processing sound and less concentration of white matter could lessen the ability to communicate the neural information across the neurons. Other structural differences include abnormalities in the symmetry of the brain hemispheres. Most right-handed normal people have their left hemispheres larger than the same area on the right whereas right-handed dyslexic people have their right hemispheres larger than the same area on the left due to increased activations in those areas. Thus Dyslexia risk is evident in brain scans and to capture the abnormalities, Structural or Anatomical MRI and Functional MRI are being used.
Tomaz et al. [3] presented a study on identifying the Brain voxels responsible for Dyslexia using fMRI and visualization techniques. The fMRI data for the study was collected from 32 children including 16 dyslexics and 16 typical readers during reading tests. The paper proposes CNN and data augmentation techniques for the classification task. The study evaluated the efficiency of both 2D and 3D CNNs. The CNN models were implemented in two approaches: Genetic Programming and Le-Net. GP 2D CNN model was able to obtain an accuracy of 95%. The learned gradients from the GP-CNN model are further visually examined using the Grad-CAM method. From the examination, it was identified that the left occipital lobe highly mapped to the dyslexic subjects and the anterior cingulate cortex corresponded to the normal subjects during classification. The study highlights the significance of network visualization methods in neural network architectures for visualizing the learned features.
Usman et al. [4] developed a screening tool for dyslexia detection biomarkers from neuroimaging data. The whole-brain scans of 19 dyslexics and 26 controls were acquired using the 3T Siemens MRI scanner. The study proposed a cascaded deep CNN for classification and the highest performance accuracy of 85% before encoding and 73.2% after encoding was obtained on the encrypted data. The findings in this study are the difference between dyslexic and normal individuals found in the gray and white matter of the brain.
Zahia et al. [5] proposed a research work on detecting dyslexia using 3D CNN based on fMRI data. The study involved pre-processing steps to retrieve the activation areas in brain regions during reading tasks. The dataset comprising of 165 three-dimensional scans containing brain stimulation were subjected to 3D CNNs for detecting the patterns. The model was able to obtain an accuracy of 73% in the classification of dyslexia.
David Moreau et al. [6] performed a field study on Volumetric and surface characteristics of gray matter in adult dyslexia and dyscalculia using MRI brain scan data. Forty-eight were selected for the present study based on the resources available. The data was collected from 48 subjects including 12 dyslexics, 12 dyscalculics, 12 comorbid, and 12 controls during reading and spelling tests. SPM12 Computational anatomy Toolbox was used for pre-processing and analysis of the acquired MRI data. This study examines the relationships between differences in volumetric and surface characteristics of grey matter, using voxel-based and surface-based morphometry using frequentist factorial ANOVA.
Prabha et al. [7] proposed a study on dyslexia screening using SVM based on fMRI data. The grey matter, white matter and cortical thickness features were extracted from the brain scan images and were given as input to the SVM. The SVM linear model is built in Apache SPARK using the standard library to fund the huge volume of data. The prediction accuracy of 92% is achieved from the model proposed.
Tamboer et al. [8] presented a study on dyslexia classification based on structural neuroimaging scans. The study found that the brain areas indicating the left occipital fusiform gyrus, the right occipital fusiform gyrus and the left inferior parietal lobule were contributing more towards the classification. An SVM machine learning classifier was implemented for the classification of dyslexic individuals from non-dyslexic and classification performance of 80% was obtained based on the differences in grey matter.
The above approaches used various machine learning and deep learning approaches for the classification of dyslexia based on MRI data. Based on the literature survey, the existing approaches operated only on a single mode of MRI data at a time. The screening efficiency can be improved in the existing approaches by combining multiple modes at a time and adding preprocessing and image segmentation on the data to extract better learnable features. The objective of the paper is to use a multimodal fusion approach combining both modalities of data such as anatomical and functional MRI data for Dyslexia while achieving a high performance accuracy, processing speed and robust screening.
Proposed method
The proposed method for screening dyslexia implements Convolutional Neural Networks (2DCNN) with image segmentation for classifying the Anatomical MRI data and a Time distributed hybrid Convolutional Neural Network-Long short Term Memory Neural network model with image segmentation for Functional MRI data. Further a combined multimodal fusion approach concatenates the proposed anatomical and functional MRI models thus providing a single-window screening for dyslexia. Figure 1 shows the workflow for the classification of dyslexic and normal subjects using anatomical and functional MRI data.
Workflow for screening of dyslexia based on Anatomical and functional MRI using multimodal fusion.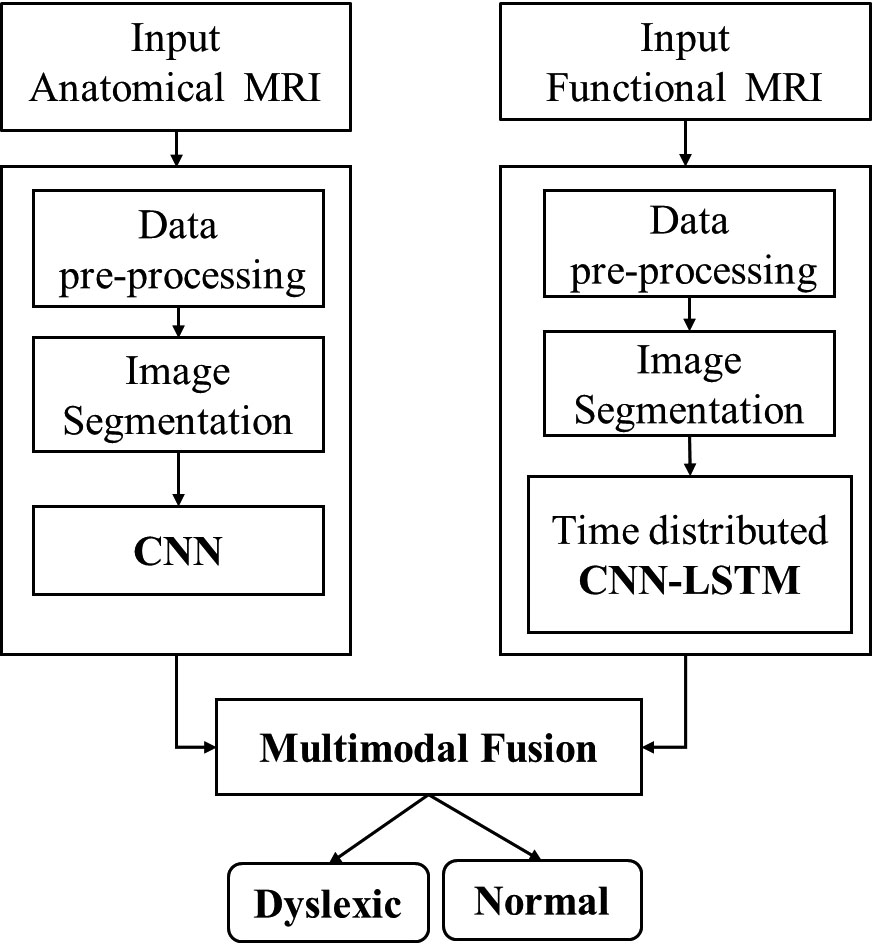
Image segmentation plays a vital part in medical image analysis as it highlights the contours and masses of various regions in the brain and their activation areas while performing tasks. Various image segmentation algorithms such as U-Nets, FCN, U-Net
Convolutional neural networks
Convolutional Neural Network is a Deep Learning framework used for classifying and detection tasks extensively in images. Convolutional Neural Networks are fully connected feed forward networks that reduces the features while preserving the quality of image data. Hence it is best suited for images. Each input image in CNN is passed over a sequence of convolution and pooling layers paired together. The final activation function in the fully connected layer can be sigmoid in the case of binary classification or softmax in the case of multi-label classification. Each Convolution layer takes the filter size, padding and the choice of activation function as inputs while the pooling layer takes the stride length as input. The final activation function maps the classification into the target classes.
Time distributed CNN-LSTM
The Hybrid time distributed model combining CNN and LSTM explores the spatial and temporal features of the data. CNN exacts the spatial characteristics from the input and LSTM neural network is capable of extracting the beneficial temporal dependencies from the time distributed data input. The Time Distributed layer applies similar processing on a sequence of inputs. It can operate on different kinds of input such as images and time-series data. The input Time Distributed layer takes the number of the images input in one sequence as one extra dimension. The Time Distributed layer applies the same convolution for each input data, ordered in time one after the other. Hence it is best suited for time-sequenced input data. They are specially designed to detect changes from frame to frame rather than static object detection. The Time Distributed layer shares the same weights that are defined. The Time distributed Flatten layer is added before the LSTM layer that shapes the features into a 1-D vector. The LSTM takes the 1D vector as input and provides the learned pattern. The dense layer interprets the pattern in each time step and provides the output classification.
Multimodal fusion
Multimodal fusion is the notion of incorporating information from multiple modalities to predict an outcome through classification or regression. It is one of the most explored topics of deep learning. Multimodal fusion provides access to multiple modalities that observe the same phenomenon. This results in more robust predictions and allows to capture the complementary missing information from the other modality. Multimodal fusion works by taking multiple independent modalities of data as input and making predictions by combining the features resulting from the different modes of data. A Fully Connected Neural Network (FCN) is applied in the concatenation layer, combining the features from the multiple models and providing a single output classification based on the concatenated features. It provides comparatively more effective screening results than the individual standalone screening models.
Implementation
The proposed system implements 2D CNN with SDAE for image segmentation on the 3D volumetric Anatomical MRI input. The 4D BOLD functional MRI is subjected to classification using Time distributed hybrid CNN-LSTM model. The impact of data augmentation and image segmentation is analyzed. Further a combined multimodal fusion approach is applied to concatenate the features extracted from both the anatomical and functional MRI models to provide a single target prediction as dyslexic or Normal.
Dataset description
The MRI-Lab Graz dataset is an open access neuroimaging dataset from the open neuro medical repository. The open neuro MRI-Lab Graz dataset was collected by Banfi et al. [27]. The Dyslexia fMRI dataset contains T1-weighted Functional Magnetic Resonance Brain scans of both dyslexic and Normal subjects. The participants were selected based on initial symptoms of reading difficulties and those who underwent preliminary dyslexia tests such as handwriting tests and eye movement tracking. The dataset consists of two types of scans: Anatomical (structural) and Functional BOLD brain scans of dyslexic and typical readers. The 3D volumetric anatomical brain scans are collected during the rest phase and 4D functional brain scans are collected during reading tasks. One anatomical static scan and three runs of Functional BOLD scans are collected from each subject. The Brain scan data is provided in NifTi (Neuroimaging Informatics Technology Initiative) format (*.nii). The dataset comprises data from 43 subjects among which 21 subjects are Dyslexic. The summary of the dataset is described in Table 1.
Summary of dyslexia fmri dataset
Summary of dyslexia fmri dataset
The anatomical MRI scans were presented as 3D volumetric data and the functional MRI were presented as 4D volumetric data. Each 3D volumetric scan is a collection of 2D slices of size (176x224) combined into a single scan. Each 4D volumetric scan is a sequence of 120 3D volumes of brain data collected in constant intervals. Each 3D volume of size (64, 64, 34), represents the area of activation at that instance. The collection of all the 3D scans as a whole represents the trajectory of the activation in the brain areas during the reading tasks that the individuals are subjected to. The 4D functional MRI data of a dyslexic subject was sliced into a sequence of 3D volumes as a part of data preprocessing. The input data is processed in .nii format as such to prevent any form of loss in the input data. The MRI data is then rescaled between 0 and 1 for better feature extraction.
Platforms, softwares and packages used for analysis and deployment
Mango software was used to view and analyze the volumetric 3D and 4D volumetric images. The classifier models were deployed in Google colaboratory environment with the default 12GB RAM provision.
The library packages such as Pandas, Keras, Tensorflow, os, cv2, Matplotlib, Skimage, Nilearn and Nibabel were used for the implementation of the system. Nilearn package provides Statistics for Neuroimaging in Python. Nilearn allows multipurpose and useful analyzes of brain areas. It provides statistical and machine-learning tools, with instructive documentation and leverages the scikit-learn Python toolbox. NiBabel is the successor of PyNIfTI. The various image format classes give full or selective access to header (Meta) information and access to the image data is made available via NumPy arrays. Scikit-image is a collection of algorithms for image processing and computer vision. It provides utilities for data augmentation such as positional and color augmentation on images.
Data augmentation
In order to leverage the performance of the classification models, data augmentation is applied to the original data. The original 43 brain scans are augmented such that 500 augmented images are generated for dyslexic and Normal scans respectively. Augmentation techniques such as anticlockwise rotation, clockwise rotation and vertical flip are selected to be performed on the data. Horizontal flipping and scaling techniques were eliminated since it causes ambiguity in understanding and extracting correct features from the brain scans. The resulting dataset is expanded to a size of 1042 brain scans including the original dataset by performing the specified augmentation techniques.
Stacked Denoising Auto Encoder (SDAE)
The stacked Denoising Autoencoder is modeled with two stacks of Encoding and decoding functions layered sequentially. The encoder function of SDAE is implemented using 3 conv2D convolutional layers with ReLU activation function and 2 max-pooling layers. The decoder function has 2 convolutional layers and 2 upsampling layers followed by a decoding conv2D layer with a sigmoid activation function.
The pre-processed input brain data is passed to the input layer of the first stack of the Auto Encoder. The encoder function of the first stack is called and it provides the extracted features from the input image. The decoder of the first stack is eliminated and the extracted feature set is directly passed on to the second stack of the Auto Encoder. The second stack takes the encoding and further extracts features from it. The second set of encoding is passed to a decoder that decodes the two-layer stacked encoding. The output of SDAE is reconstructed brain scans of size (176, 224) same as the input. Figure 2 shows the complete network architecture of the SDAE.
Network architecture of Stacked Denoising Auto Encoder.
a) 2D CNN: The result of image segmentation from the Stacked Denoising Auto Encoder is passed as input to the 2D Convolution Neural Network model. It is implemented using Keras and TensorFlow. The network has 2 convolutional layers, 2 max-pooling (MP) layers, 2 fully-connected (FC) layers, and a dropout layer with a dropout rate of 25%. The details of hyperparameters used in the CNN model are given in Table 2.
b) Time distributed CNN-LSTM: The result of image segmentation from the Stacked Denoising Auto Encoder is passed as input to the Time distributed CNN-LSTM. The input convolutional layer and maxpool layers are distributed over time followed by Time distributed flatten layer that converts the extracted features into a 1D vector. The output from the time distributed flatten layer is passed to the LSTM layer of sequence size 120. Since LSTM can deal with time-sequenced input data, it directly takes the flattened features extracted from 120 3D scans which correspond to the data from one individual. The LSTM layer is followed by a fully connected dense layer with 120 neurons and a dropout layer with a dropout rate of 25%. The fully connected layers are modeled to find the predicted activation present in the input frames. The LSTM output should not be a sequence, So the return sequence parameter in the LSTM layer is set to False. Finally, the network is modeled with a fully connected dense layer and sigmoid activation for binary classification. The Summary of the hyperparameters used in this model is given in Table 2.
Multimodal fusion architecture
As shown in Fig. 3. The Model I takes anatomical MRI scan input while Model II takes functional MRI input. The multimodal architecture combines the features extracted from both the input branches and concatenates them to provide a single output classification as dyslexic or normal. A fully connected dense layer with 16 neurons is used to concatenate the features for both the models and is passed on to the final dense layer. The final FC dense layer with one neuron and sigmoid activation function provides the target classification based on the Anatomical and functional MRI inputs.
Hyperparameters used in model I and model II
Hyperparameters used in model I and model II
Network architecture of Multimodal Fusion Neural Network for anatomical and functional MRI data.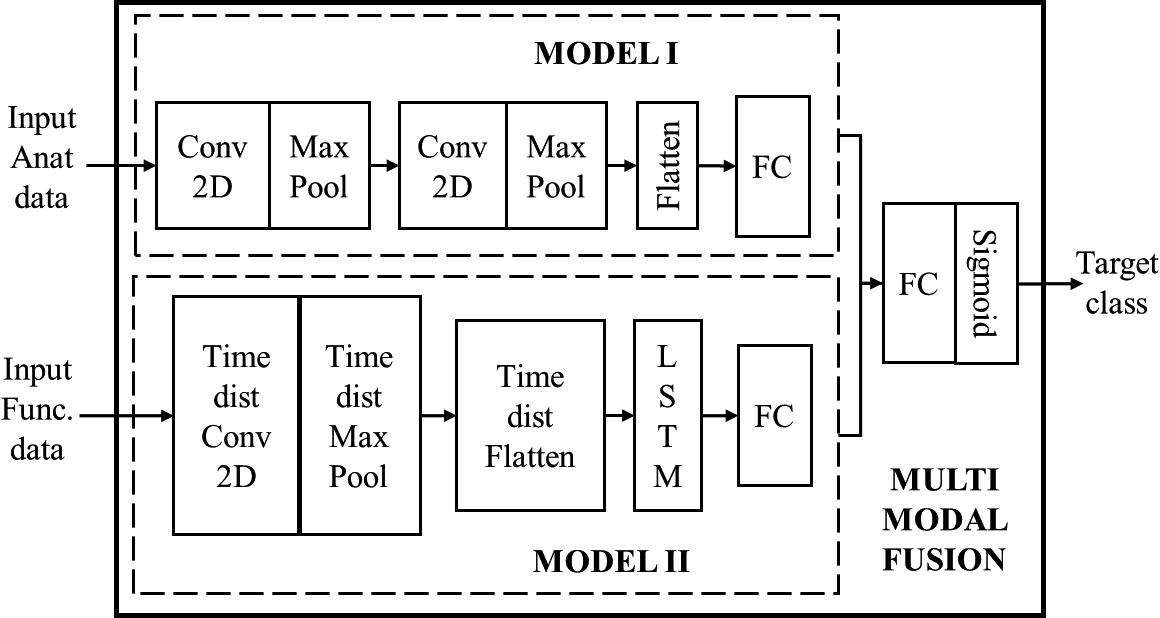
Performance metrics
The performance of the model is evaluated based on accuracy that tests the fraction of subjects who are dyslexic and are rightly classified as dyslexia positive.
Summary analysis of individual modes of data vs Multimodal Fusion Network
Summary analysis of individual modes of data vs Multimodal Fusion Network
Analyzing the impact of image segmentation on the individual models
Model loss for 2DCNN model with image segmentation on the anatomical 3D MRI data.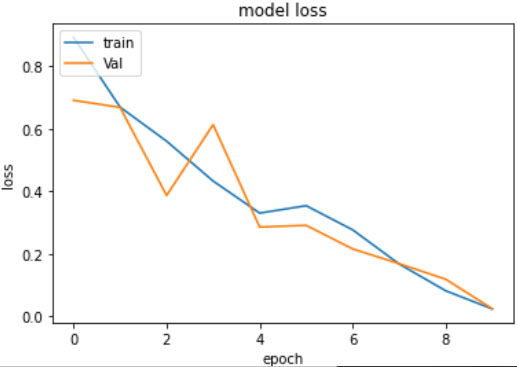
The Multimodal Fusion Neural network model provided a binary output classification as dyslexic or normal on the input images with a training accuracy of 96% and yielded a testing accuracy of 85%. The 2D CNN model for anatomical images provided an accuracy of 81% and the Time Distributed CNN model provided a training accuracy of 95% when individually trained as standalone models. Table 3 summarizes the results obtained from the three models implemented. From the table, it can be inferred that the multimodal fusion model aids in efficient single window prediction of the dyslexic subjects based on both anatomical and functional MRI data. The functional MRI scans are collected in 3D slices distributed over a constant interval of time. Since the functional MRI image records the activations during phonological activity that are time-related, the LSTM model aids in better performance efficiency in Model II.
Table 4 provides insights on the contribution of image segmentation on the classifier models I and II. Image segmentation using Stacked Denoising Auto Encoder aids in extracting the features that correspond to the white matter and grey matter concentration from the brain scans which are crucial for the detection of dyslexia. Thus it is apparent from the table that Image segmentation has significantly improved the classifier accuracy to about 5% in both models. Along with image segmentation, data augmentation has also contributed to a significant level by expanding the dataset size during training thus providing meaningful variations in the input.
Model loss of the time distributed 2DCNN-LSTM model with image segmentation on the functional 4D MRI data.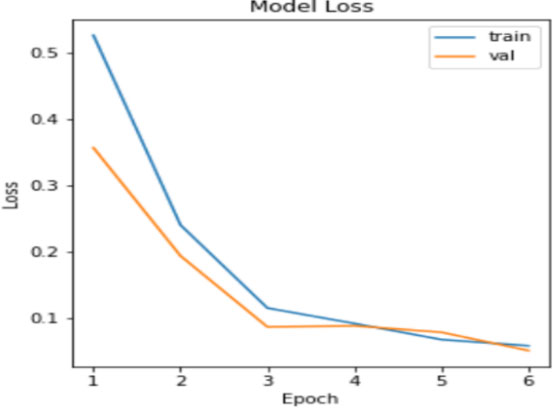
The model loss for the 2D-CNN model with Image Segmentation on the Anatomical 3D MRI data (Model I) and Time Distributed hybrid CNN-LSTM model with Image Segmentation on the Functional 4D MRI data (Model II) are shown in Figs 4 and 5 respectively. The Blue line depicts the trend of model loss during training and the red line represents the loss trend during validation. Results show that an average model loss of 0.1 is incurred for 6 epochs.
The proposed framework for dyslexia screening based on MRI neuroimaging data was implemented using deep learning approaches. A 2DConvolutional Neural Network Model was implemented for Anatomical 3D MRI data and a Time distributed hybrid CNN-LSTM model was implemented for the Functional 4D MRI data. In order to enhance the classification rate, image segmentation using Stacked Denoising Auto Encoder was applied on the brain scan data to segment and extract useful features of the grey and white matter concentration. The impact of image segmentation on the MRI data on both models was also analyzed. The 2DCNN model with image segmentation on the Anatomical MRI data input provided an accuracy of 81% and the Time distributed CNN-LSTM model on the Functional MRI data input obtained an accuracy of 95% during training. A Multimodal Fusion Neural Network was modeled to concatenate the individual classifier models and provided an accuracy of 96% during training and provided a better classification of high risk and low risk dyslexics based on the different MRI data modes.
The hybrid Time distributed CNN-LSTM model proves to be effective in learning the abnormal activation pattern in time-related fMRI brain scans by capturing the spatial and temporal characteristics. LSTM in the hybrid model performs better since the functional MRI data captures patterns during phonological activities that are time distributed. The CNN model was efficient in tracking the volumetric differences in the anatomical MRI scans but suffered model loss, hence hybrid CNN models can be considered for implementing screening on Anatomical MRI data. Further, the proposed Multimodal fusion model provides an efficient combined single window screening for dyslexia.
In the light of the present study, the future enhancements can be to perform voxel-wise analysis for detecting the patterns of activation to enhance the classification rate and the reasoning ability. Future studies may develop an automated screening process combining all the modalities of data such as Handwriting, Eye tracking, fMRI and EEG for Dyslexia while achieving a high processing speed and robustness.