



Abstract
Aiming at the problems of low data conversion efficiency, low accuracy and low data utilization rate after conversion in traditional methods, this paper proposes a vector conversion method for building indoor space data based on attribute classification. Firstly, the transformation process of data vectors is analyzed. Secondly, block matching detection and fusion recognition were carried out on the building interior space images, and fuzzy feature extraction method was used to optimize the collection and feature recognition of the building interior space data. Then, the attribute classification method is used to obtain the condition attribute and decision attribute of the data, and realize the building interior space data mining. Then, the K-means algorithm is used to cluster the indoor spatial data samples, and the wavelet transform method is used to de-noise the noisy data in advance. Finally, the obtained data is processed by vector transformation. The experimental results show that the data conversion efficiency of this method is high, and the data conversion accuracy and data utilization rate have been improved.
Keywords
Introduction
With the continuous development of video image technology, it has been widely used in various fields [1]. Using video image monitoring and feature analysis to analyze the characteristics of the building space and establish the building space information acquisition model can improve the information recognition and dynamic detection ability of the building interior space, and then improve the planning and decoration effect of the building interior space [2]. Therefore, it is of great significance to study the vector transformation method of indoor space data in architectural space design and decoration [3]. The traditional vector transformation method of building interior space data mainly adopts the boundary feature point information fusion method to construct the vector fusion model of building interior space data and realize the transformation of building interior space data [4]. Due to its high computational cost and poor adaptability, it is an urgent problem to study an effective data conversion method [5].
Relevant scholars have done a lot of research on data conversion methods to verify the practicability of data conversion methods. Among them, Liu et al. [6] put forward a method of correlation and transformation between geographical national condition monitoring results and planned land use data. The differences in the core contents of land and spatial planning were sorted out, and the overall framework and specific methods for the association and transformation of geographic national conditions monitoring data and planned land use data were constructed. Wuhan City was taken as an example to carry out the specific application practice, and the optimization suggestions of geographic national conditions monitoring were put forward. This method can establish the correlation between the two classification systems and realize the docking and conversion of the two types of data. However, due to the different conversion effects of different land types, the utilization rate of converted data is not high. Sun and Jin [7] proposed a two-step decoding space vector data (SVD) parallel conversion algorithm. The initial decoding only analyzes the spatial metadata, balances the analysis tasks according to the geometric complexity, and improves the balance between the analysis and the amount of data. The secondary decoding uses the geometric parallel analysis mechanism to extract, analyze and compress the geometric bytes, and improve the conversion efficiency. The algorithm has the advantage of performance expansion, which greatly reduces the data tilt caused by uneven geometric complexity, but there is a problem of low data conversion efficiency.
Aiming at the problems of low data conversion efficiency, low precision and low data utilization rate after conversion in the above-mentioned traditional methods, this paper proposes a vector conversion method for building indoor space data based on attribute classification. The main research framework of this method is as follows:
The content, key points and GML expression of data vector conversion are analyzed. According to the analysis results, the dynamic feature points are obtained through the block matching detection and fusion recognition process of building indoor space image, and the optimal collection and feature recognition of building indoor space data are carried out combined with fuzzy feature extraction method; Indoor spatial data mining is realized by attribute classification method, indoor spatial data sample clustering is realized by K-means algorithm, and data denoising is realized by wavelet transform method, so as to improve the efficiency of data conversion; According to the data processing results, a building indoor spatial data conversion method based on ArcGIS The experimental results show that compared with the traditional methods, the data conversion efficiency of this method is higher, the data conversion accuracy is higher, the highest value of data conversion accuracy reaches 95.8%, and the data utilization is improved.
The content of data vector conversion
The content of spatial data vector transformation mainly includes three aspects of information: one is the coordinates of spatial positioning information entities; The second is the spatial relationship, such as the starting node, ending point, left polygon, right polygon, etc.; The third is attribute data. Because the data structure and data model of each space are not exactly the same, data loss often occurs in the process of spatial data vector conversion, and even relevant information can not be obtained. Generally, the positioning information of space target can be completely transformed. However, some spaces may contain mathematical curves, such as three-point circles and arcs, and some spaces do not have these graphic elements, so they are generally inserted into polylines during conversion, which will inevitably lose accuracy. The most easily lost information in the conversion process is the information of topological relationship, and the data model is basically consistent. If the information of topological relationship is lost in the conversion process, the topological relationship can be reconstructed in the system after data conversion. However, when the data structure is different, the transfer in and transfer out of spatial data cannot have topological relationship. For attribute data, most systems can convert, but the previous version of the external conversion file often used by users does not contain attribute data. At this time, other ways are needed to obtain attribute data.
The gist of the vector transformation process
In traditional vector conversion of spatial data, GIS software is usually used. Because the application fields and scope of GIS software are different [8], the understanding of spatial phenomena is different, and the definition, expression, and storage methods of spatial objects are also different. In the same way, the spatial data conversion and sharing that can accommodate GIS software is extremely complicated. Therefore, in order to improve the vector conversion effect of architectural spatial data, it is necessary to have a comprehensive understanding of the data model and data structure of the source data and the target data, and analyze the conceptual similarities and differences between the formats. The following issues should be emphatically considered:
Data organization method: whether the data is organized according to geometric types (points, lines, areas), or organized according to physical meanings, etc.; Attribute data: some data formats have attribute data, and some do not; some attributes are stored together with graphic data in the form of files, and some attribute data are stored in professional databases; Whether there are topological relations and some main topological concepts; Whether there is 3D coordinate information; Some data have graphic features, such as color, line width, and line style. Some of these graphic features are defined by element classification, some are defined by attributes, and some single objects are attached by themselves; Some data contains complex objects, that is, an object is composed of multiple geometric objects.
Each GIS software platform has its own specific data format. How to convert various data sources into GML format files is a problem that must be solved in the interoperability of spatial data. The realization process is mainly to obtain the data provided by each GIS software platform, and then according to the Schema format definition of the GML document, write it into a GML document conforming to the unified format of the GML specification to meet the needs of data sharing and interoperability. GML uses the form of a file to represent spatial information data, directly manipulates the file in a form similar to writing a text file, writes it in the way of a file stream in Java, and saves it as a file with the suffix.XMl.
Figure 1 is a flow chart of GML expression of vector space data.
Flow chart of GML expression of vector space data.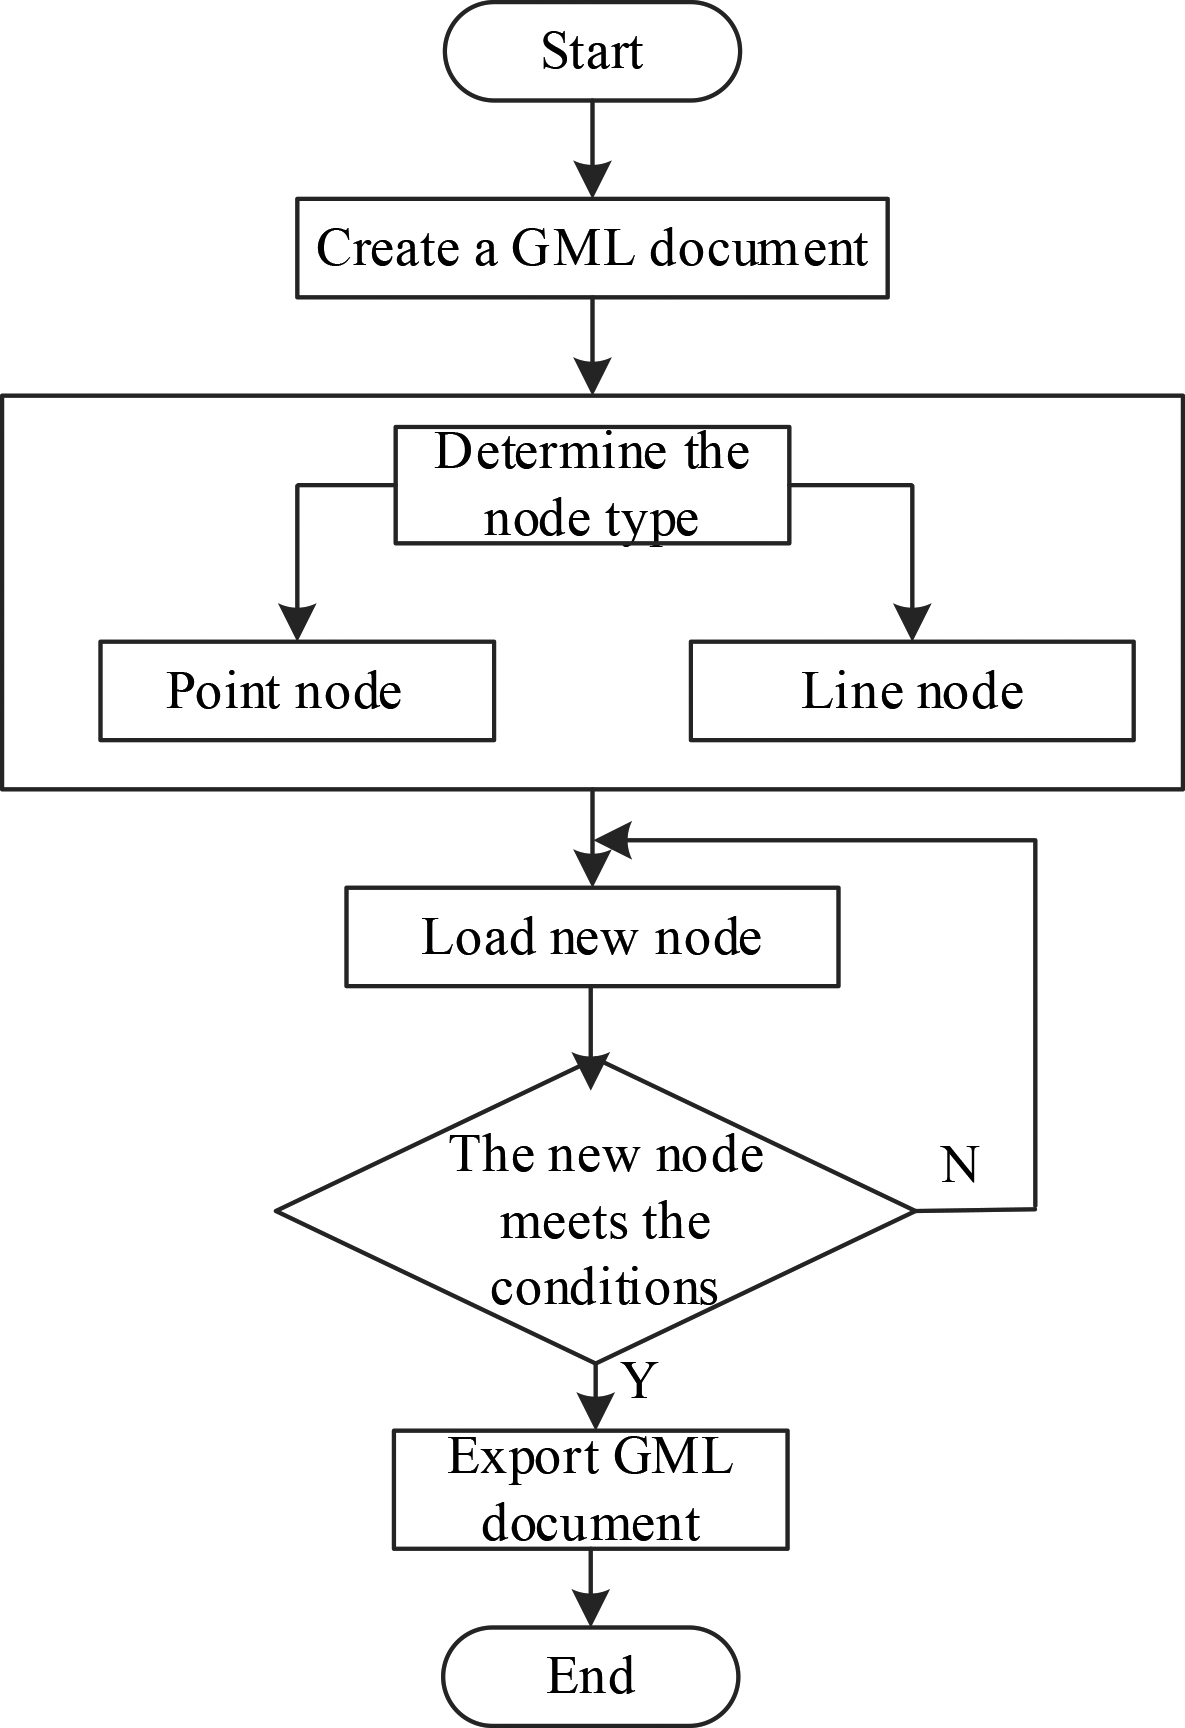
The conversion of architectural indoor space data to vector data is essentially a problem of segmentation of graphics. The principle is to extract important points, lines and surfaces and establish corresponding data files (including attribute and topological information) to vectorize architectural indoor space data. It can be the conversion of binary image to vector data link, or the direct conversion of gray image to vector data.
Block processing of building indoor space
In order to realize the vector conversion of the building indoor space data, it is necessary to obtain the dynamic feature points through the block matching detection and fusion recognition process of the building indoor space image, and then combine the fuzzy feature extraction method to optimize the collection and feature recognition of the building indoor space data. First, extract the geometric features of the indoor space image of the building, combined with the template feature matching method for adaptive detection and fusion filtering of the indoor space image of the building, in the spatial distribution state is concentrated, edge contour detection model of the indoor space image of the building is obtained [9]. The geometric features of the architectural indoor space image sequence feature use first-order invariant moments, moments of origin and other feature quantities to extract the geometric features of the architectural indoor space image sequence. The block template matching technology is used for automatic block processing of the indoor space image of the building, and the key feature points of the indoor space image of the building are merged according to the similarity of different features to obtain the block structure diagram of building interior space, as shown in Fig. 2.
Block structure diagram of building interior space.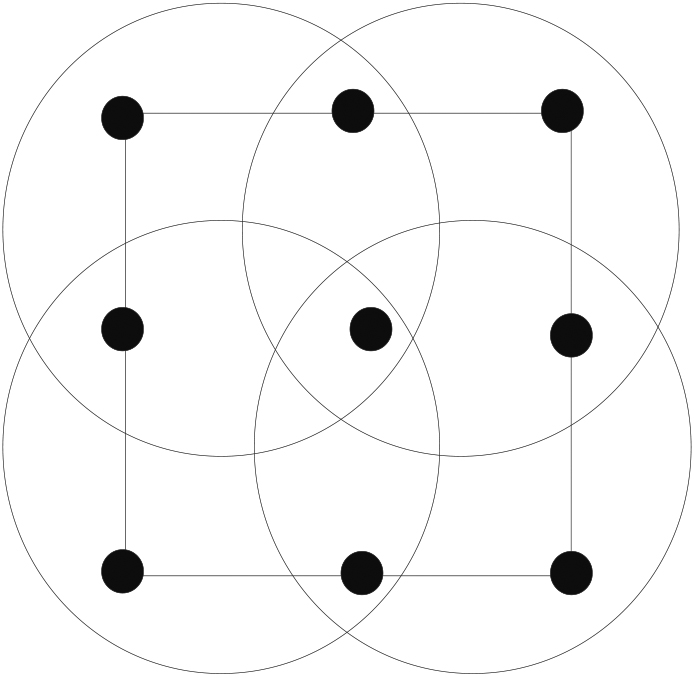
According to the block structure diagram of building interior space shown in Fig. 2, the indoor space image of the building is divided into 4
In the formula,
In the formula,
The edge pixel points of the building interior space image are composed of the characteristics of the edge contour of the image. Take the nearest neighbor points of the unknown sample, match the features according to the texture set of the building interior space image, classify the building interior space image to be extracted into the vector quantization set, and use the real-time graphics rendering method to suppress the dynamic feature points of the building interior space image. Combined with the edge fuzzy feature detection method, the local dynamic feature point detection output of the building interior space image is realized, which is as follows:
In the formula,
According to the analysis, design the building indoor space image collection model and the edge feature detection model of the space decoration feature points, and the spatial distribution pixel set is expressed as follows:
In the formula,
Based on the analysis, a model of building indoor space image collection and information fusion is constructed, which improves the vectorization conversion and feature segmentation capabilities of building indoor space data.
The data mining method based on attribute classification is based on the relational table in the database. When the original data increases, the data scale can be compressed by simplification, so that it is only related to the attribute value, but independent of the original data volume. In the current data storage, almost all data is stored in the form of relational table, which provides great convenience for the data mining method based on attribute classification, and can easily find the relationship between attributes to form decision rules or production rules [10]. The data mining method introduced in this paper is divided into two steps. The first step is to collect and sort out the data to form a basic table for preparation. The second step is to classify the attributes of the basic table, find the relationships among them and form decision rules.
In the mining method based on attribute classification, the process of sorting and reduction is mainly discretization and eliminating duplicates. Discretization is to change some continuous values into discrete values according to intervals, so that the whole table is represented by discrete data, eliminate duplicate items, reduce the amount of data and facilitate analysis and use.
Each column in the relational table is the value set of an attribute, and the column name is the attribute. In the relation table, attributes can be divided into two categories according to the needs of decision rules, one is conditional attributes, the other is decision attributes [11]. The value of conditional attribute has an impact on the value of decision attribute, and even the change of an attribute value changes the value of decision attribute.
The collection of building indoor space data attributes is represented by
Table 1 is the attribute table of building indoor space data. For convenience, this table is only a preprocessing table, and some attributes are omitted.
Attribute table of building indoor space data
Attribute table of building indoor space data
As shown in Table 1, in these tuples, each tuple represents the value of its class C attribute under certain circumstances and meets the conditions of class A and B.
According to the analysis, we can obtain the indoor spatial data attributes of the building based on the attribute classification, and realize the data mining of different attributes according to the attributes of the data, and provide the data basis for the data vector conversion. It should be noted that there is a certain inevitability between the condition attribute of the data and the decision attribute, and it can be measured by credibility.
Although different attributes and different types of building indoor space data can be mined through attribute characteristics, due to the huge amount of building indoor space data, it is inevitable that there will be invalid data, redundant data and other data types. To obtain accurate data vector conversion results, these data must be processed further. This paper uses the K-means algorithm to cluster the effective data in the data set, and the clustered data is the effective data, which can ensure the accuracy of the final data conversion result [12].
The process of dividing physical or abstract geometry into similar objects is called clustering, which is an unsupervised method. The K-means clustering method is mainly used to solve the classic nonlinear partition problem. The following uses the K-means algorithm to cluster the building indoor space data samples. The specific operation steps are as follows:
The similarity between the sample and the cluster center is mainly judged by Euclidean distance. The general calculation formula of Euclidean distance is:
In Eq. (5),
If Eq. (6) holds, then
In the formula,
To update the clustering center of the building indoor space data, there are:
In the formula,
In the formula,
At this point, the clustering processing of building interior space data is completed. In order to improve the accuracy of data conversion and the utilization rate of converted data, it is also necessary to de-noise the data after clustering processing. The specific process is as follows.
Because the building indoor spatial data contains noisy data, in order to reduce the complexity of later data conversion and improve the efficiency of data conversion, this paper uses the wavelet transform method to denoise the noise data in advance. The specific operation steps of building indoor spatial data denoising are given:
Data dimensionality reduction is realized through noise adjustment to obtain a few bands containing most of the energy and a few bands containing a small part of the energy. The band containing a small part of energy is denoised in two-dimensional space, that is, the band is subjected to two-dimensional complex wavelet transform. At the same time, the wavelet coefficients are shrunk by wavelet transform method, and then the two-dimensional complex wavelet transform is carried out again. The one-dimensional complex wavelet transform is performed on the data block containing a small part of energy, and the neighborhood threshold method is used to shrink the wavelet coefficients again. In this process, the calculation formula of neighborhood threshold is as follows:
Convert it to obtain:
In the formula, Use the previously saved band and the re-obtained band to reconstruct the data to obtain the denoising data.
Take the data that has been processed by data mining, clustering and denoising as the object, and perform vector conversion processing on it to obtain the final vector conversion result of building indoor space data.
InfoWorks ICM has flexible data interfaces for model data processing, including ArcGIS, CAD, Excel, etc. When importing CAD polyline data, ICM can automatically generate point layer data at both ends of the online layer data, automatically number it, and initially construct the indoor spatial topological relationship of the building, which facilitates the conversion of spatial data, but the input of attribute data still requires manual labor operate. The building indoor spatial data conversion method based on ArcGIS
The vector conversion process of building indoor space data.
When InfoWorks ICM imports architectural indoor spatial data, without field matching, it can automatically generate point-level data at both ends of the spatial data, and automatically perform numbering, preliminarily constructing the topological relationship of the architectural indoor space, which is the conversion of model data provide certain convenience, but the topological structure and attribute data of the indoor space of the building still need further processing. Therefore, the conversion process of the building indoor spatial data conversion method based on ArcGIS
The optimization process of vector conversion of building indoor space data.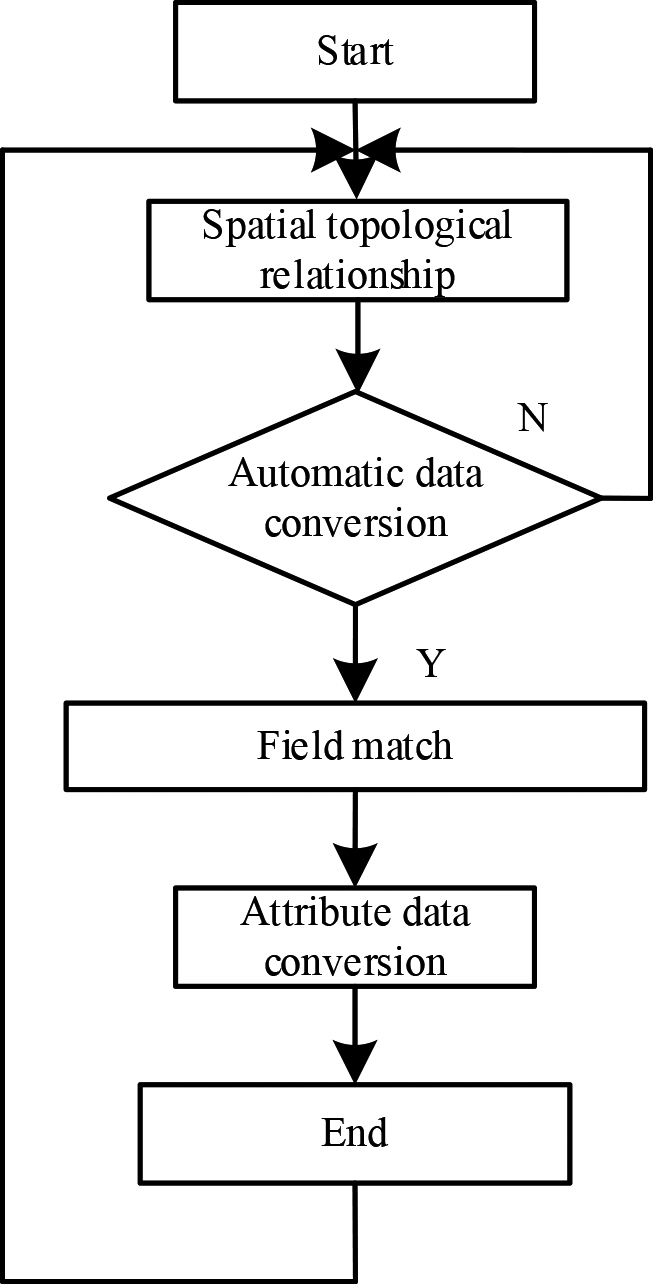
In the content, mainly completed the design of the vector transformation method of the building interior space data. Through block matching detection and fusion recognition process, dynamic feature points are obtained. Then combined with fuzzy feature extraction method, the collection and feature recognition of building interior space data are optimized. On this basis, the data mining method of attribute classification is used to simplify and compress the data scale, and then the decision or production rules are formed. In order to obtain more accurate data vector results, K-means algorithm is used to cluster the effective data in the data set, and then wavelet transform method is used to denoise the noisy data. The design process of this method can not only reduce the time of data conversion, but also improve the accuracy of data conversion. At this point, the pre-optimization of vector transformation of building interior space data is completed, which lays a foundation for the realization of vector transformation of data.
In order to verify the validity and comprehensiveness of the proposed vector conversion method of building indoor space data based on attribute classification, simulation experiments are carried out. In the experiment, the method of Reference [6] and the method of Reference [7] are used as comparison methods to compare with the method in this paper to analyze the application effects of different methods.
Experimental environment and data source
First, need to build the corresponding simulation scene, and the result of the simulation scene is shown in Fig. 5.
Experimental object.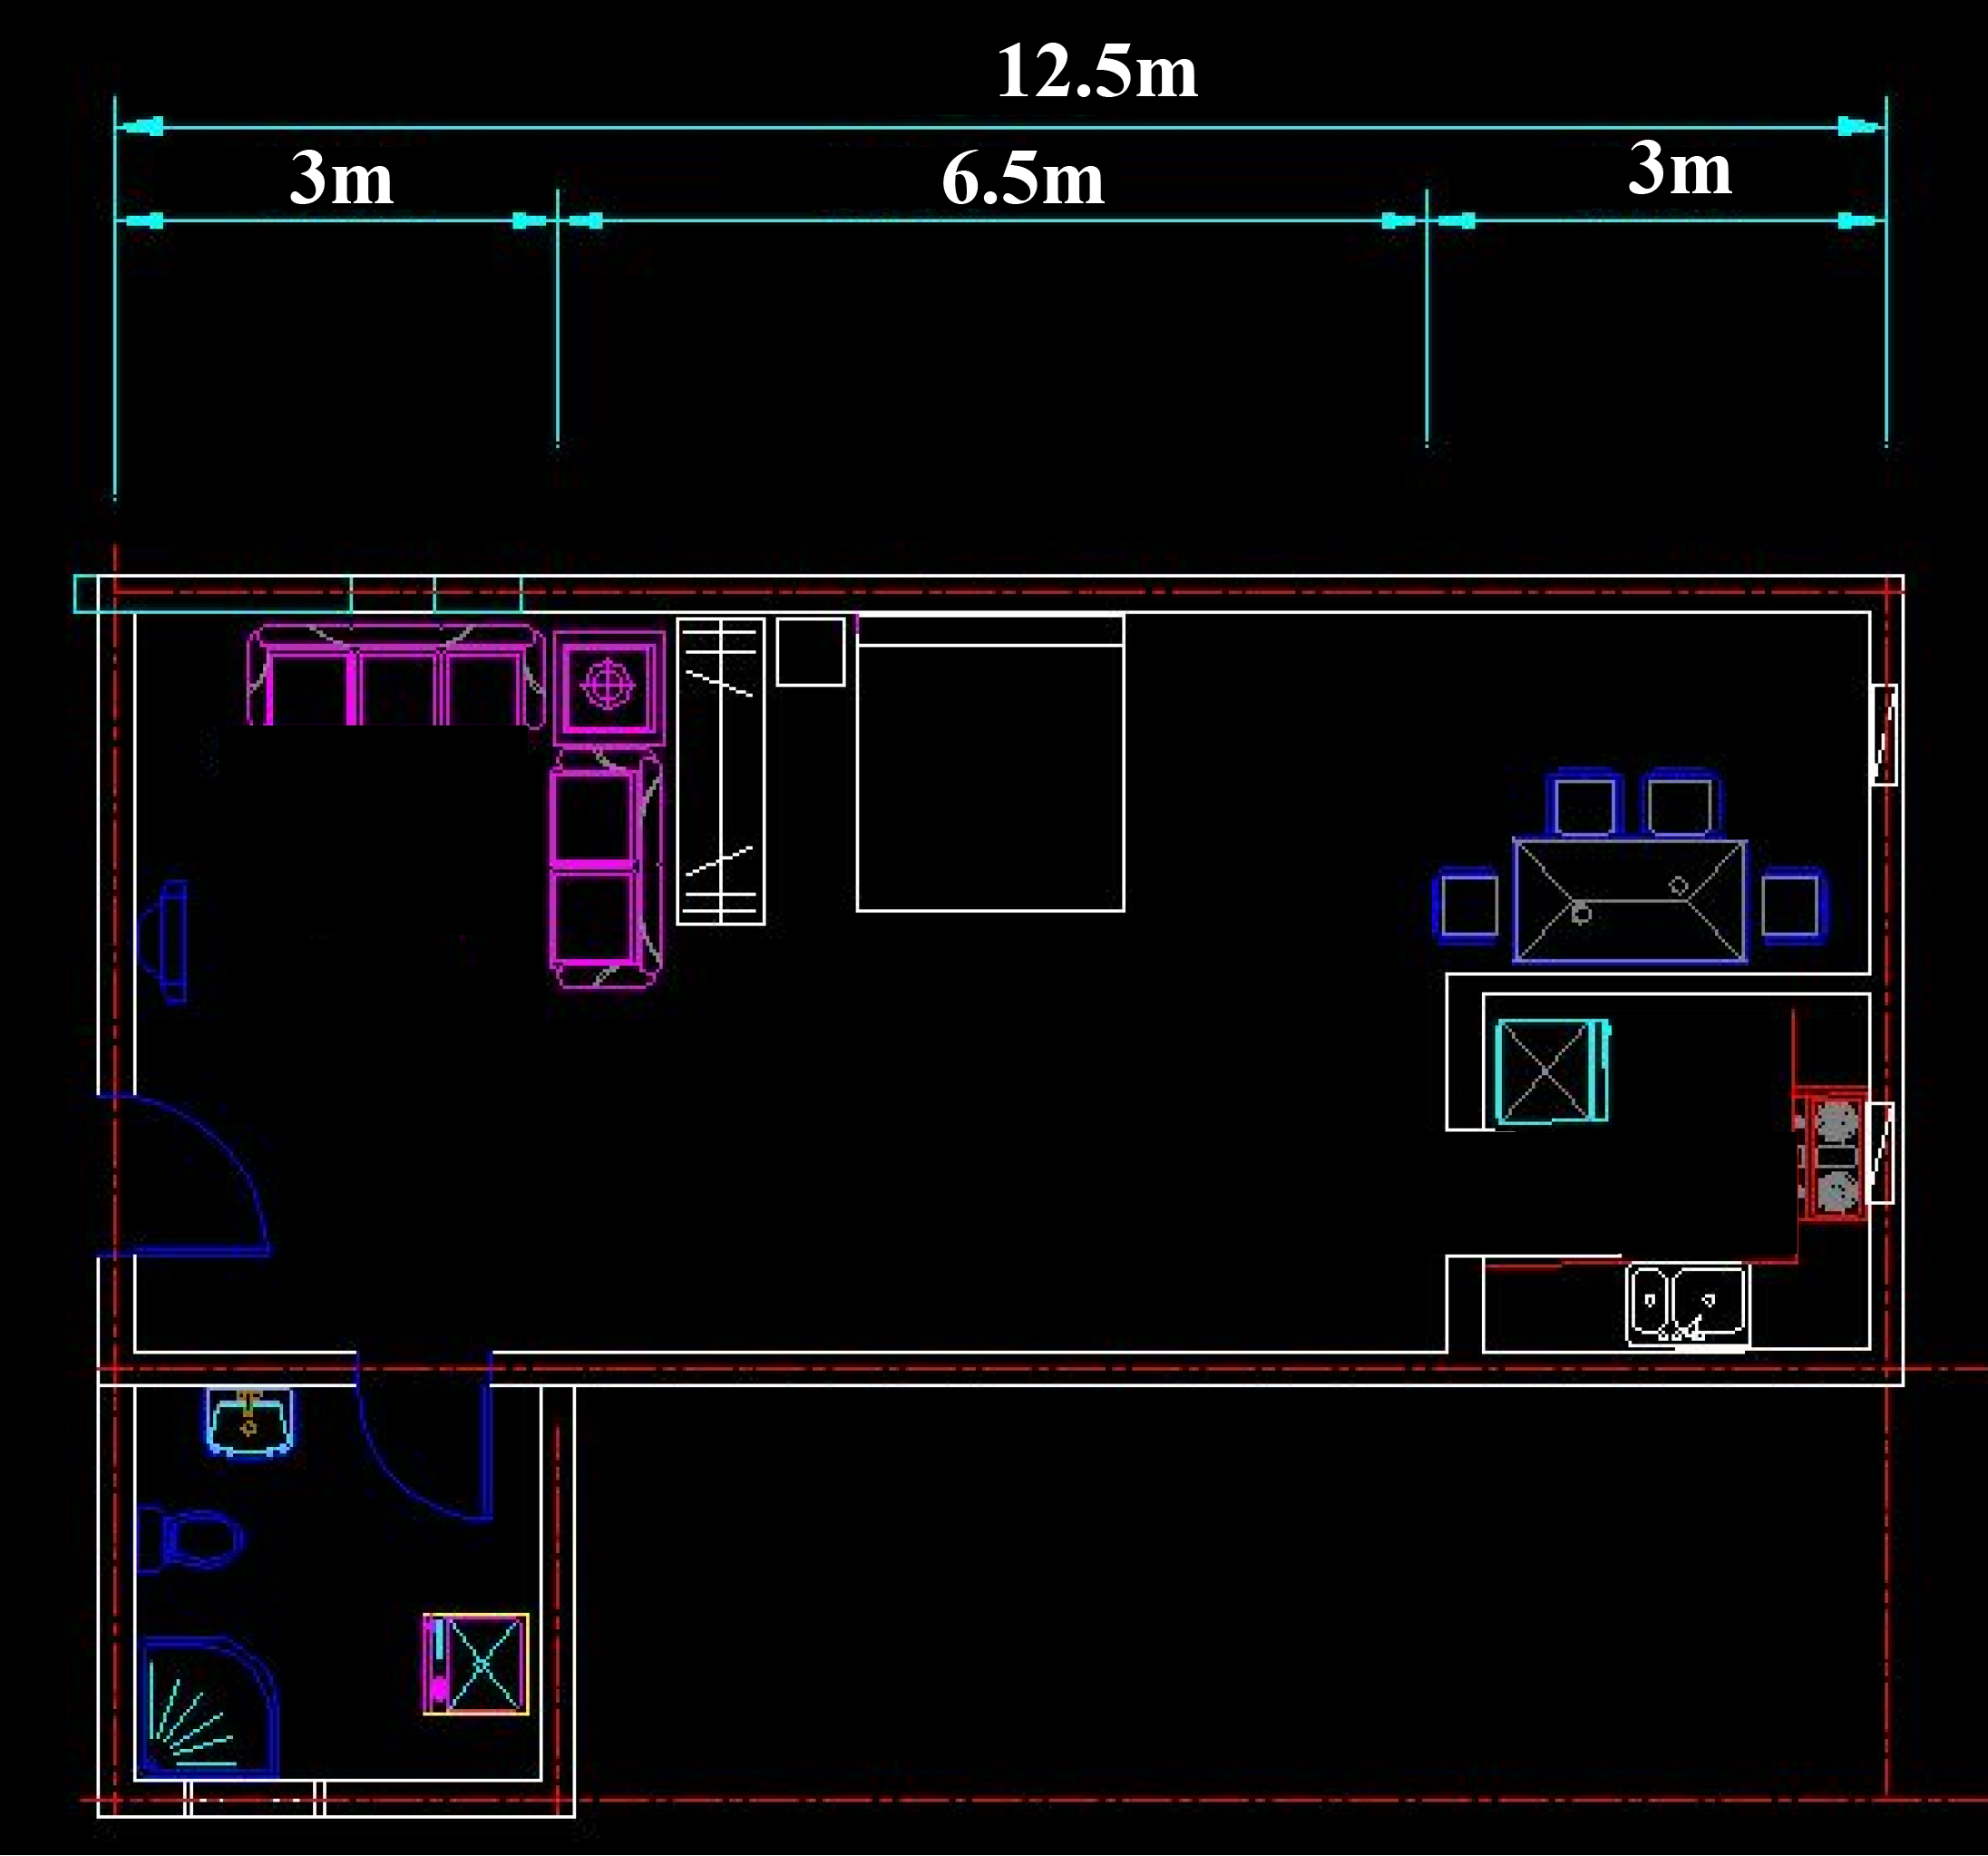
The experiment was carried out under the hardware conditions of the processor being Intel Core-M480I5CPU@2.67GHz, the memory being 8GB, the operating system being 64-bit, and the version being Windows10. The simulation data set My-Sea is selected as the basic data set, and the data is analyzed through the online data analysis software MOA (massive online analysis). Due to the influence of various factors during the experiment, the experimental data will have errors. In order to avoid the influence of the error on the experimental results, repeated measurements will be carried out and the average value will be obtained to reduce the influence of the error.
In order to improve the efficiency and accuracy of data conversion, as well as the utilization rate of converted data, this paper studies the vector transformation method of building indoor space data based on attribute classification. Therefore, in the experimental part, the three are set as experimental indexes to measure the effectiveness of the proposed method.
Data conversion efficiency: this indicator is mainly verified by data conversion time, the shorter the time, the higher the efficiency; Data conversion accuracy: used to verify whether the data can be converted into the specified format, the higher the conversion accuracy, the better the data conversion effect; Data utilization rate after conversion: that is, the converted data can be used in practice. This indicator mainly reflects the application value of the data conversion method.
Experiment 1:
The data conversion efficiency of the method in this paper, the method in Reference [6] and the method in Reference [7] are compared, respectively. Comparison results of data conversion efficiency of different methods are shown in Fig. 6.
Comparison results of data conversion efficiency of different methods.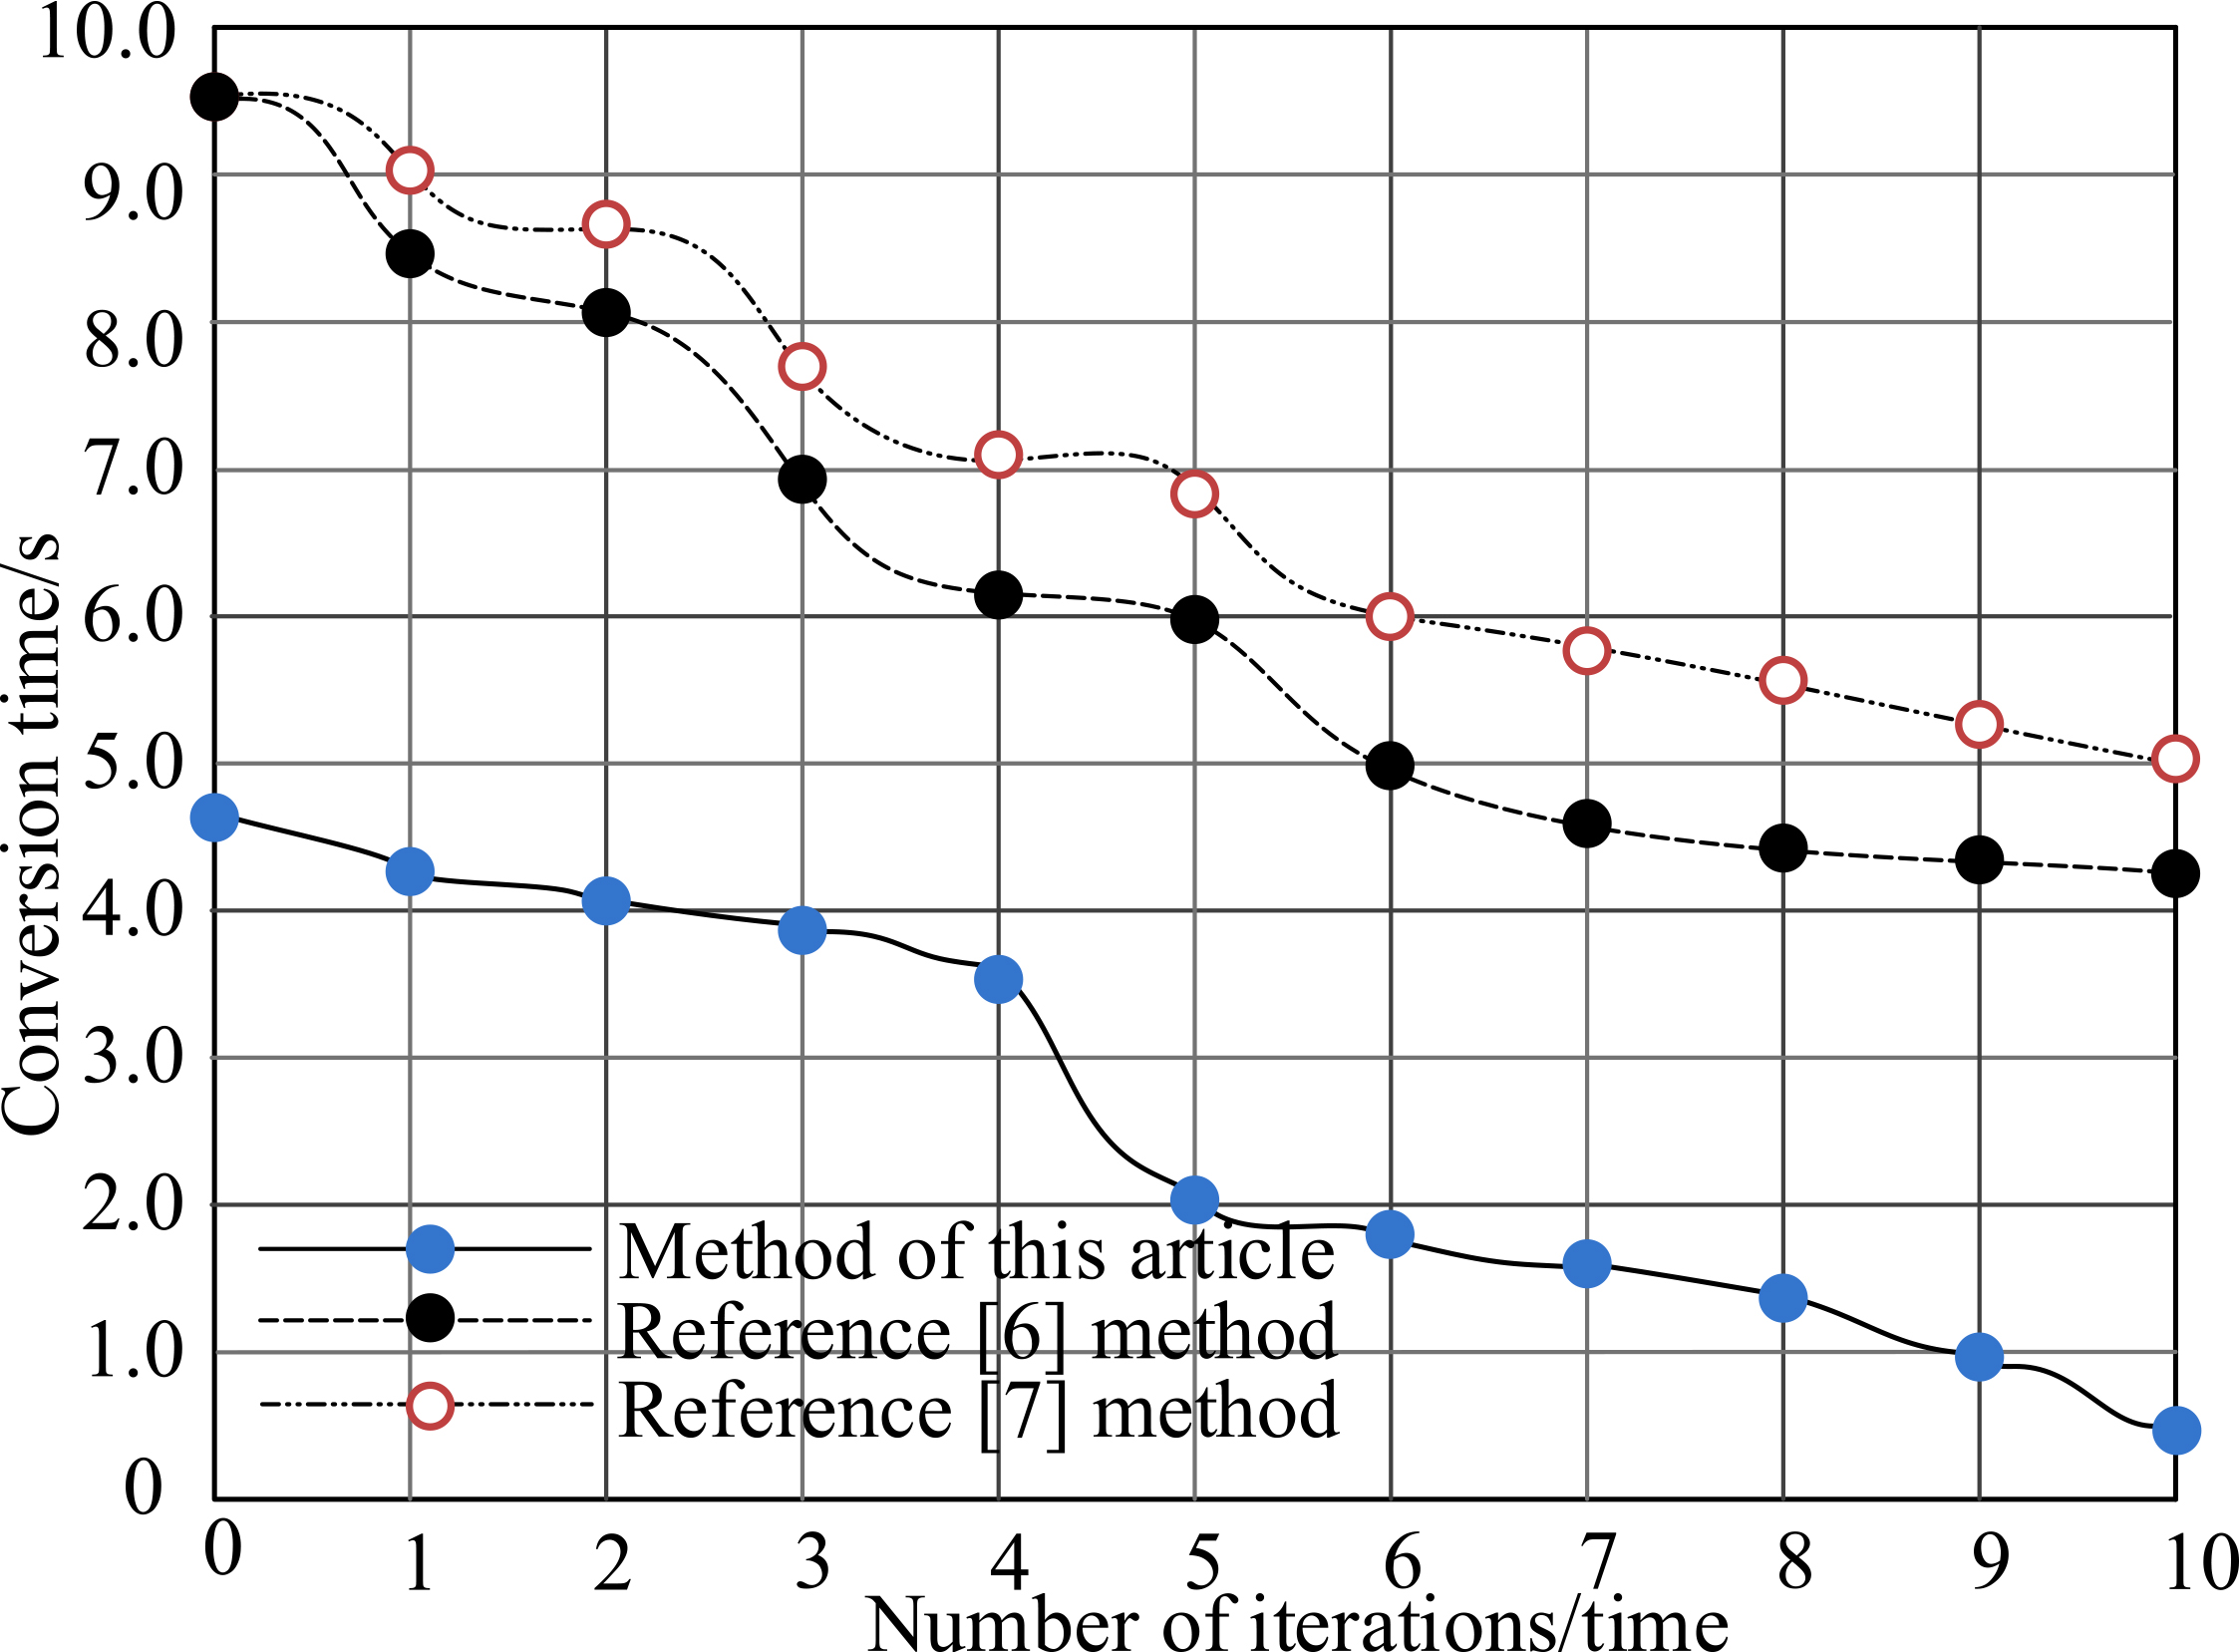
According to Fig. 6, as the number of iterations increases, the data conversion time of different methods has shown a continuous downward trend. Among them, the data conversion time of the method in this paper is significantly lower than the method in Reference [6] and the method in Reference [7]. By analyzing the specific result data, it can be known that when the number of iterations is 5, the data conversion time of the method in this paper is 2.0 s, the data conversion time of the method in Reference [6] is 6.0 s, and the data conversion time of the method in Reference [7] is 7.0 s; When the number of iterations is 10, the data conversion time of the method in this paper is 0.5 s, the data conversion time of the method in Reference [6] is 4.2 s, and the data conversion time of the method in Reference [7] is 5.0 s. Combined with the change trend of data conversion time and the comparison with specific data, it can be seen that the data conversion efficiency of this method is higher, because this method first carries out data mining, clustering and denoising before data conversion, so as to reduce the impact of interference data on data conversion.
Experiment 2:
The data conversion accuracy of the method in this paper, the method in Reference [6] and the method in Reference [7] are respectively compared. Comparison results of data conversion accuracy of different methods are shown in Table 2.
Comparison results of data conversion accuracy of different methods
By analyzing the experimental data in Table 2, it can be seen that there are obvious differences in the data conversion accuracy of each method. The data conversion accuracy of the method in this paper is significantly higher than that of the other two methods, and the maximum data conversion accuracy reaches 95.8%, which comprehensively verifies the superiority of the proposed method. This is because this method introduces the attribute classification method into the process of building indoor spatial data mining, obtains the building indoor spatial data attributes, realizes different attribute data mining according to the data attributes, and provides a data basis for data vector conversion.
Experiment 3:
In order to further verify the performance of the method in this paper, the data utilization rate after conversion of the method in this paper, the method in Reference [6] and the method in Reference [7] are compared, respectively. Data utilization comparison results of different methods are shown in Fig. 7.
Data utilization comparison results of different methods.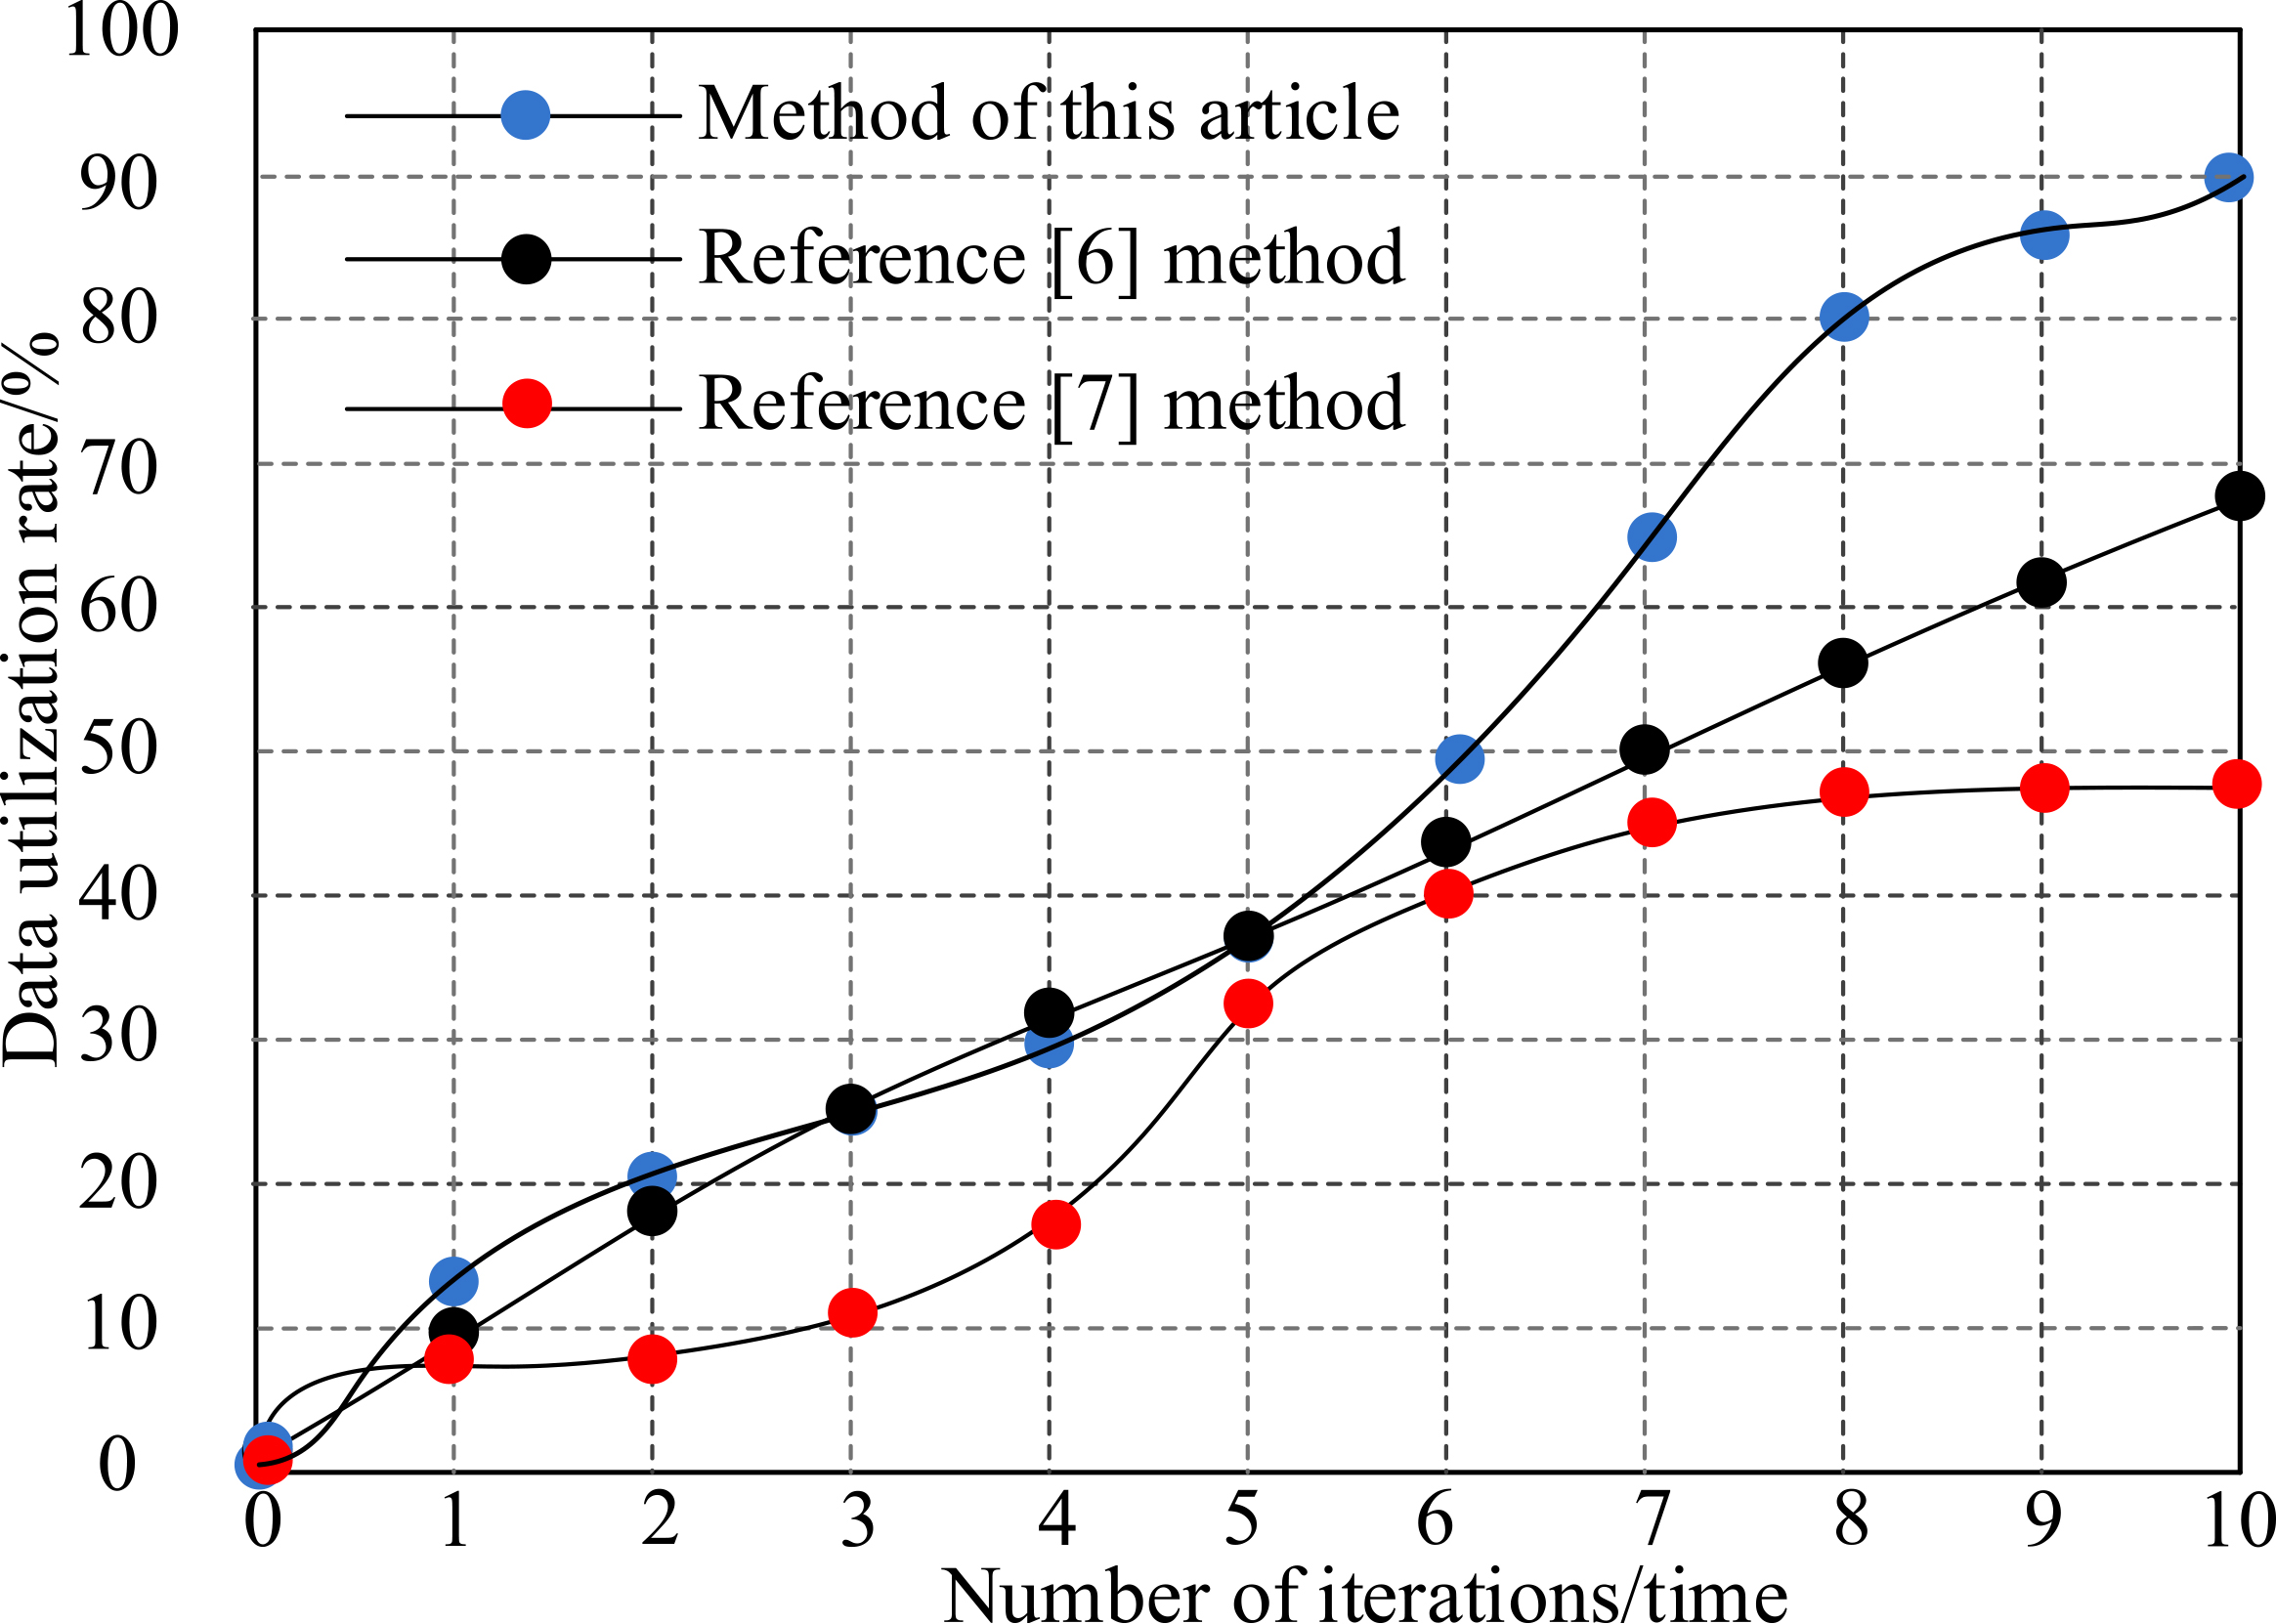
By analyzing the experimental data in Fig. 7, it can be seen that the utilization rate of the data after the conversion processing of the method in this paper is generally higher than that of the method in Reference [6] and the method in Reference [7]. Although the difference between the data utilization rate of the method in Reference [6] and the method in this paper is small when the number of iterations is less than 5, the advantage of the method in this paper is gradually obvious with the increase of the number of iterations, the data utilization rate of Reference [7] method is the lowest among the three methods. Therefore, this method is conducive to improve the utilization of data and has higher application value.
In order to solve the problems of low data conversion efficiency, low accuracy and low data utilization after conversion in traditional methods, a vector conversion method of building indoor spatial data based on attribute classification is proposed. The following is the key content of this paper:
Analyze the content, key points and GML expression of data vector conversion, and preprocess the data according to the analysis results; Indoor spatial data mining is realized by attribute classification method, indoor spatial data sample clustering is realized by K-means algorithm, and data denoising is realized by wavelet transform method; According to the data processing results, a method of building indoor spatial data conversion based on ArcGIS The experimental results show that this method has high data conversion efficiency and high data conversion accuracy, the highest data conversion accuracy reaches 95.8%, and the data utilization is improved. The research content of this paper but there are still some limitations, such as this article is not to explore the factors influencing the utilization value of the converted data what are the specific content, in future studies, then explores its will be aimed at this point, after mastering the influence factors of concrete, to more in-depth analysis of the data transformation, in order to better improve the utilization rate of the transformed data.