
Abstract
In the identification of network text information, the existing technology is difficult to accurately extract and classify text information with high propagation speed and high update speed. In order to solve this problem, the research combines the Naive Bayes algorithm with the feature two-dimensional information gain weighting method, uses the feature weighting method to optimize the Naive Bayes algorithm, and calculates the dimension of different documents and data categories through a new feature operation method. The data gain between them can improve its classification performance, and the classification models are compared and analyzed in the actual Chinese and English databases. The research results show that the classification accuracy rates of the IGDC-DWNB model in the Sogou database, 20-newsgroup database, Fudan database and Ruster21578 database are 0.89, 0.89, 0.93, and 0.88, respectively, which are higher than other classification models in the same environment. It can be seen that the model designed in the research has higher classification accuracy, stronger overall performance, and stronger reliability and robustness in practical applications, which can provide a new development idea for big data classification technology.
Introduction
Under the development trend of the digital age, the Internet has become the main means for human beings to obtain information from the outside world. With the increasing dependence of human beings on this means of information acquisition, the information on the Internet is gradually enriched and increased to human beings. Perception is difficult to fully process directly [1]. The vast majority of data in the Internet is embodied in the form of text data. On the basis of text data, multimedia information will be derived, and all information is guided by text information. Therefore, efficient identification and classification of text data is an important basis for efficient data processing in the information age [2]. As one of the important tools for the classification of Internet data and texts, the Bayesian algorithm system can form a certain classification effect, but its basic assumptions differentiate the features between different texts, so the consistent classification performance cannot be effectively improved [3]. Naive Bayes (NB) has been widely used in the field of data classification by scholars due to its rich probability expression ability and the incremental learning characteristics of comprehensive prior knowledge. However, the assumption that features are independent of each other is not in line with reality. Most scholars improve the algorithm from feature weighting, algorithm improvement and feature selection, but these improvement methods are relatively single and do not comprehensively consider the factors affecting feature weight. In the current research results, few feature selection methods can significantly improve the classification accuracy while maintaining the indirectness and low time complexity of the model. Therefore, the research uses the feature two-dimensional information gain weighting technology to optimize the Bayesian classification model, thereby improving the text data classification performance of the classification model and improving the classification effect. On the one hand, this research enriches the application practice cases of Naive Bayesian algorithm in other fields, and on the other hand, it also provides a more robust and stable performance strategy for the field of hybrid big data classification, which is widely used and more suitable for practical applications.
Related work
NB classification model is widely used in data classification because of its simplicity, efficiency and effectiveness. The principle of the algorithm is to first calculate the prior probability of each category, then calculate the posterior probability of each feature belonging to a certain category by using Bayesian theorem, select the category with the largest posterior probability estimate, and then determine the final category. In terms of algorithm improvement, scholars mostly use depth weighting to improve the Nb model, but few feature selection methods in the current research results can significantly improve its classification accuracy while maintaining the indirectness and low time complexity of the model. Prahartiwi and Dari [4] combined naive Bayesian algorithm, support vector machine and decision tree algorithm and applied it to breast cancer data prediction. The results showed that the prediction accuracy of the method designed in the study was higher than the traditional prediction method. Isa [5] proposed a potential debtor evaluation system based on the Naive Bayes algorithm, which can predict the debtor’s repayment according to the credit status of the potential debtor and provide suggestions. The results show that the accuracy of the method is 86%. Has application significance. Cao et al. [6]proposed a naive Bayesian model-based post-chemotherapy emesis risk prediction model. The study conducted cross-validation on 3,000 patients to test the performance of the model. The results showed that the model had good performance in predicting the risk of emesis. Resti et al. [7] applied polynomial naive Bayesian to diabetes status detection. The research conducted cross-validation after training the model. The results showed that the polynomial naive Bayesian model could obtain accurate prediction results in diabetes prediction.
In addition, researchers in the field of big data classification are constantly trying new technologies. Brahmane and Krishna [8] proposed a big data classification technology based on the Spark framework. The results show that this method can find suitable features in massive data and classify them. Selvi and Valarmathi [9] developed a big data classification model based on the Firefly Slave algorithm based feature selection technology. The model can select the best features of the data and use neural networks for classification. The results show that the classification efficiency of this method is higher than other methods. Lakhwani [10] conducted a comprehensive analysis of big data classification technologies, conducted a comparative study of different technologies, and re-analyzed important methods in this field. Yoanita et al. [11] used NB algorithm to establish an automatic classification model of comment emotion, which will classify positive and negative comments, and then use chi square analysis to analyze the characteristics that affect the number of subscribers. Nugroho et al. [12] used the NB classification model to classify the texts of multiple tags, and used particle swarm optimization (PSO) to optimize them. The results show that the optimization model can be used to improve the effectiveness of social electronic services. Muhajir and Chotijah [13] created an application based on Web browser to diagnose the damage type of the laptop, which uses the NB algorithm to diagnose the problems on the laptop and provide solutions. The results show that the diagnosis of web browser based applications using NB algorithm is effective and reliable. Alfianti et al. [14] used the PSO algorithm to optimize the support vector machine (SVM) and NB algorithm to improve their accuracy and provide a more accurate and effective solution to the comment classification problem. The results show that the accuracy of the optimized algorithm for comment classification has been improved. Mahmudah et al. [15] used the NB algorithm to classify driving activities, and divide the data set into training set and test set. The NB algorithm only needs a few training data. By calculating the average and variance of each feature, various probability values can be obtained, and then categories can be effectively divided. Rahutomo et al. [16] proposed a news classification model based on the NB algorithm, which automatically classifies news in the media into predetermined categories at a specific time every day, and presents its classification results in the form of pictures.
Since the NB algorithm needs to assume that each feature is independent to be true, the condition does not conform to reality. In order to weaken the method of naive Bayesian feature condition independent assumption, scholars have improved it from feature weighting, algorithm improvement and feature selection. Some scholars use the information of each feature relative to the category as the weight, and some scholars use the improved information gain rate to weight. However, the improvement of these feature weights is relatively simple, which cannot fully consider the factors affecting the feature weight. In terms of algorithm improvement, most scholars use depth weighting to improve the naive Bayesian model, and the improvement effect is more significant. In feature extraction, there are mainly two feature selection methods: filter and wrapper. However, in the current improvement results, it is difficult for feature selection methods to significantly improve the classification accuracy of the model while maintaining simplicity and low time complexity. This research starts with the depth weighting method, combines the Naive Bayesian algorithm with the feature two-dimensional information gain weighting method, and improves the classification performance of the model through the depth weighting method to achieve better big data classification effect.
Classification and extraction of attribute mixed big data based on Naive Bayes algorithm
Selection of naive Bayesian model based on data
Bayesian classification models are generally fixed or learned, and classification learning models can be divided into two types, supervised and unsupervised [17]. Two learning classification models are shown in Fig. 1.
Supervised Bayesian classification learning model.
The Bayesian classification model has two parts, one part is the training data set, which is stored by the joint probability distribution table or conditional probability distribution table; the other part is the graph structure, which consists of a special two-layer structure [18]. This kind of graph structure has two layers. The first layer is class variables, and the second layer is attribute variables. The directed edges between the two layers are all pointed by class variables to attribute variables. Any attribute variables in the second layer come from class variables. A directed edge of the variable. A one-dimensional Bayesian classification model consists of a training dataset and a structure map [19]. Common one-dimensional Bayesian classification models include the NB classification model that assumes that attribute variables are independent of each other, and the Selective Naive Bayes classification model (SNB) that removes irrelevant variables on the basis of the former. is the NB classification model [20]. The essence of the multi-dimensional Bayesian classifier is to use the Bayesian classification method to classify the unclassified data. The schematic diagram of the classification is shown in Fig. 2.
Schematic diagram of multidimensional Bayesian classifier.
The NB algorithm is a classification method using knowledge of probability and statistics. This method is simple, has high classification accuracy, and is fast. Its main idea is to first calculate the prior probability of each category, and then use Bayes’ theorem to calculate whether each feature belongs to a certain category. The posterior probability of each category is compared, and the category with the largest posterior probability estimate is obtained, which is the final required category [21]. The data classification problem targeted by NB needs to consider the independence between data features, which is a discrete problem, and there are two discrete NB models, namely the Bernoulli Naive Bayes model based on binomial distribution (Bernoulli Naïve Bayes, BNB) and multinomial Naive Bayes model (Multinomial Naive Bayes, MNB) based on multinomial distribution.
The principle of the BNB model is to think that there are two possibilities for an event to occur or not to occur. When the Bernoulli experiment is repeated n times independently, a new binomial distribution will be generated [22]. In the dataset, each feature attribute may or may not appear in the data, so the presence or absence of the attribute in the data can be regarded as a Bernoulli experiment, and all feature attributes are binomial distributions. For a data set
In Eq. (1),
The conditional probability calculation is shown in Eq. (3).
Equations (2) and (3) represent the number
In Eq. (4),
MNB model is to regard the data as an attribute bag model, and the frequency of attributes appearing in the data will affect the judgment of the data category. When MNB calculates the conditional probability, it needs to count the frequency of the attribute [23]. Let the attribute category be
In Eq. (6),
In Eq. (7),
Since the probability obtained by each calculation may have a small value, for such an underflow situation, the logarithm of the decision rule is usually taken, and the discriminant equation is as shown in Eq. (9).
In Eq. (9),
In Eq. (10),
Since the BNB model can only simply consider the presence or absence of feature attributes in statistical data, and does not consider the frequency of feature attributes, the classification accuracy of the model is not high, and the polynomial NB model has better performance on large data sets. Therefore, the study adopts the MNB model [24]. Data classification is an important research field in machine learning. Under a fixed classification standard, data sets without category labels are divided into set categories according to the characteristic attributes of the data. The basic classification process of data classification is shown in Fig. 3.
Basic classification process of data classification.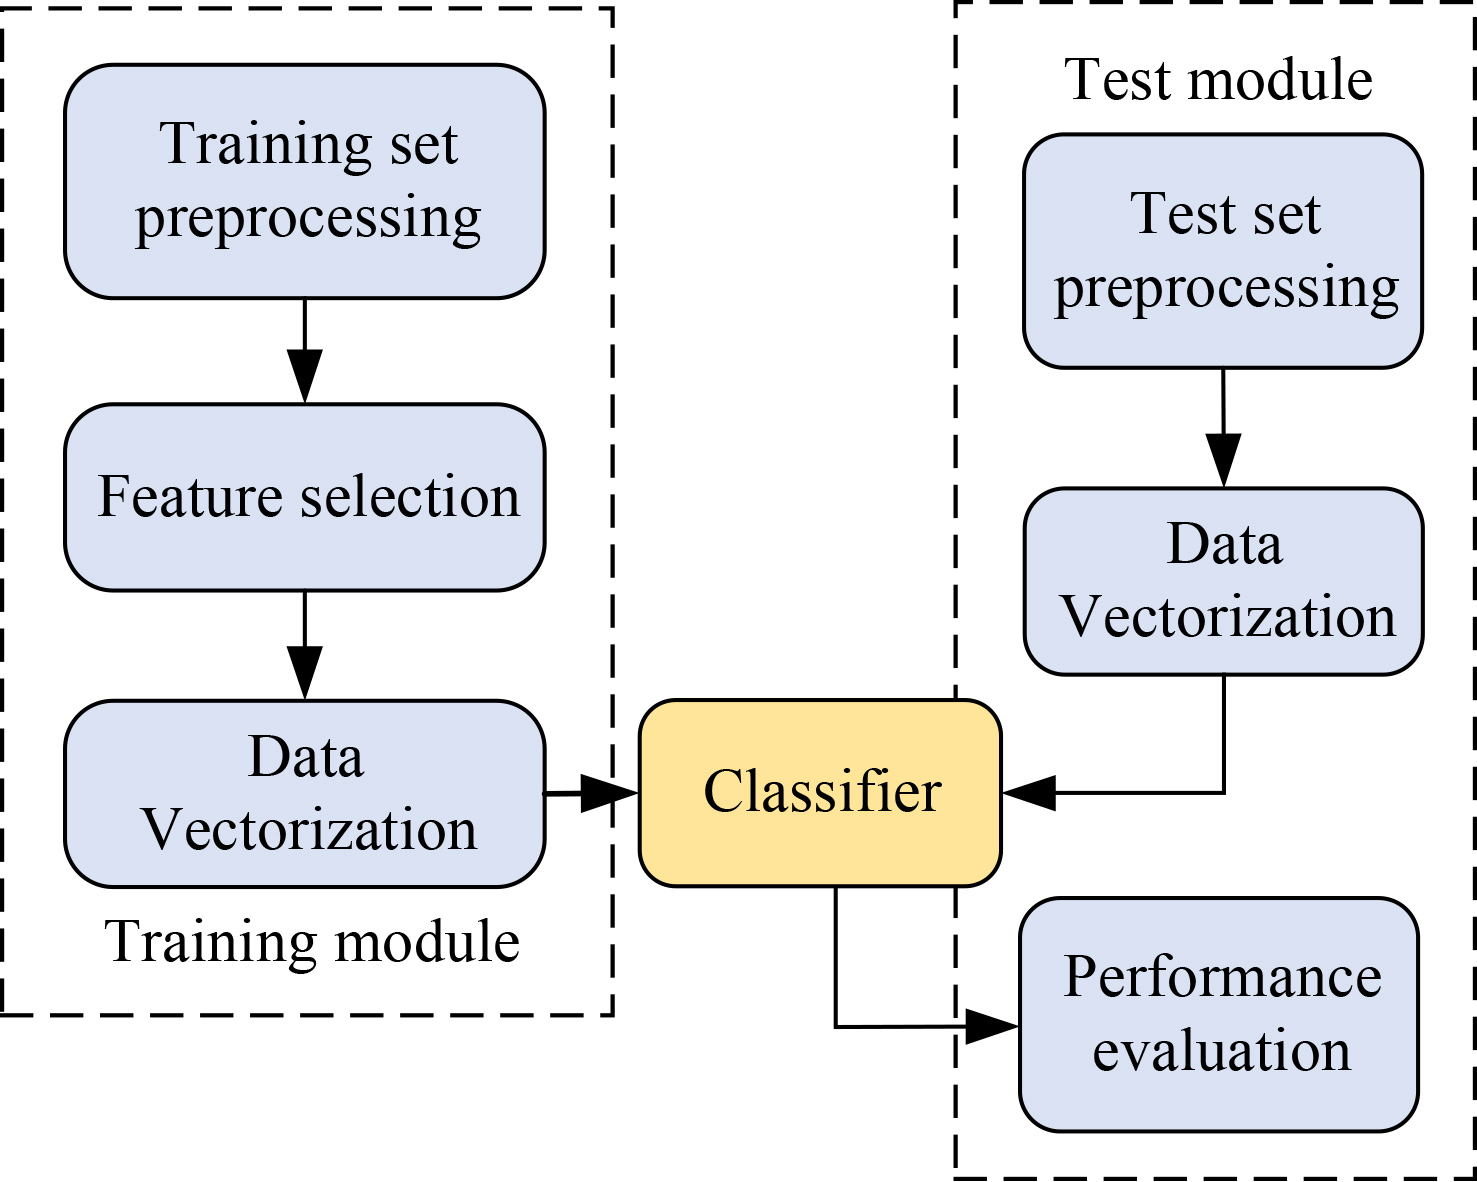
Since the performance of the classifier is affected by the feature conditional independence assumption of the NB algorithm, in order to suppress this assumption, the algorithm needs to use feature weighting. The main principle of calculating the weight of feature attributes is to first use the feature attribute selection algorithm to select the feature attributes, and then use the weight calculation method to assign weights to them. The feature attributes that have little effect on classification enable the feature attributes to better distinguish the categories of the data, thereby achieving a higher accuracy rate. In order to overcome the deficiency of this algorithm ignoring the influence of the distribution information of feature attributes within and between classes on the data classification results and improve the accuracy of classification, a NB algorithm weighted by Information Gain based on 2D Characteristic (IGDC) is proposed. The conditional probability calculation equation of is linked to the total number of features. The traditional weighting algorithm only considers the distribution of feature attributes among the class columns, and ignores the frequency of feature attributes in each category of data, which affects the weight [25]. In order to improve the accuracy of the algorithm, a weight calculation function IGDC function is defined. The improvement of data classification by feature attributes increases with the increase of information gain. Therefore, the information gain performance of features in terms of data and categories is combined to understand the degree of improvement of feature categories and data on classification. Find the feature category probability as shown in Eq. (11).
In Eq. (11),
Equation (12) represents the
In Eq. (13), IGC is the feature category information gain, which represents the relationship between the feature and the category, and
In Eq. (14),
In Eq. (15),
Equation (16) is
The index performance of classification models in Chinese databases
In order to explore the classification effect of the attribute hybrid big data classification and extraction method of the Naive Bayesian algorithm, the research will start from the comparison of algorithms and experimental data sets, and analyze the classification effect and index gap of different algorithms in different data set environments, and then measure the performance difference between different algorithms. The research experiment software environment uses Matlab6.5 programming language and Bayesian toolbox, while the hardware equipment uses Pentium PC, with 1 GB memory specification, 2.93 GHz main frequency specification and 120 GB hard disk specification.
During the experiment, the research mainly selected four main databases: Sogou experimental environment database, 20-newsgroup experimental environment database, Fudan experimental environment database and Ruster21578 experimental environment database, and collected the corresponding test data and training data from them. According to the training characteristics of the algorithm, 65% of the data in the database is used as the training set data, and 35% of the data is used as the test set data. The specific conditions of the four test databases are shown in Table 1.
Database classification
Database classification
Classification process of igdc-dwnb model.
When comparing different algorithms, the research mainly used IGDC-DWNB (IGDC Deeply Weighted Naive Bayesian Classification Model) and DFWNB (TFIDF Deeply Weighted Naive Bayesian Classification Model), IGDCNB (feature two-dimensional information The gain weighted naive Bayes classification model), OFWNB (ordinary weighted naive Bayes classification model) three types of Bayesian weighted models are compared. And analyze the differences in the corresponding accuracy index, recall index F1 index and macro F1 index. Model indicator pairs in the Sogou database environment are shown in Fig. 5.
Model comparison in Fudan database environment
Model comparison in Sogou database environment.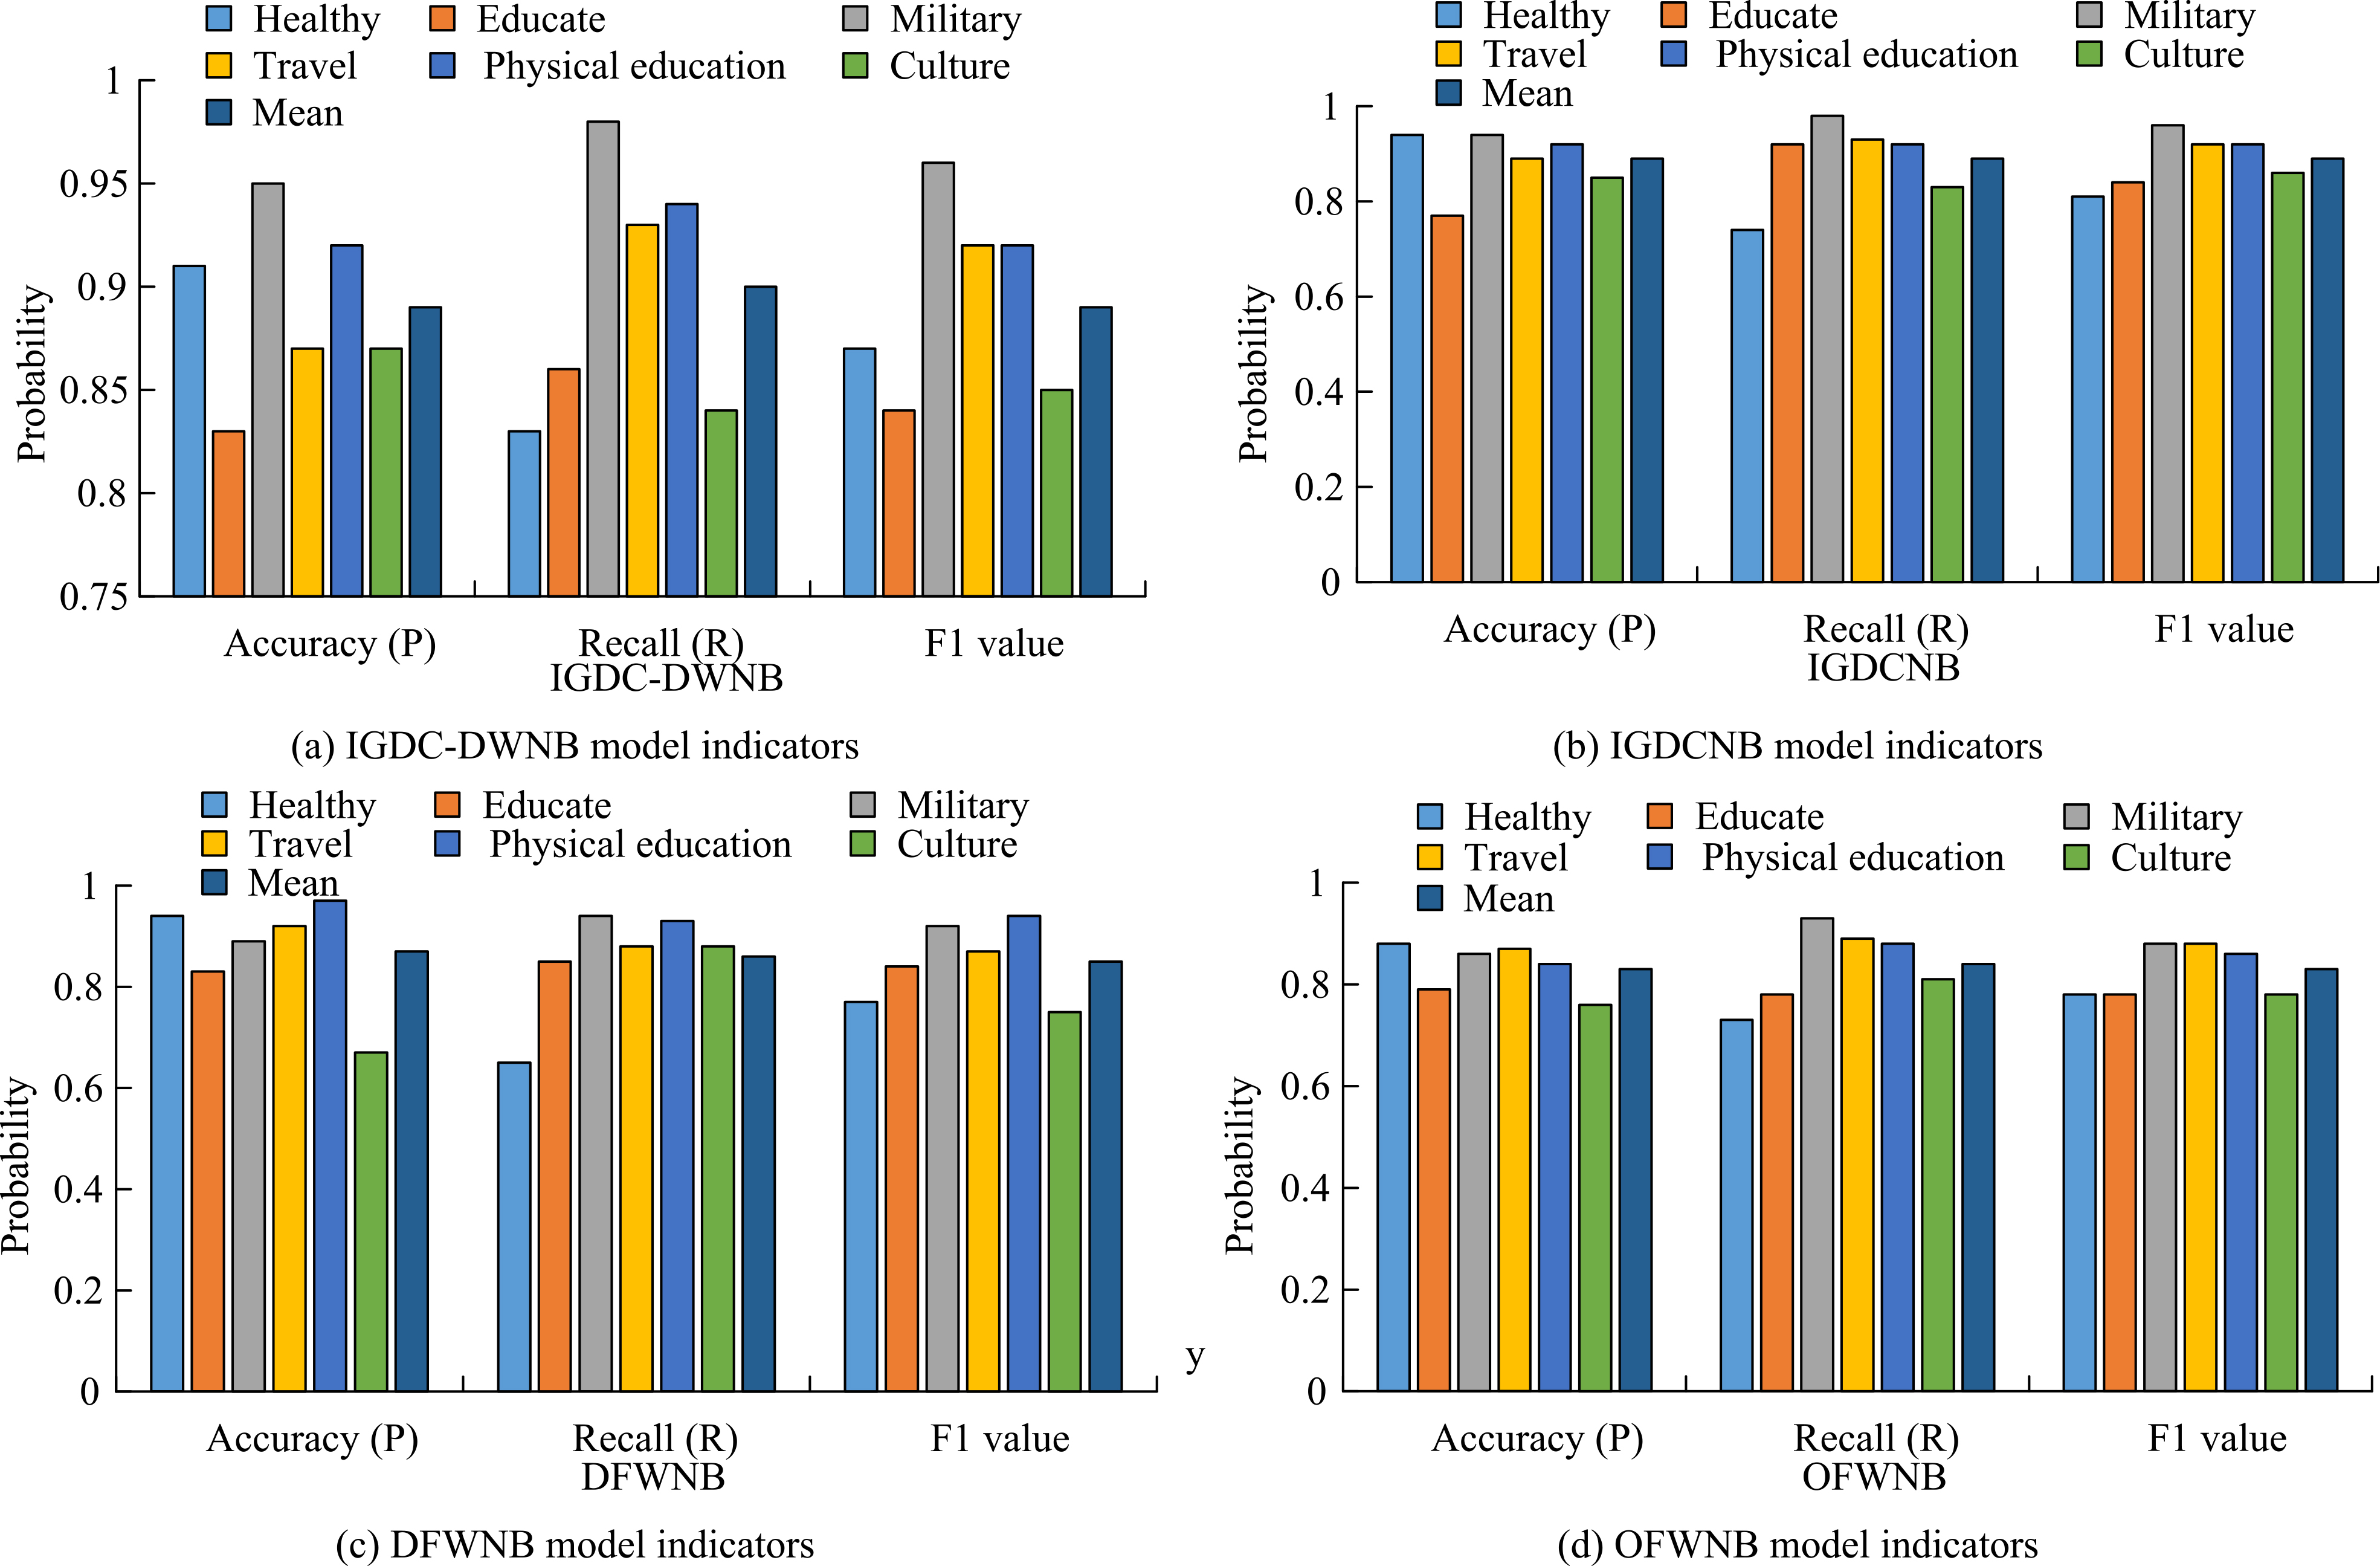
As can be seen from Fig. 5, in the Chinese database environment of Sogou database, the average accuracy of the IGDC-DWNB model is 0.89, the average recall rate is 0.90, the average value of F1 is 0.89, and the average value of the indicators is distributed around 0.90. As a comparison, the average precision, recall, and F1 value of IGDCNB are 0.89, 0.89, and 0.89, respectively. Although the average accuracy of the two models is equal to the average value of F1, the average recall rate of the IGDC-DWNB model is 0.90, which is relatively high; at the same time, the average precision rate of the DFWNB model is 0.87, the average recall rate is 0.86, and the average value of F1 is 0.85. The IGDC-DWNB model is lower, in addition, the average accuracy of the OFWNB model is 0.83, the average recall rate is 0.84, and the average value of the F1 value is 0.83. The average distribution of the indicators is about 0.83, and the overall indicator level is at the lowest level among the four models. It can be seen that in the Chinese database environment of Sogou database, the overall performance level of the IGDC-DWNB model is the highest. The model comparison results in the Fudan database environment are shown in Table 2.
As can be seen from Table 2, under the environment of Fudan database, which is also a Chinese database, the average accuracy of the IGDC-DWNB model is 0.95, the average recall rate is 0.94, and the average F1 value is 0.94, which is maintained at around 0.94 as a whole; The average accuracy of the IGDCNB model is 0.93, the average recall rate is 0.93, and the average F1 value is also 0.93. The values of the three indicators are all stable at 0.93. Compared with the IGDC-DWNB model, the overall performance level has an overall The average accuracy of the FWNB model is 0.90, the average recall rate is 0.89, and the average value of the F1 value is also 0.89. The values of the three indicators are all stable at 0.89. Compared with the first two models, the overall performance The average level of the OFWNB model showed a further decline, and the average value of two indicators failed to reach 0.90; the average accuracy of the OFWNB model was 0.86, the average recall rate was 0.89, and the average value of the F1 value was also 0.86. Steady at around 0.87, the overall performance level is the lowest among the four models. It can be seen that in the Fudan database environment, which also belongs to the Chinese database, the IGDC-DWNB model has obvious advantages in the three indicators of accuracy, recall, and F1 value. In the two database environments, Fudan database and Sogou database, the macro F1 value comparison of the four models is shown in Fig. 6.
Macro F1 values of four models in two database environments.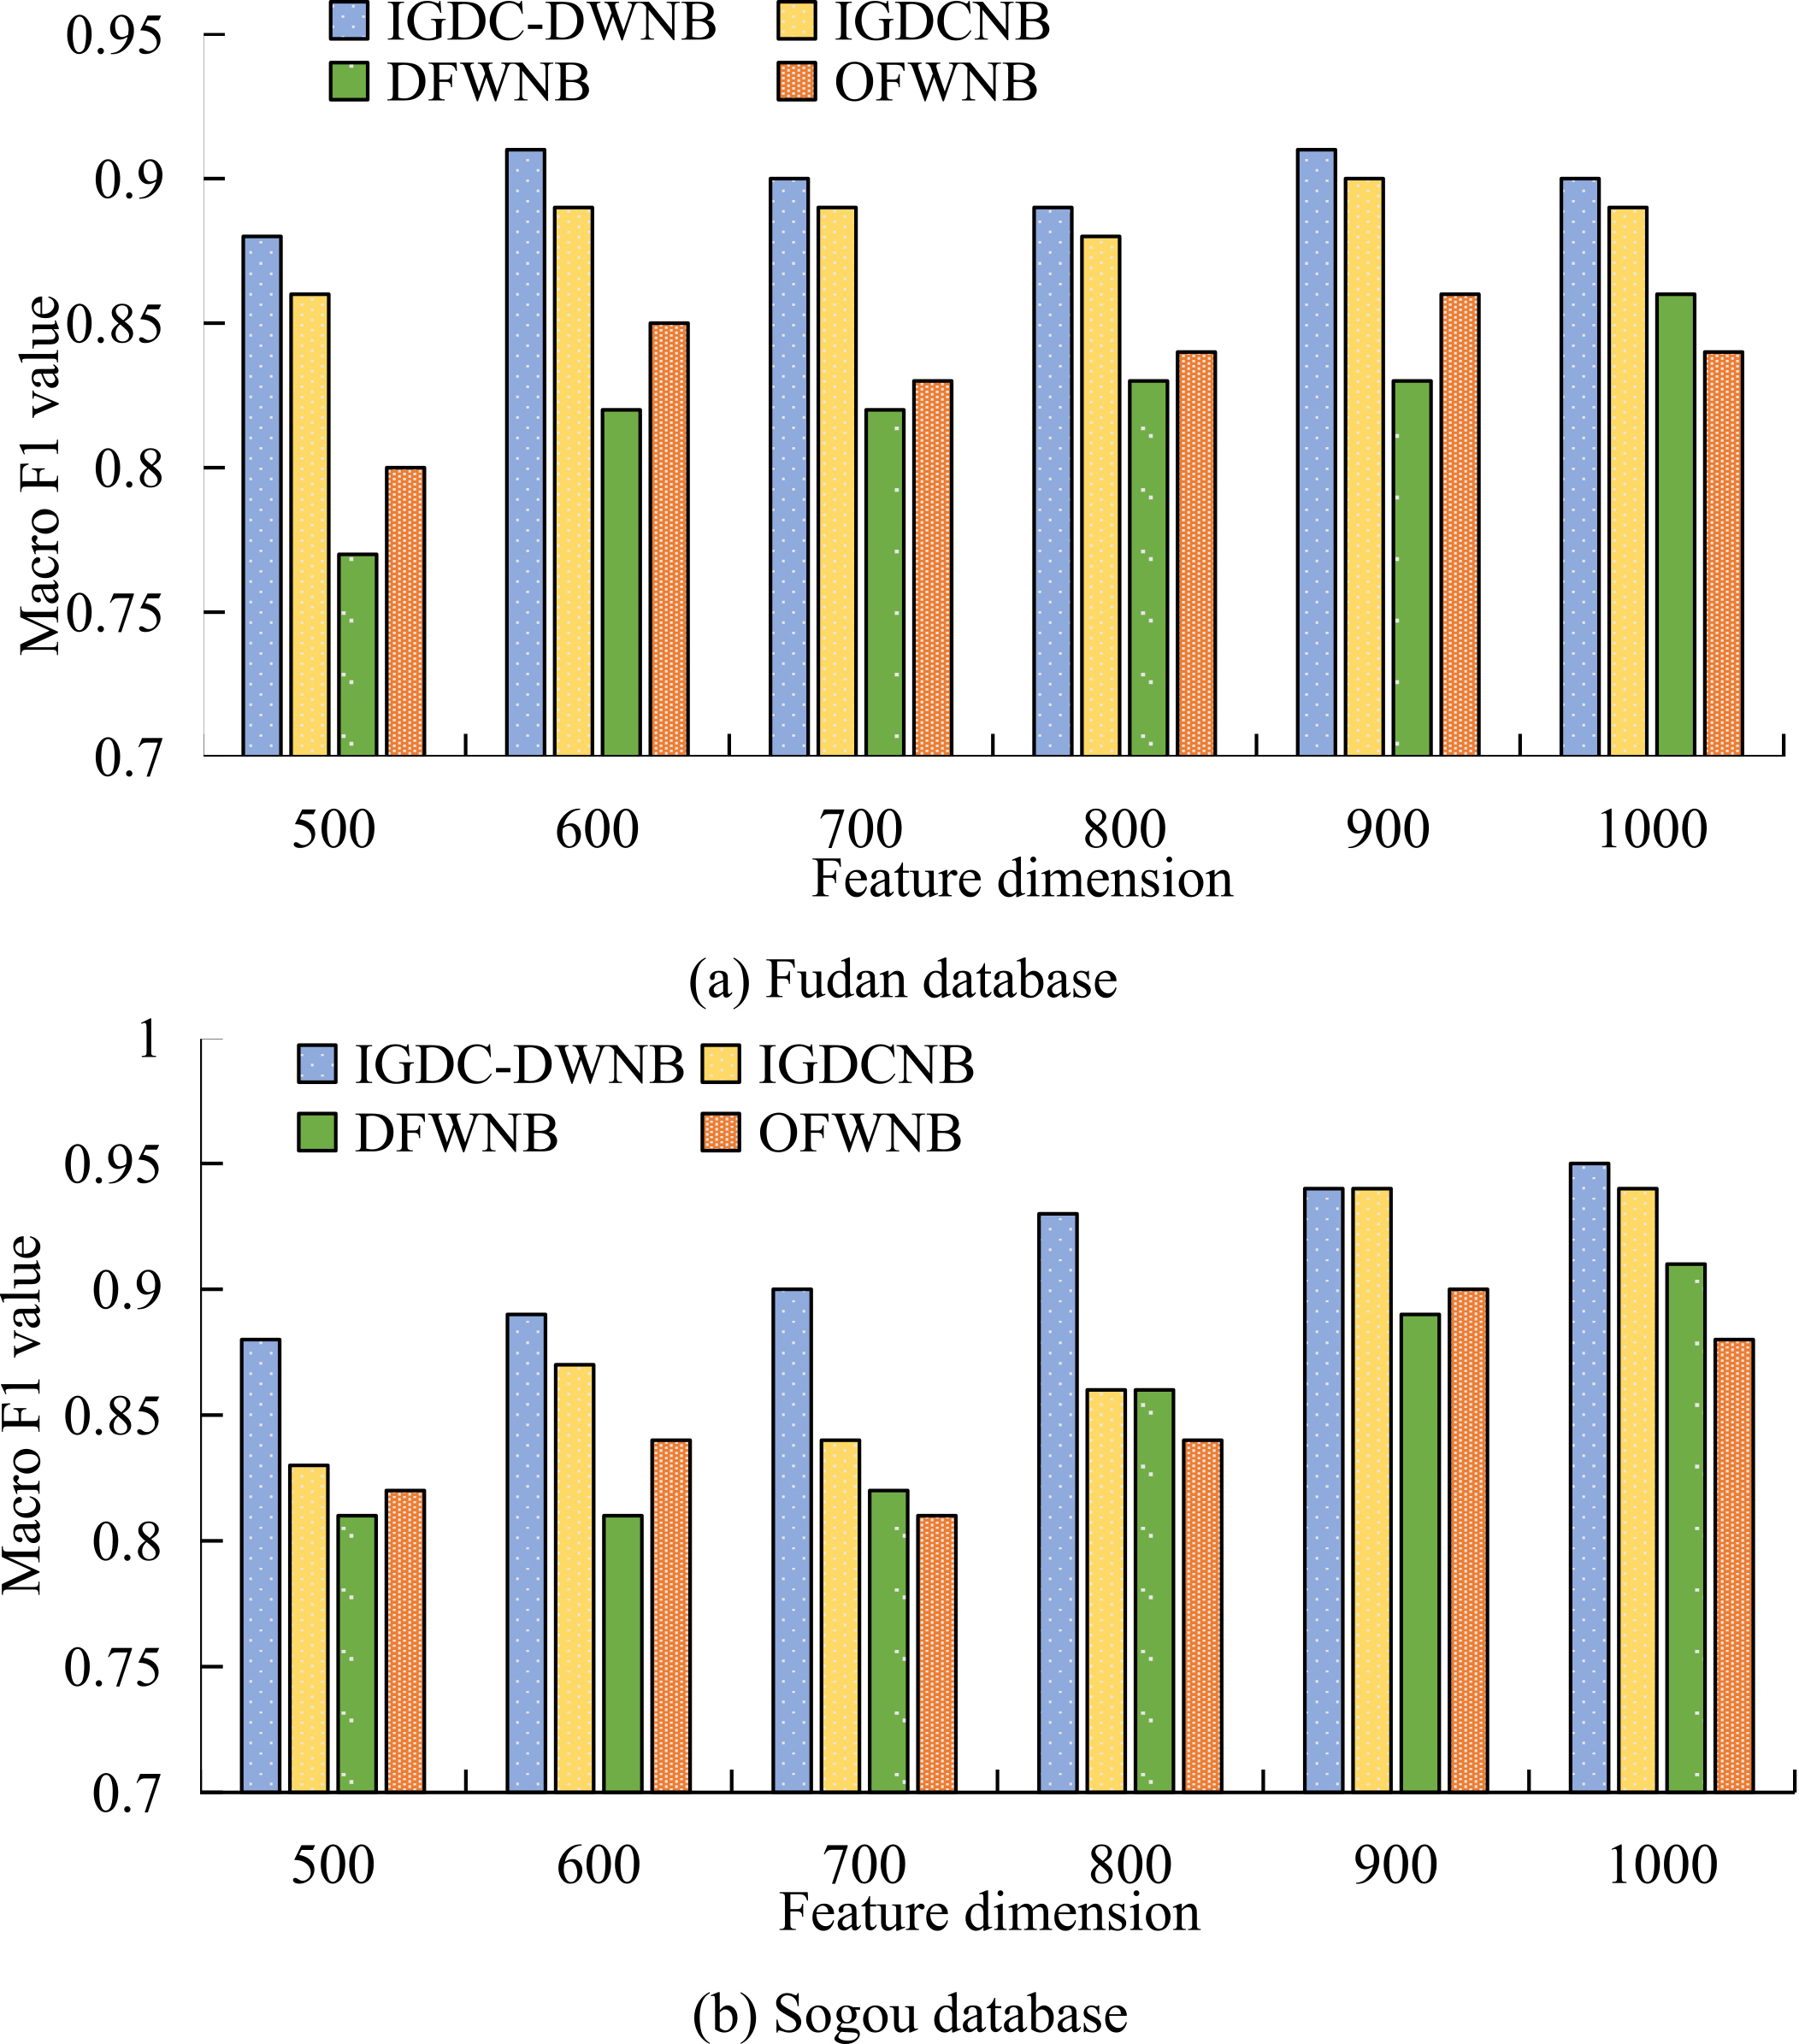
As can be seen from Fig. 6, in the Fudan database environment, the macro F1 value of the IGDC-DWNB model is relatively higher in the six feature dimensions, and this difference is more significant at feature dimension 500 and feature dimension 600, and the difference between the feature dimension 800 and the feature dimension 1000 is relatively slight. It can be seen that the performance of the IGDC-DWNB model in low dimensions is more obvious. In the Sogou database environment, the macro F1 value of the IGDC-DWNB model in the six feature dimensions is relatively higher, and the more obvious gaps appear at feature dimensions 500, 700, and 800, while the slighter gaps appear at feature dimensions 900 and 1000, it can be seen that the performance of the IGDC-DWNB model in this environment is also more obvious in low dimensions, which shows that this is the characteristic of the Chinese data environment.
The model comparison results in the English database environment are shown in Table 3.
Model comparison in English database environment
Model comparison in English database environment
As can be seen from Table 3, in the 20-newsgroup experimental database environment, the average accuracy of the IGDC-DWNB model is 0.93, the average recall rate is 0.93, the average F1 value is 0.92, and the overall maintenance is around 0.93; IGDCNB The average accuracy of the model is 0.91, the average recall rate is 0.93, and the average F1 value is also 0.91. The values of the three indicators are all stable at around 0.91. Compared with the IGDC-DWNB model, the overall The performance level is reduced by about 0.02 numerical points; the average precision of the FWNB model is 0.87, the average recall is 0.93, and the average F1 value is 0.86. The numerical differences of the three indicators are relatively large, but Basically maintained at 0.88, compared with the previous two models, the overall performance level showed a further decline, and the average value of two indicators failed to reach 0.90; the average accuracy rate of OFWNB model was 0.88, and the average recall rate was 0.89, the average value of F1 is also 0.87, the values of the three indicators are maintained at around 0.88, and the overall performance level is similar to that of DFWNB. In addition, in the Ruster 21578 experimental database environment, the average accuracy of the IGDC-DWNB model is 0.88, the average recall rate is 0.88, and the average F1 value is 0.87, which is maintained at about 0.87 as a whole; the accuracy of the IGDCNB model is The average value of the recall rate is 0.85, the average recall rate is 0.85, and the average value of the F1 value is also 0.84. The values of the three indicators are all stable at around 0.84. Compared with the IGDC-DWNB model, The overall performance level is reduced by about 0.03 numerical points; the average accuracy of the FWNB model is 0.81, the average recall rate is 0.80, the average F1 value is 0.81, and the values of the three indicators are basically maintained at around 0.80, compared with the first two models, the overall performance level shows a cliff-like decline; the average accuracy of the OFWNB model is 0.82, the average recall rate is 0.80, and the average F1 value is also 0.80. The values of the three indicators remain stable at around 0.81, and the overall performance level is similar to that of DFWNB. It can be seen that the IGDC-DWNB model also reflects its own more excellent model performance in the English database environment, and can perform higher accuracy and more efficient classification in practical applications. In the English database environment, the macro F1 value comparison of the four models is shown in Fig. 7.
Macro F1 values of four models in two English database environments.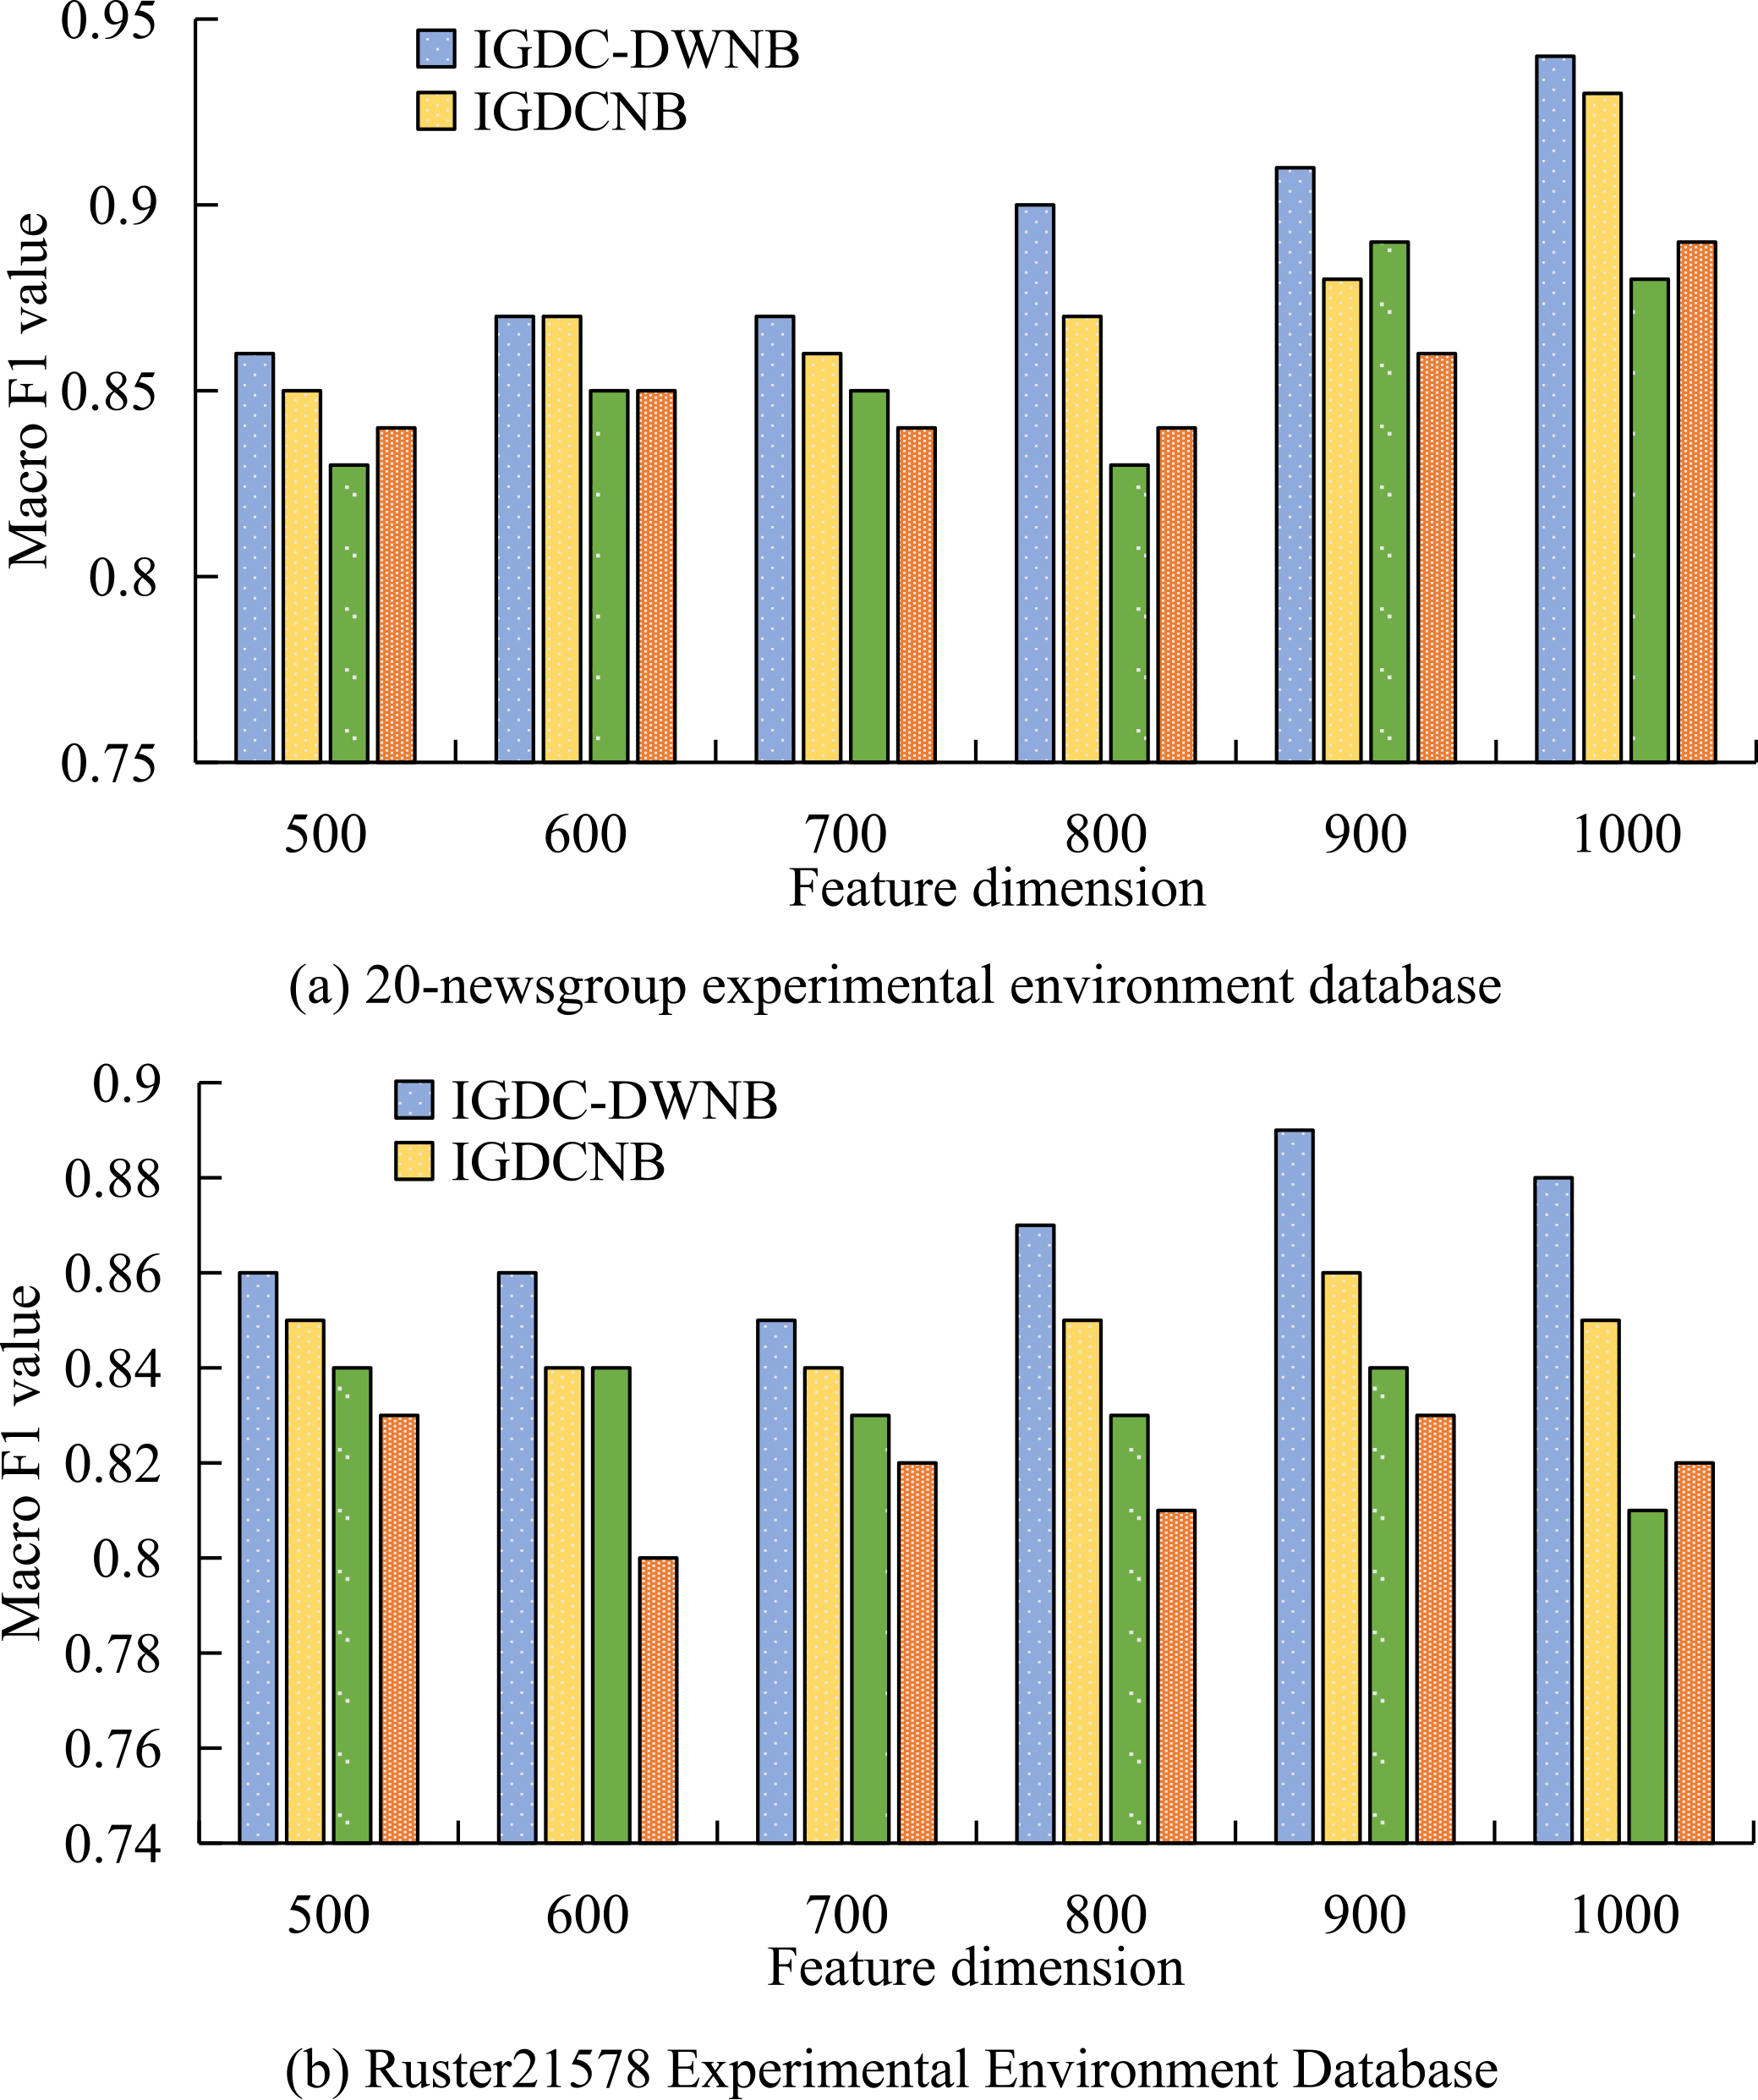
As can be seen from Fig. 6, in the 20-newsgroup environment, the macro F1 value of the IGDC-DWNB model is relatively higher in the six feature dimensions, and this difference is more significant when the feature dimension is 800 and the feature dimension. 1000, while the difference in feature dimension 500, 600, and 700 is relatively slight. It can be seen that the performance of the IGDC-DWNB model in this environment is more obvious in high dimensions. In the Ruster21578 environment, the macro F1 values of the six feature dimensions of the IGDC-DWNB model are relatively higher, and the more obvious gaps appear in the feature dimensions 800, 900 and 1000, while the slighter gaps appear in the features Dimension 500 and 700. It can be seen that the performance of the IGDC-DWNB model in this environment is also more obvious in high dimensions. It can be seen that in the English data environment, the performance of the model in high dimensions is stronger. Compared with other researches, the model designed in this paper also has higher universality and performance stability. Xing and Bei [26] proposed an intelligent classification model for medical and health big data based on improved KNN algorithm. The model uses weight classification for each classification to improve classification efficiency. Research results show that the model has good classification effect in medical data. The classification model designed in this study is not aimed at the subdivision field, but the mixed type big data classification in the universal field. The research results show that the model designed in this study has higher accuracy in the advanced models of the same type, which can ensure the stability of classification performance while maintaining universality. Boyapati et al. [27] designed a big data classification model based on support vector machine, which can play a strong classification ability in both commercial and medical data sets. This research selects the Bayesian algorithm which is more robust than the support vector machine and has more stable classification efficiency as the basis, and improves the design to IGDC-DWNB model. The results show that the model designed in the research is at F1 value. Both accuracy and recall rate have strong advantages. Lakshmanaprabu et al. [28] designed a health big data classifier of the Internet of Things based on a random forest network, studied and improved the random forest algorithm using listening algorithm, and the designed model passed the validation. This research also uses the improved method, and uses the feature two-dimensional information gain weighting method to improve the naive Bayesian algorithm. The improved big data classification model has stronger classification ability and is more stable than the advanced models of the same type. In general, the IGDC-DWNB model studied and designed has stronger classification performance in data classification, and has stronger robustness and stability in practical applications.
Accurately extract and classify Internet text data information with high propagation speed and high update speed, the research starts with the depth weighting method, combines the naive Bayesian algorithm with the feature two-dimensional information gain weighting method, and improves the classification performance of the model through the depth weighting method to achieve better big data classification effect. Finally, the model is applied to both Chinese and English. Compare and analyze data sets with different characteristics with other classification models. The research results show that the classification accuracy rates of the IGDC-DWNB model in the Sogou experimental environment database, the 20-newsgroup experimental environment database, the Fudan experimental environment database and the Ruster21578 experimental environment data are 0.89, 0.89, 0.93, and 0.88 respectively, and the recall rate is 0.89, 0.89, 0.93, and 0.88. were 0.90, 0.93, 0.93, and 0.88, respectively, and the F1 values were 0.89, 0.94, 0.92, and 0.87, respectively. Compared with the other three classification models, the model designed in the study was stable and obvious in classification accuracy, recall, and F1 value. This shows that the model designed in the study has stronger classification ability in big data classification, can achieve accurate classification and high-quality classification in different data set environments, and has stronger robustness and stability in practical applications. Compared with other weighting algorithms, the depth weighting method proposed in the study has been greatly improved. However, the research is based on the assumption that the data is complete, and there will inevitably be missing and unavoidable redundant information in the actual application. Therefore, it is necessary to further solve the classification of incomplete data and effectively remove redundant information. In the experiment, only three datasets are used for comparative analysis of the experimental results. In order to prove the effectiveness and feasibility of the model, more datasets should be used for experiments and comparison with other methods.