



Abstract
This paper investigates the feasibility of constructing power-consumption-based sensors for the identification of security threats (e.g. battery-drain attacks) on Android based mobile devices. In particular, this paper proposes a measurement methodology and high-level models for the energy consumption of two very important hardware subsystems in a mobile device, namely the Wi-Fi and the CPU. The measuring methodology and the high-level models are then compared to others described in the literature and validated through actual experiments. Finally, the proposed methodology is tested with an energy oriented variant of the ping-flood attack performed while a legitimate application is running. Experimental results show that the measurement methodology is sound, precise and reliable in detecting the onset of an attack.
Keywords
Introduction
Recent years have witnessed a growing adoption of mobile devices at the expenses of traditional laptop and desktop PCs.1
All of these motivations have fostered the idea of profiling malware in terms of their energy consumption, in order to improve the traditional malware detection by means of a new energy-based characterization of malicious activities. This idea is at the basis of the emerging Energy-Aware Intrusion Detection Systems (EA-IDS) [6] that operates on the basis of energy-based footprints of both legitimate applications and malware. In this respect, EA-IDSs are expected to support the detection and the recognition of battery drain attacks, as well as to constitute a new kind of sensor for early spotting of anomalous behaviors in mobile devices. Differently from Battery-Based IDSs [9] (B-BIDS) that are basically aimed at profiling global energy consumption and raising warnings in case of deviation of the actual consumption from the normal one, EA-IDS are expected to operate both at a more fine grained level of details and also in a signature-based manner, thereby allowing to recognize both the source (i.e. the process or the application) of the attack and, as much as possible, the kind of malware from its energy footprint.
In order to implement effective EA-IDSs in the foreseeable future, solutions to build up reliable energy footprints must be developed. To this aim, in this paper an approach that allows obtaining with a good level of precision the global energy consumption of on-going activities on a mobile device is proposed. Furthermore, the proposed solution is based on two models that allow isolating the Wi-Fi and CPU contributions from the global energy consumption, as a step toward the goal of being able to build up precise and fine-grained energy footprints of legitimate applications and known malwares. To test the proposed approach a new energy focused variant of the ping-flood attack is devised. The experimental results show that the proposed solution is viable to build reliable energy footprints for EA-IDSs.
This paper extends the work in [6] in several ways:
a new middle level way of measuring the power consumption is proposed and experimentally validated; a new form of the ping-flood attack modulated to focus on accelerating battery depletion without encroaching application level functionality of the system is introduced; a new model for profiling energy consumption of the CPU component is proposed; the original Wi-Fi power consumption model is refined by taking into account the CPU component of the global power consumption; through experiments and measurements, the CPU model parameters are defined for a specific mobile hardware; a Wi-Fi power consumption model based on number of bytes transmitted at internetworking level and application level is defined; the CPU power consumption model previously defined and validated is used to compute the values for the Wi-Fi per-byte power consumption; the per-byte power consumption model is experimentally validated.
The paper is structured as follows: in Section 2 the related work is described; in Section 3 the modulated ping flood attack is introduced and different approaches for measuring the power consumption on mobile devices are critically discussed, showing the inadequacy of the existing proposals as a basis for building reliable energy footprints to be used in EA-IDS. Then, a new approach (middle level measurements) is introduced and its reliability is experimentally assessed. Section 4 describes two kind of consumption models: (i) a general one aimed at modeling the global energy consumption of a mobile device and (ii) a set of specialized models for single hardware subsystems, i.e., the Wi-Fi and the CPU. Such models are applied to build up energy footprints of activities on mobile devices by means of middle level measurements. Section 5 details the experiments adopted to validate the models and shows that the modeled results are close to the actual measurements. Finally, Section 6 discusses the results and provides some concluding remarks.
In order to devise a methodology capable of reliably detecting malware and security threats through their power consumption, it is necessary to analyze how energy consumption may be measured on mobile devices. As showcased in [5], hardware support in Symbian based mobile phones allowed to easily obtain fine-grained power consumption measurements. However, such a support is not available in Android, and new techniques need to be devised. Thus, this section is dedicated to the study of past related work and different methodologies to measure energy consumption. Furthermore, an evaluation of how these methodologies suit the task of building a database of the energy footprints of both legitimate and malicious activities on Android devices is performed.
Recently, the problem of malware detection on mobile devices has been tackled by means of several OS-specific solutions. A first example of this kind of solution is described in [2], where the authors suggest a malware detection tool based on specific code-signature recognition; however, this approach does not leverage to any extent the power consumption induced by the malware and does not use any form of energy-related recognition of attacks. In [21] and [11] solutions that are specific to the Symbian and/or Windows Mobile OS are described, and the authors of [11] also briefly discuss energy-related malware.
The work in [6] and [26] describes a model for the energy consumption of a mobile device; however, while the first work targets security issues, the second one, as shown in [23] and in [19] mainly targets general purpose energy consumption measurements. Furthermore, the fact that successfulness in profiling the energy consumption of activities depends on the capability to perform measurements that (i) separate the components deriving from different hardware subsystems (e.g. GPS, Wi-Fi, 3G, CPU, …) and (ii) achieve a sufficient level of precision, is showcased.
Hence, it is possible to identify several solutions to the problem of modeling and measuring the energy consumption of Android-based devices. Albeit an official classification is still missing, it is possible to classify current solutions according to three metrics: (i) adopted measurement tools, (ii) invasiveness of measurements in the Android stack and (iii) use of collected data.
Distinguishing solutions according to the first metric, it is possible to separate measurements collected using internal hardware (i.e. relying on the device instrumentation) from the ones collected by means of external hardware (based on ad-hoc hardware connected to the device). The level of precision that can be obtained with internal hardware based measurements is generally lower than the one that can be obtained leveraging dedicated external hardware. However, the introduction of external hardware severely reduces the usability of the device as it may seriously limit its mobility.
In the analysis of the invasiveness of the measurements, it is possible to notice that the different layers of the Android stack may provide information both to internal and to external measurement tools. In fact, energy consumption data can be obtained through dedicated APIs (high level measurements) or introducing custom probes in the battery driver and the Linux Kernel (low level measurements). Once again it is possible to notice a trade-off between precision and ease of use; in fact, high level measurements are usually more coarse-grained and less precise, however, contrarily to low level ones, they do not require introducing modifications in the Android stack.
Taking into account the third of the above mentioned metrics, the data obtained can be processed on-device, i.e. directly on the device, or delivered to an external server for off-device analysis. On-device analysis is usually performed by specific applications (e.g. applications trying to enhance battery duration) and is usually limited to the single device. Sending the data off-device to external servers allows collecting data from several devices and thus it may be used to generate more statistically significant data sets. It is important to notice, however, that off-device measurements are severely limited if they have to be used as security support since the collection of data may be easily denied by the attack itself.
The authors in [7,16,24,26] propose four different internal measurements approaches. Zhang et al. [26] introduce PowerTutor, an Android application that provides an on-device estimate of the actual device power consumption; this estimate is derived from high level models of a subset of the device hardware components. More in details, PowerTutor injects high-level usage data of the mobile device hardware components into its models to derive the energy consumption; however, the resulting measurements are very coarse-grained and, as it will be shown in Section 3, they are not up to the task of identifying security threats. A very similar approach is also used in [10].
Sesame [7] proposes to have mobile devices performing self-modeling to automatically generate their consumption profile. This task is performed by collecting data at low level (i.e. directly from the battery driver) and by means of on-device analysis. This work clearly shows that, in order to achieve a good level of accuracy in power consumption modeling, it is necessary to take into account the characteristics of the specific device and to calibrate the models for it. Besides, it describes some techniques that allow reducing the measurement errors of internal hardware such as the Coulomb counters of smartphones batteries.
The AppScope tool [25] provides low-level energy consumption measurements; unfortunately, it is not open source and is hand-tailored to a single model of mobile device (the Google Nexus One). Furthermore, AppScope adopts a mechanism for consumption analysis measurement that, because of its usage of static references inside the kernel, is strictly tied to a single device model. These facts make it extremely difficult to replicate the results and to use the tool on different devices; thus it is not possible to perform a general evaluation of the precision of the measurements.
The work in [12] describes an internal low-level approach to energy consumption measurements that introduces the concept of event-driven sampling as opposed to the synchronous nature of all other measuring tools. Nonetheless, the framework requires extensive instrumentation of the lowest levels of the Linux kernel and is thus extremely invasive.
A completely different approach is the one showcased in [18]. In this work, the authors adopt a statistical, crowd-sourced approach to the problem of identifying energy-expensive applications and behaviors in users’ devices. The authors claim a very high level of precision with no identified false positive cases. However, their approach is based on the statistical comparison of the behavior of applications on large sets of devices, thus it will not be able to provide prompt alarms for new malware.
Most of the previous solutions have been designed with the goal of allowing green computing and enhancing battery life; to this end, they provide support to the task of evaluating the global energy consumption of mobile devices to allow reducing it. On the contrary, the support given to the task of identifying security threats is minimal to non-existent.
In [13] the authors describe how to identify three different kinds of attacks in terms of energy footprints. However, the procedure described relies completely on ad-hoc external hardware, thus the proposed approach has a very limited usability in mobile devices that are actually deployed on the field.
To overcome the above mentioned limitation, it is necessary to rely on internal, on-device measurements at a sufficiently fine-grained level, in order to support effective energy-based profiling and detection of malicious behavior.
In this respect, the profiling method proposed in [6] adopts low level measurements that are sufficiently fine-grained to detect malicious behaviors; nonetheless, such approach requires customization of the specific battery driver and is extremely invasive with respect to the Android stack.
This paper proposes and adopts energy-related measurement at a different level of abstraction in Android. The aim is to find out a better trade-off between (1) measurements precision and (2) effective energy-based profiling of malicious applications.
Furthermore, this paper shows that it is possible to spot the presence of a malicious behavior in an Android device by means of the energy consumption it produces.
A database of the energy footprints of malicious applications together with a methodology to gather accurate measurements of power consumption would allow enhancing the current generation of EA-IDSs with sensors capable of recognizing malware by taking into account their energy footprint.
The detection of malware based on energy consumption has been already proposed in the past. For instance, an attempt to enhance threat detection by means of energy consumption measurements is described in [1]. The authors describe what they define a Battery-Sensing Intrusion Prevention System (B-SIPS), that is, as the authors say, a non-conventional intrusion detection system capable of detecting threats that are not visible to standard anti-malware systems. They focus on network-centric groups of mobile devices and on attacks adopting as a vector either IEEE 802.11 (Wi-Fi) or IEEE 802.15.1 (Bluetooth). The contribution that differentiates this work from the EAS-IDS is the fact that the mobile devices on top of which the B-SIPS is running are not considered as stand-alone devices to be defended, but they are, instead, the sensors of a distributed intrusion detection system dedicated to the discovery of attacks taking place in the network where the nodes are inserted into. Another approach to energy-based detection is proposed in [17]. Here, authors provide a framework that analyzes energy consumption in HP IPaQ devices to detect anomaly caused by malware using a linear regression applied to the energy consumption measurement provided by single hardware components. The limitation of this approach is that it is able to recognize attacks coming from a single process only. If the attack is carried out through several processes at once, the IDS is unable to recognize it. A different approach to IDS on IPaQ devices is proposed in [11]. Here, single energy measurements are compared using the
Introducing middle level measurements
In this section, the effectiveness and intrusiveness of two different measuring methodologies for the energy consumption on Android devices are analyzed. Then, the suitability of such approaches for EA-IDS is evaluated in terms of fitness to the task of discriminating the presence or absence of an example attack. The attack adopted is based on the common ping-flood, but the amount of traffic generated is modulated to avoid becoming visible at application level as a denial-of-service for the network interface.
This modification is introduced to focus the attack on its capability to accelerate the depletion of the device battery instead of using it to prevent network access. This same modification has also the effect to make it invisible at application level, as a matter of fact in the experiments the execution of a legal, network dependent application, namely Skype, is not disturbed.
The first methodology is general purpose, while the second one has been devised from the very beginning with the goal to spot security threats in mind: this clearly puts the second methodology at an advantage. Nonetheless, some limitations will be identified in this second approach too thus a third solution will be suggested and its soundness experimentally evaluated.
This study will adopt an application and an attack whose combination can generate power consumption through: (i) Wi-Fi, (ii) CPU, (iii) screen and (iv) audio only, while it makes no use of either GPS or 3G network. More in details, a Skype call and a ping-flood attack over Wi-Fi will be used in combination. During experiments, the mobile device has been put as much as possible in a state in which the activities generating power consumption are exclusively the ones taken into account, i.e. the legitimate application (namely the Skype call), and the security threat (namely the ping-flood attack). This has been achieved stopping all other applications and reducing as much as possible the activities performed by the Android OS. This said, it is nonetheless important to notice that it is impossible to completely reduce the consumption of the OS to 0 and that this fact impacts measurements to some extent. The actual extent of this impact is discussed in the following paragraphs.
A Skype call implies the bi-directional transmission of audio and video streams between two devices. During the experiments, variable video and audio traffic is generated to prevent Skype from applying extreme bandwidth optimizations performed by Skype during the transmission (i.e. completely avoiding sending video data if the image is still and audio data for silence suppression).
The ping-flood attack is performed by an external PC connected on the same subnet of the mobile device. During the attack, a continuous stream of ICMP packets is sent to the Wi-Fi interface of the device. The number of packets sent is modulated to avoid the complete saturation of the network interface itself so that the increase in the traffic level cannot be directly perceived at application level.
The experiments performed are similar to the one described in [6] but the more subtle and energy oriented variant of the ping-flood is adopted. From the hardware point of view, all the experiments use an HTC Desire smartphone equipped with a SEIDIO battery, P.N. BASI16HNX1, 1600 mAh capacity, together with two PCs. The PCs have been used both to perform the ping-flood attack and to act as the second Skype-call endpoint. The timings of the experiments are as follows: first at
In the experiments, only the CPU and the Wi-Fi hardware subsystems have been taken into account as sources of power consumption, i.e. Screen, Cellular radio, GPS, Flash memory, GPU, Bluetooth, and Audio amplifier contributions to the power consumption have been assumed negligible. This assumption is realistic because: (i) the screen, the 3G network, the Bluetooth and the GPS are kept switched off, (ii) no file is read during the experiment and the measurements are written to the file system only at the end of the experiment, (iii) no graphic processing is involved and (iv) the amplifier volume is turned to zero.
High level measurements (HL). The first methodology adopts a high-level approach where hardware resource usage counters are injected into power consumption models. This high-level approach allows separating the contributions of different hardware components simply by defining an appropriate power consumption model for each one and gathering resource counters for each of them. This approach clearly has the advantage of allowing separating the contributions of different hardware components inside the global power consumption (separation of the power sinks) without requiring special measuring hardware for each component. However, this approach does not provide an actual measurement of the power consumption, but, on the contrary, it builds up an estimate whose level of precision depends strictly from the accuracy of the models adopted for the different power sinks; furthermore, the model parameters need to be either retrieved from the component datasheet or experimentally evaluated once for each specific hardware device. To exemplify this approach, in this paper PowerTutor [26] will be adopted as a case study implementation.
PowerTutor identifies six different power sinks, namely CPU, Wi-Fi, Display, 3G radio, GPS and Audio. It reads hardware components activity states from the /sys device file system and uses these values to modulate the sum of estimated levels of consumption for each different hardware component state. The measurement performed by a so-called profiler service are recorded and stored on the device and an application may chart them in different graphical displays. However, the profiler also sends all the recorded data to the PowerTutor research group to allow aggregated profiling of devices (i.e. off-device analysis).
PowerTutor adopts a simplistic energy model for the hardware components it takes into account. The consumption due to the device screen is estimated as a constant base consumption summed to a value linearly multiplied by the brightness level of the screen; this may provide rather accurate results in the case of LCD screens, but it provides completely meaningless results for a screen based on AMOLED technology where, as clearly shown in [8] and [22] the energy consumption depends on the colors displayed; in fact, while a totally dark LCD screen is obtained by masking the backlighting, a dark AMOLED screen actually avoids emitting light. In the case of the audio device, the consumption is simply an on-off value with no dependency on the actual amplifier level.
To model the power consumption of the CPU, PowerTutor assumes a linear relation between the level of CPU utilization and the current clock frequency; this introduces a large estimation error as it does not take into account the hysteresis present in most modern mobile CPU schedulers. Furthermore, only the most expensive power state (C0) is taken into account; this assumption, though, is made true by the fact that the very presence of the profiling demon prevents the CPU from getting into any deeper power saving state.
HL: energy footprint of the Skype call and the ping-flood attack.
HL: energy footprint of the Skype call and the ping-flood attack.
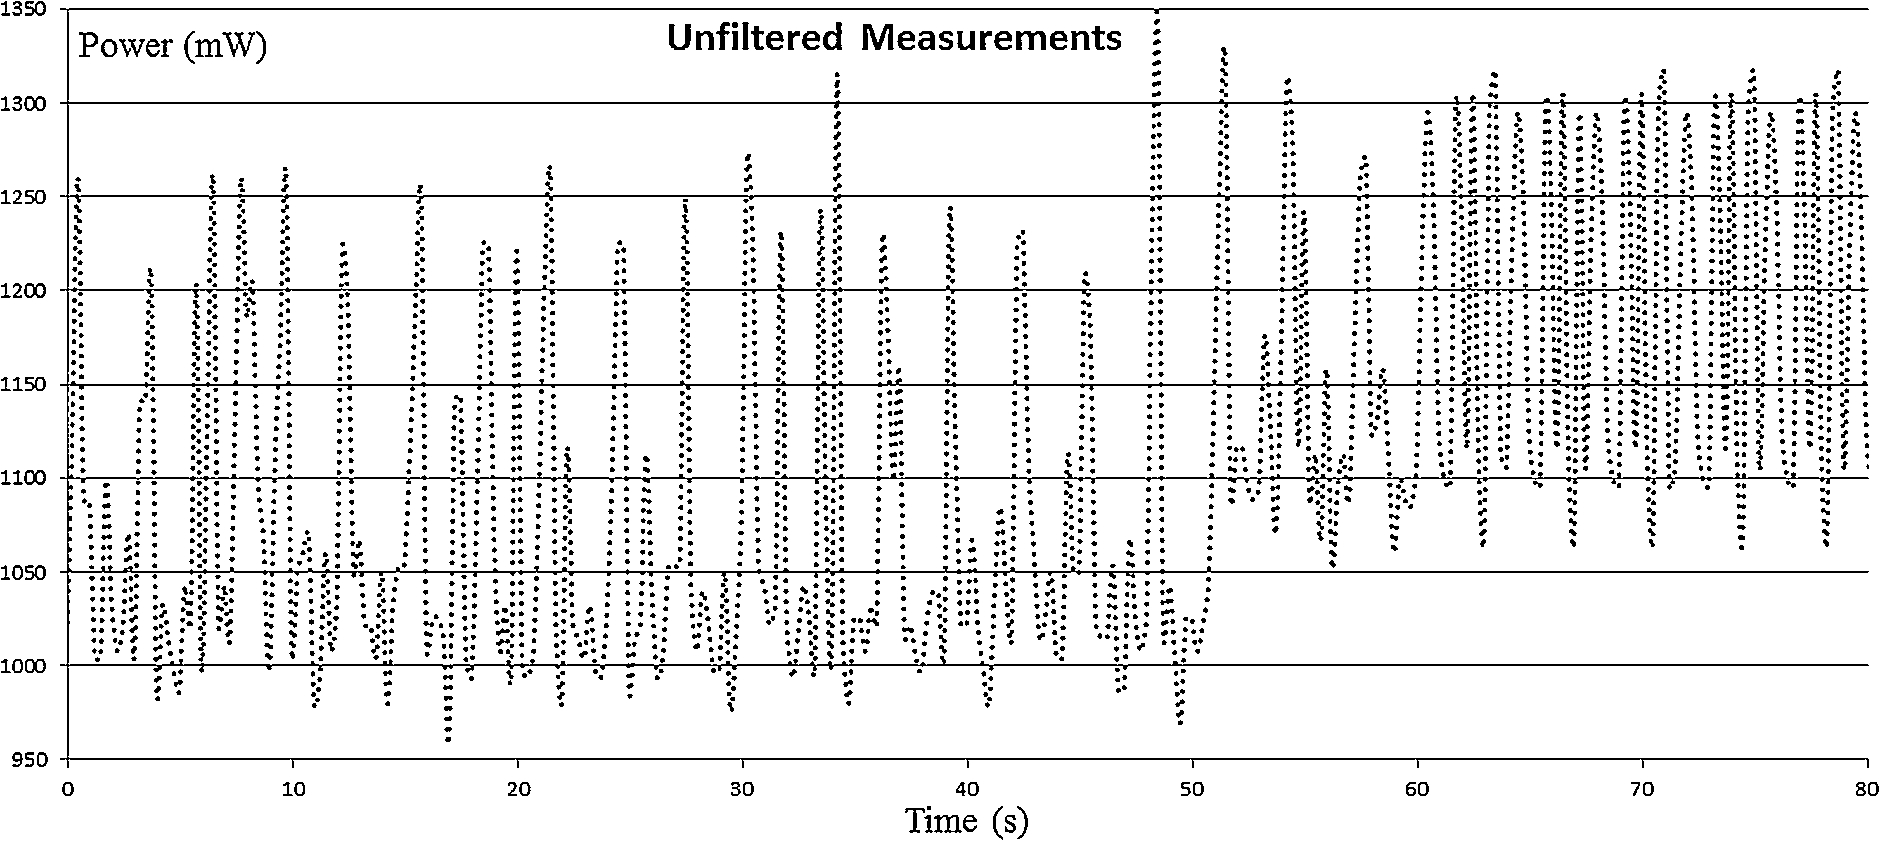
LL: direct measurements of the current during the Skype call and the attack.

LL: different sliding windows (1 s and 5 s) used to compute the average over the measurements of the current during the Skype call and the attack.
For the Wi-Fi module, PowerTutor considers the channel rate and data rate of the uplink together with the number of packets transmitted per second. These three parameters are used to generate a linear interpolation between minimum and maximum power consumption.
The GPS takes is modeled on the basis of three power states, namely off, sleep and on; a constant power consumption value is associated to each one and integrated over time to generate the final estimation.
The 3G network model first considers the presence or absence of a data connection, then the type of data connection (UMTS or HSDPA) and finally uses the current type of channel (namely idle, fach and dch) to select among three different energy values. The estimate transitions among these idle and active states on the basis of the amount of traffic registered by the interface; the power consumption values associated to the different states are then integrated over time to generate the final estimation.
As it can be easily seen, the energy modeling provided by PowerTutor is rather simplistic and the measurements tend to be excessively coarse-grained to be useful for security purposes; in fact, as Figs 1 and 2 clearly show, the measurements do not capture any energy consumption anomaly and a brute-force based threat such as a ping-flood starting at T equals to 50 seconds goes completely undetected.
Low level measurements (LL). In [6] the authors describe a completely different approach where measurements are taken directly from the battery achieving high precision while sacrificing the capability to distinguish among the different energy sinks.
More in details, a patched version of the AB8500 driver is used to gather the values of current and voltage currently provided by the battery. These values are sampled at 4 Hz by means of a demon service. For the sake of this paper, the experiments have been repeated on the HTC Desire to provide uniform results hardware-wise.
The level of precision achieved with this approach is very high. However, this very precision turns out as a limitation as it tends to follow short transitory in the device masking more significant but slower power consumption trends. In fact, the onset of the ping-flood attack is rather hard to detect in the unprocessed data (see Fig. 3).
In order to ease the detection it is necessary to apply a sort of temporal low-pass filter in the form of the average over the values of a sliding window. Obviously, this kind of low-pass filter introduces a level of latency in the detection of events; however, it greatly enhances the result. In Figs 4 and 5 it is possible to observe the effects of a 1 second, 5 seconds, 10 seconds and 20 seconds sliding window over the raw data. As an efficient trade-off between the capability to reveal trends and the introduction of latency in detection, a 10 seconds sliding windows has been selected and it will be used in the graphs shown in the remaining part of this subsection.
In Fig. 6 it is possible to observe that, adopting the previously described smoothing technique, the power consumption caused both by a Skype call and the ping-flood attack by itself is rather stable.
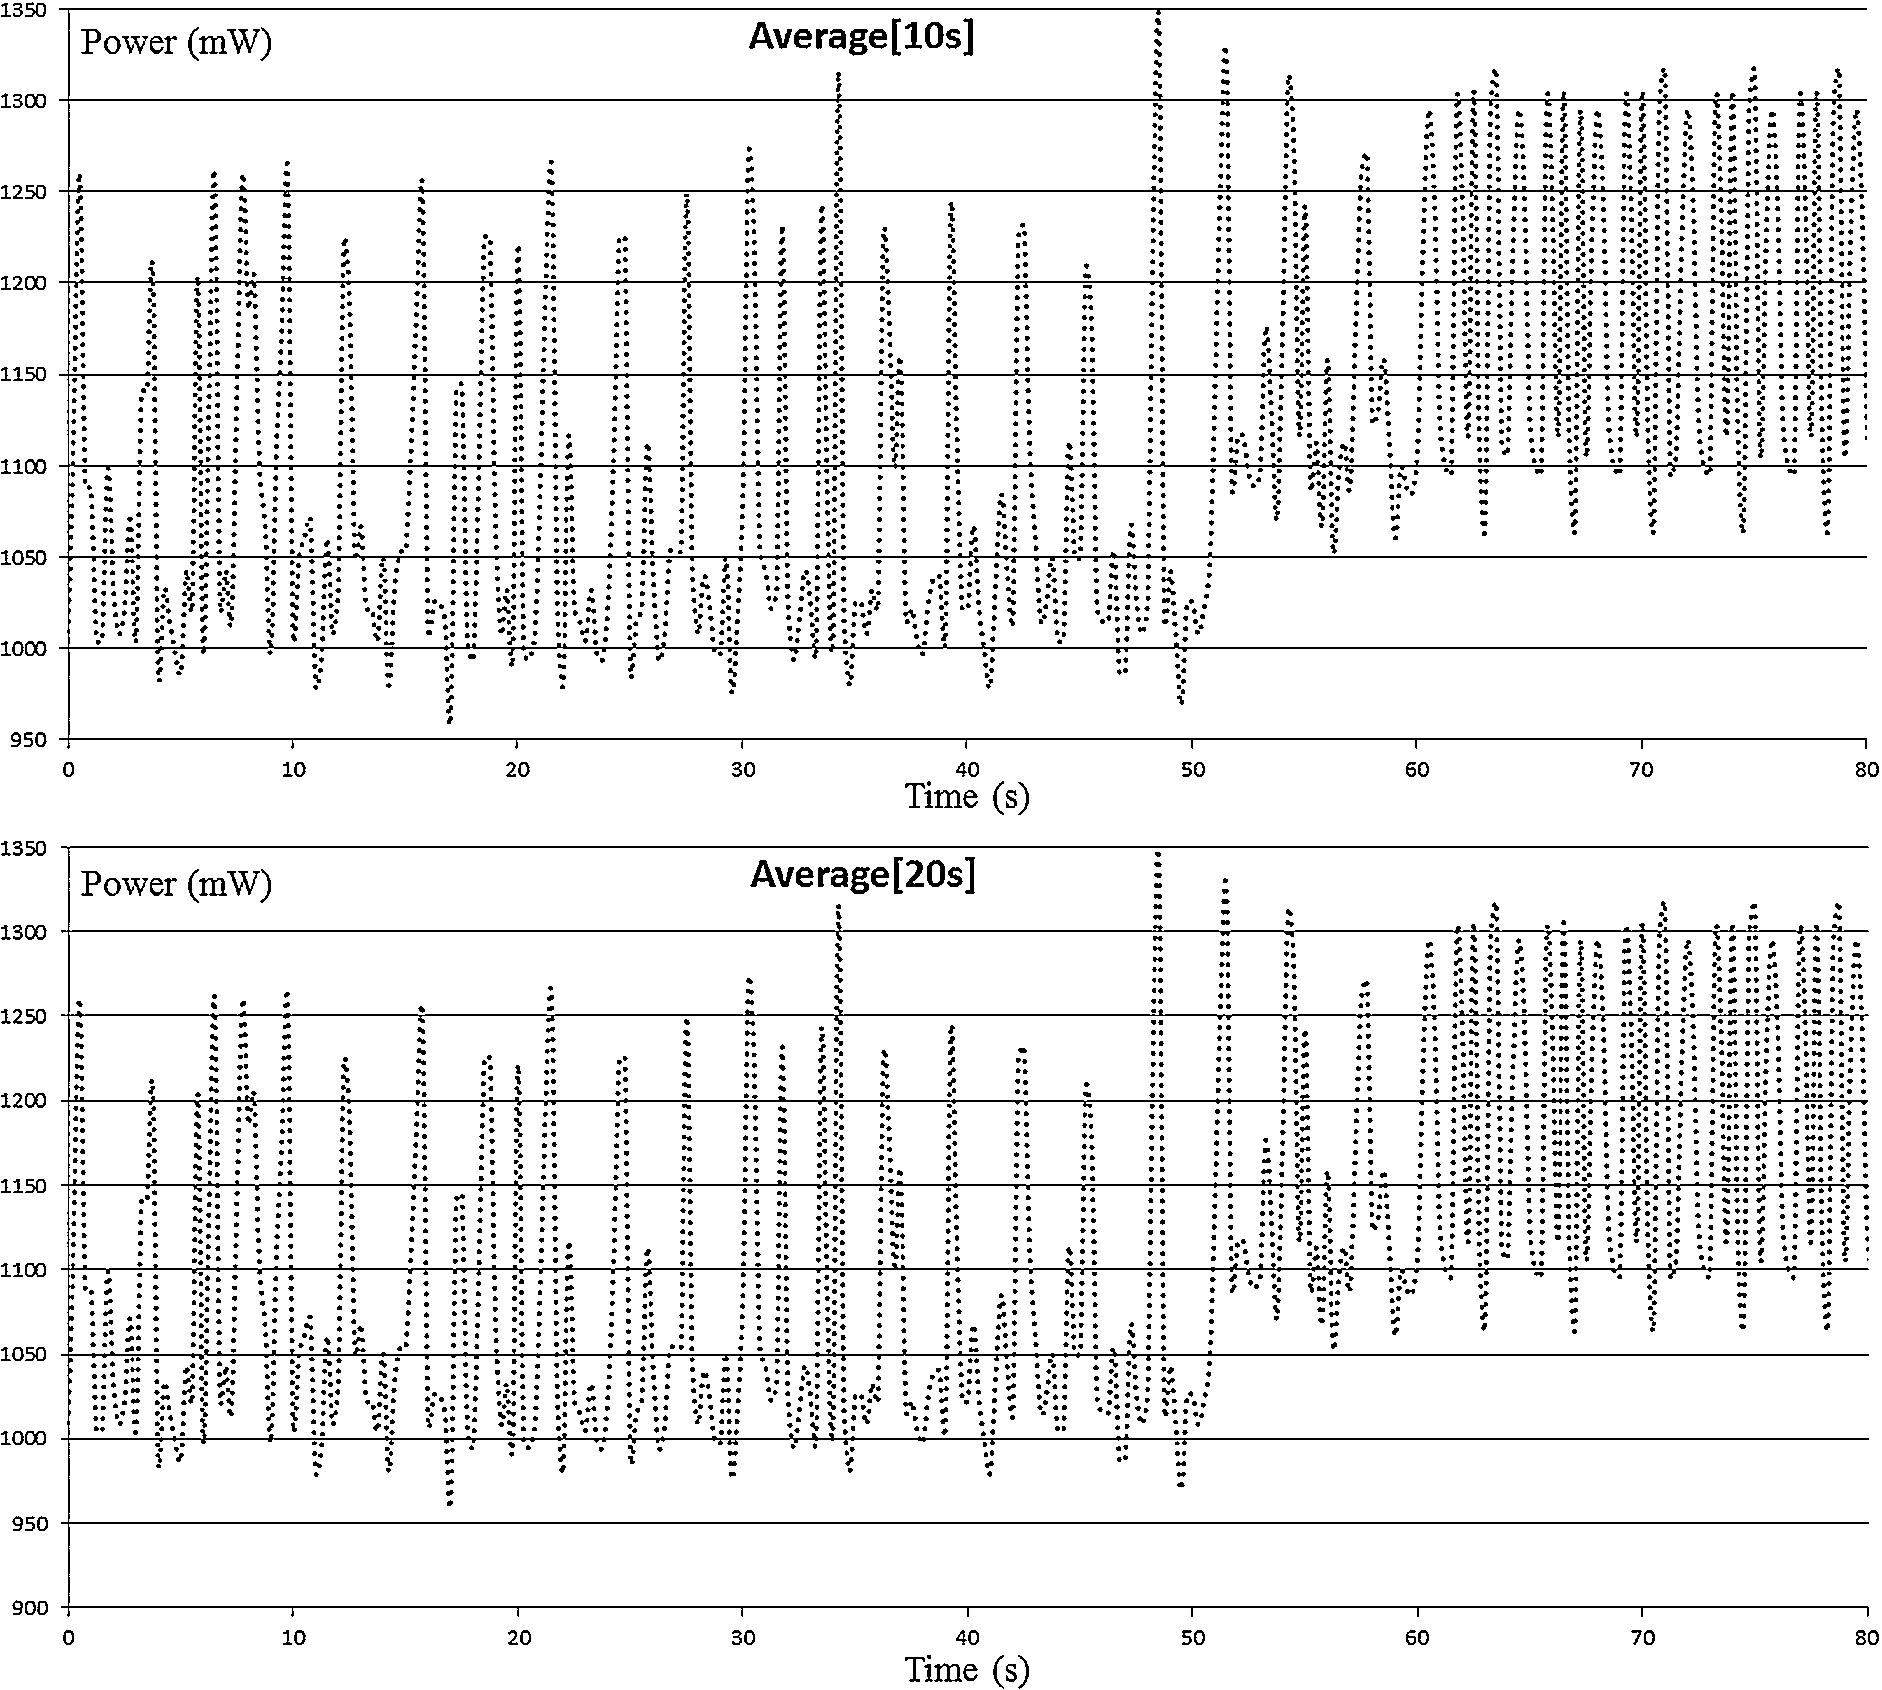
LL: 10 s and 20 s sliding windows.

LL: energy footprint of the Skype call and the ping-flood attack.
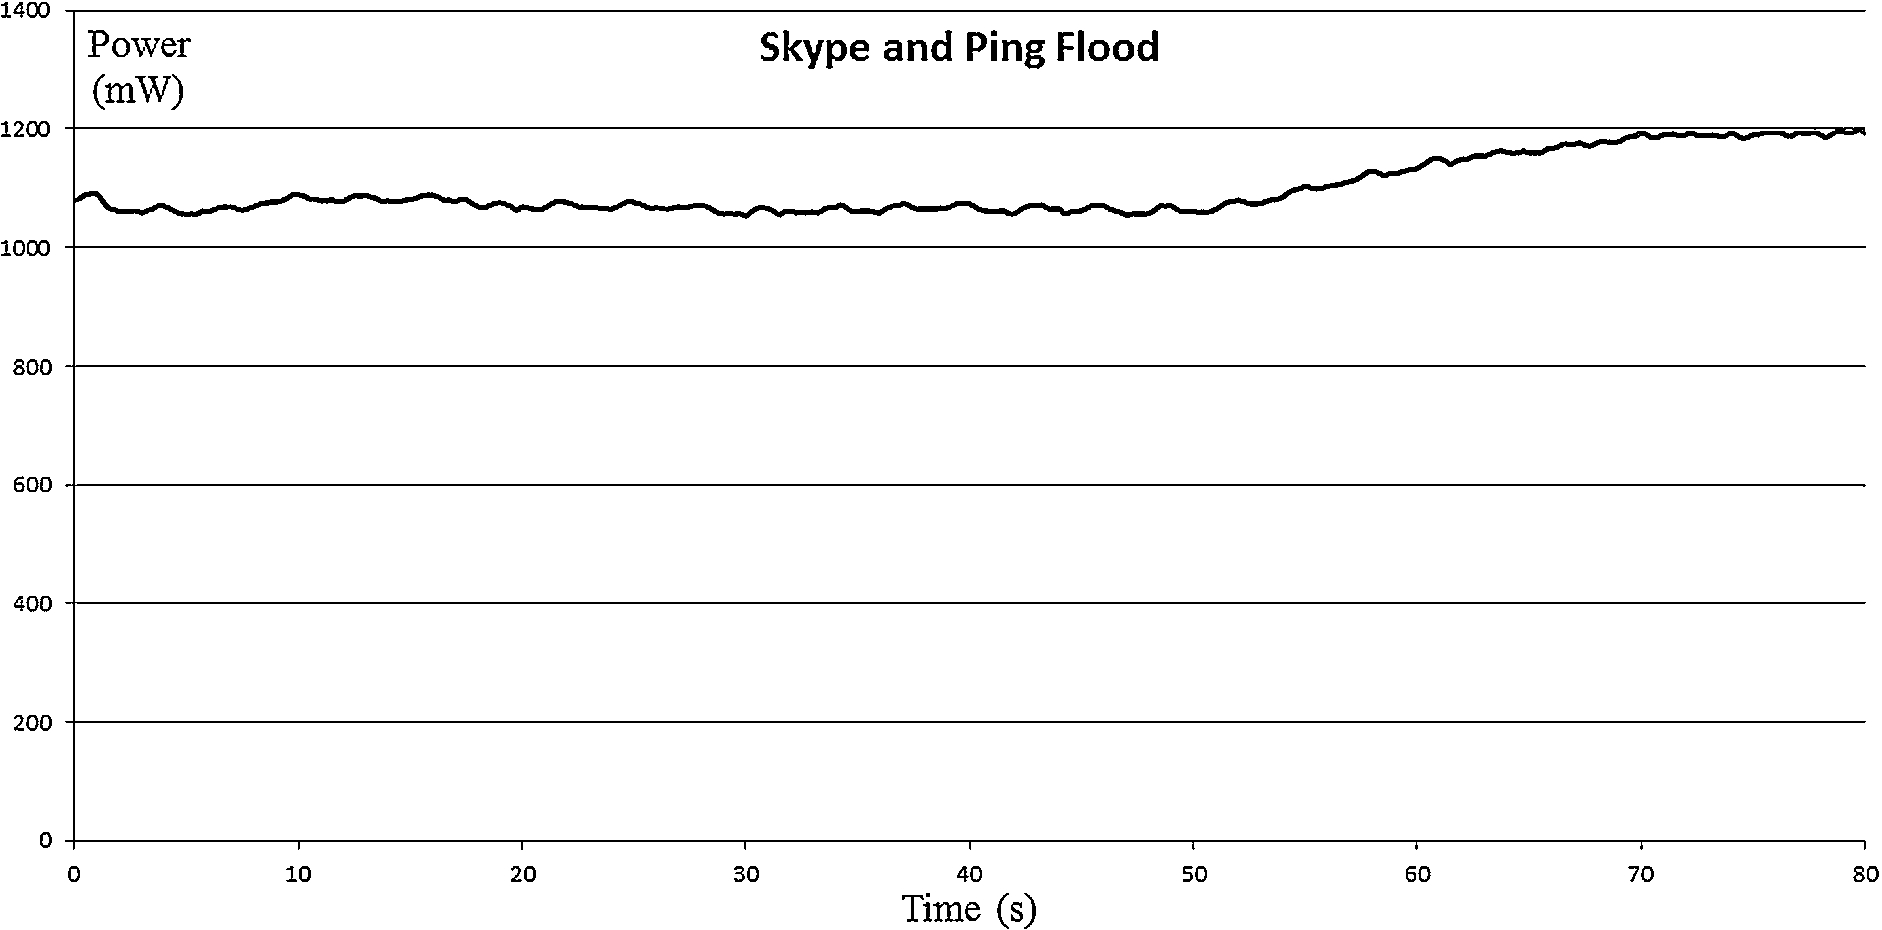
LL: energy footprint of the Skype call and the ping-flood attack.
Then, in Fig. 7 it is possible to observe how the temporal low-pass filter introduced by the 10 seconds sliding window allows to easily detect the onset of the ping-flood attack at T equal to 50 seconds. This clearly shows the efficacy of LL measurements. Although, contrarily to the HL approach previously described, LL measurements successfully reveal the onset of the ping-flood attack, they also introduce a significant drawback.
In fact, the need for in depth modification of the Android distribution and custom tailoring of drivers results in a very low level of portability.
Middle level measurements (ML). As a trade-off between the high precision of LL measurements and the portability of HL measurements, middle level (ML) measurements are proposed. ML measurements are based on the extraction of power consumption values from the battery hardware made by the standard kernel [14]; this differs from the approach adopted by LL measurements in avoiding introducing the dependence on customized kernel modules. The cost of the removal of this dependence is the fact that it is not any longer possible to control the sampling frequency and accepting the design decision taken at kernel level is the only possible solution. According to the Ohm’s law, the power consumption is calculated as
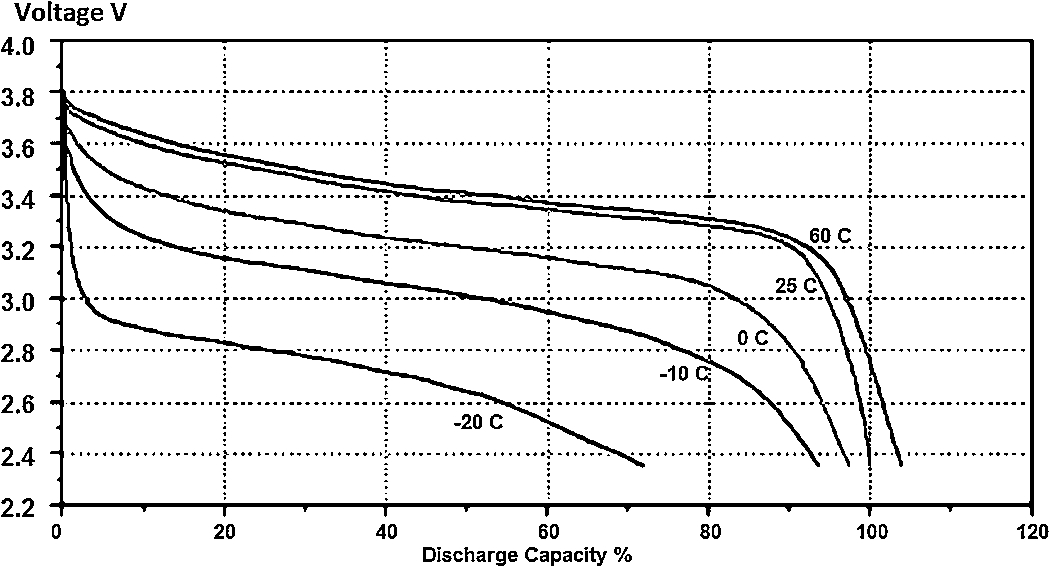
Example of characteristic curve relative to the voltage of a Li-ion battery at different temperatures.
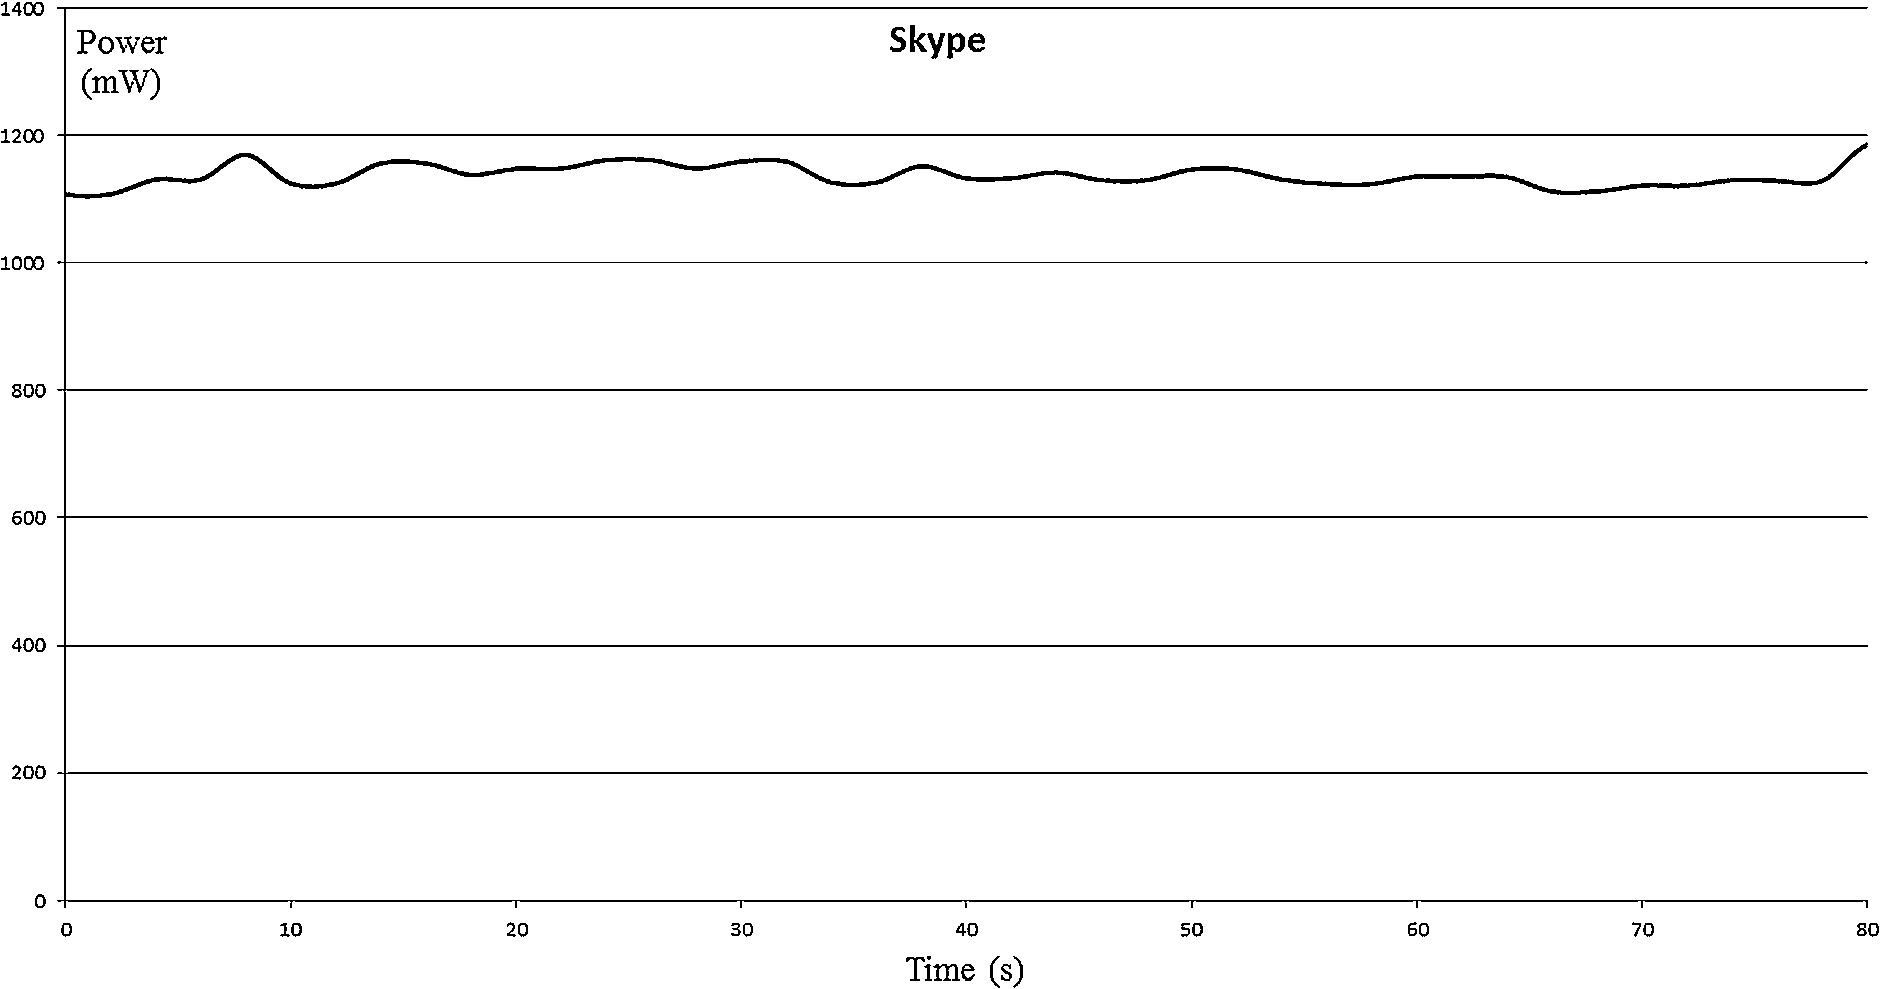
ML: energy footprint of the Skype call.

ML: energy footprint of the ping-flood attack.

ML: energy footprint of the Skype call and the ping-flood attack.
Hardware components in mobile devices require a minimum power level to work properly. Thus, to compensate the fact that the value of the voltage decreases according to the discharge of the battery and to keep power as constant as possible, the current level has to be increased proportionally.
This fact shows that, in order to make precise, long term measurements of the power consumption, it is necessary to measure both the current and the voltage. Thus, to properly identify the impact of a very slow attack, then the battery characteristic curve has to be taken into account. However, for shorter time periods, in the order of minutes, as the ones in which a generic malware attack takes place, it is possible to consider the voltage as a constant and remove it from the equation without losing any generality. This is also due to the fact that the dependency from temperature for normal working conditions (i.e., between 25 and 45 Celsius degree) the dependency of Voltage from temperature is negligible (see Fig. 8). Thus, the curve for power consumption becomes, least a scaling factor equal to the current voltage, identical to the curve of the current flowing off the battery and it is possible to analyze the current flow assuming it to have the same shape of the energy consumption.
Modern Li-ion batteries have an integrated chip that controls the energy flowing into and from the cells to prevent over-charge and over-discharge; this has the dual goal of preventing spoilage of the battery and securing the user from the risk of the battery to take fire or explode. These chips provide a measure of the current flows that may be extremely precise when they integrate a Coulomb counter if measuring techniques such as the ones described in [7] are adopted. The battery that has been used in the experiments has the Dallas Semiconductor DS2784 1-Cell Stand-Alone Fuel Gauge IC embedded in it. The values measured by the chip are made available to user space through the files
sys/devices/platform/ds2784-battery/getcurrent and
sys/devices/platform/ds2784-battery/getvoltage.
As it has been previously stated, for observation periods in the order of minutes, the Voltage assumes the significance of a scaling multiplier. Thus, the ML measurements will disregard it without any loss of generality for the reported experiments. It is obvious that an accumulated vision of power consumption over, e.g., a full battery discharge period, requires taking into account the changing voltage values. Reading such files at different time intervals allows observing that measurements less than three seconds apart are never different. Thus, it is possible to conclude that, even if the chip embedded in the battery is capable of higher frequency precise measurements, the OS enforces a policy of copy for the values into the files only once every three seconds, thus making any sampling frequency beyond 0.333 Hz useless. The low sampling frequency provided by the OS introduces a low pass filter in the measurements that could allow attacks generating very short spikes exactly between two sampling instants to hide themselves. It is important to notice, however, that this fact does not represent a significant security risk for two reasons: first, making the attack exactly between the OS samplings requires a level of precision in synchronization with OS internals that is almost impossible to achieve before the system has been successfully intruded; second, although the low pass filter effect may hide the spikes, the integral over time would anyway reveal an anomaly.
Figures 9, 10 and 11 present a graphical view of the measurements obtained by adopting the above described ML technique. These figures clearly show that the ML measurements allow identifying the same power consumption shape provided by LL measurements. Actually, the smoothing over time applied to LL measurements in [6] prevents them from creating spikes outside the capabilities of the ML approach; thus, as expected, the lower sampling frequency does not introduces substantial changes in the observable power consumption behavior of the system.
The observation of the graphs of the Skype and ping-flood experiments (Figs 7 and 11) clearly shows that the trend and the power consumption shape of LL measurements and of ML measurements show an extreme level of similarity and the onset of the attack is easily spotted at T equals to 50 seconds.
Thus it is possible to conclude that ML measurements are sufficiently precise to perform a security monitoring of the global power consumption and act as a sensor capable of spotting attacks such as the ping-flood even in this more subtle version. Nonetheless, a separation of the components due to different hardware subsystems of the mobile device would allow generating more sophisticated sensors and would allow detecting more subtle attacks. Thus, in the following section a hybrid technique fusing HL modeling with ML measurements will be defined and experimentally evaluated.
General consumption model
The global power consumption of a device can be modeled as the sum of the power consumption of every single device component. The level of approximation of the model is given both by the precision of the measurements for the single components and by the completeness of the component set. According to [3], a good approximation of a complete set of components allowing precise measures of the power consumption of a smartphone is: CPU, Screen, Wi-Fi, Cellular radio, GPS, Flash memory, GPU, Bluetooth, Audio amplifier.
This modeling leads to the formulation of the equation shown below, where
Thus, the global consumption C is defined as:
By measuring the sum of the base consumption of all components (B) and subtracting such value from the global one measured in a given moment, it is possible to retrieve the consumption footprint of a specific activity (
A first contribution to that task was given in [6] where a model for the Wi-Fi component was defined and a correspondent software module was provided.
Refining the model for the Wi-Fi consumption
As shown in the previous section, the general model isolates the power contributions of different hardware components that should be individually measured by ad-hoc modules. The process of populating the sum with the appropriate contributions has been started in [6] where a model for the Wi-Fi has been provided and, by means of experiments, the value set of the model parameters has been empirically assessed. However, in [6] the authors assume that all the hardware components but the Wi-Fi can be kept in a negligible power consumption state to correctly isolate the Wi-Fi power consumption and calculate the correct parameter values. Although this may be realistic for many hardware components (e.g. it is trivial to deactivate the GPS or to keep the display switched off), it is harder to guarantee that no contribution to power consumption comes from the GPU (there is the need to get into developer mode to set the correct options) and it is actually impossible to avoid incurring into a significant power consumption generated by the CPU. In fact, even in the experiments that in principle stimulate only the network component of the mobile device (e.g. a ping-flood attack), the CPU is always involved to process the TCP/IP stack code. Thus, the main assumption behind the Wi-Fi modelization in [6] needs to be refined in such a way so that the consumption caused by the CPU usage is always taken into account, even in the cases in which there is no explicit computation at application level. In fact, in Eq. (2), while all the f components may be considered negligible in comparison to the power consumption due to the specific activity, it is not possible to assume that all the g components but the Wi-Fi are null and it is instead necessary to get to this formulation:
Thus, the global consumption C is defined as:
Mobile devices do not include the hardware needed to perform analytical measurements of the power consumption of different hardware components, and, as stated in Section 2, introducing the dependency from additional external hardware foils the very goal of any mobile device (i.e., being easily transportable); thus, to capture the separate contributions to the global power consumption provided by the Wi-Fi and the CPU, it is necessary to rely on a power consumption model for the CPU. As it was previously shown, the model provided by apps such as PowerTutor is not sufficiently detailed, thus a new one is needed. One of the more significant contributions of this paper is the definition of a power consumption model for the CPU; in fact, even if the assumption that all the other mobile device hardware components contributions to the power consumption may be kept completely negligible in a controlled experiment is definitely an approximation of the real system behavior, the valorization of its parameters and the application of this model in the process of refining and re-modulating the power consumption due to the Wi-Fi represent another step toward the construction of a complete analytical model for the power consumption in a mobile device.
Modeling the CPU consumption
The first step to model the power consumption of the CPU is to identify the parameters that modify it. A modern mobile CPU power consumption depends on several different factors: the first one is the frequency at which it works; in fact the working frequency defines the speed with which the capacitive components of the circuit (both actual and parasite) must be charged to achieve a correct working state and thus the amount of power that is needed. Thus, there is a relation between the operational frequency and the amount of power needed in each time frame.
This power is defined by Ohm’s law and depends from the voltage and from the current. The voltage used at each different frequency is defined in a system table in such a way that it ensures correct timings for a sufficient number of chips so that the process of binning does not culls the quantity of high-speed capable chips too much and, on the contrary, produces a reasonable distribution of chips in the different bins [27]. As the voltages are defined to accommodate the slightly faulty chips, the high quality ones may work correctly with lower voltages and some users may manipulate the system voltages table to reduce the CPU power consumption (a practice that is called undervolting). Nonetheless, even in the case of undervolting the voltage values adopted at the different frequencies have still to be written in the system file and may be retrieved to calculate the actual power consumption. The other term of the power consumption is the value of the current. This can be measured if the mobile device includes a Coulomb counter; however, the value of the current measured by the Coulomb counter refers to the global power consumed, and does not provide any indication of the fraction relative to any specific hardware component. Thus, in a situation in which more than one hardware component is active, it is not possible to directly identify a per-hardware-component power consumption.
As it was shown in Section 4.1, though, the global power consumption should be modeled as the sum of the contributions of all the hardware components; thus, leveraging the relation between the operational frequency of the CPU and the actual power consumption it is possible to define a model that relates the CPU derived power consumption to the operational frequency used in every time-frame. Thus in each time frame:
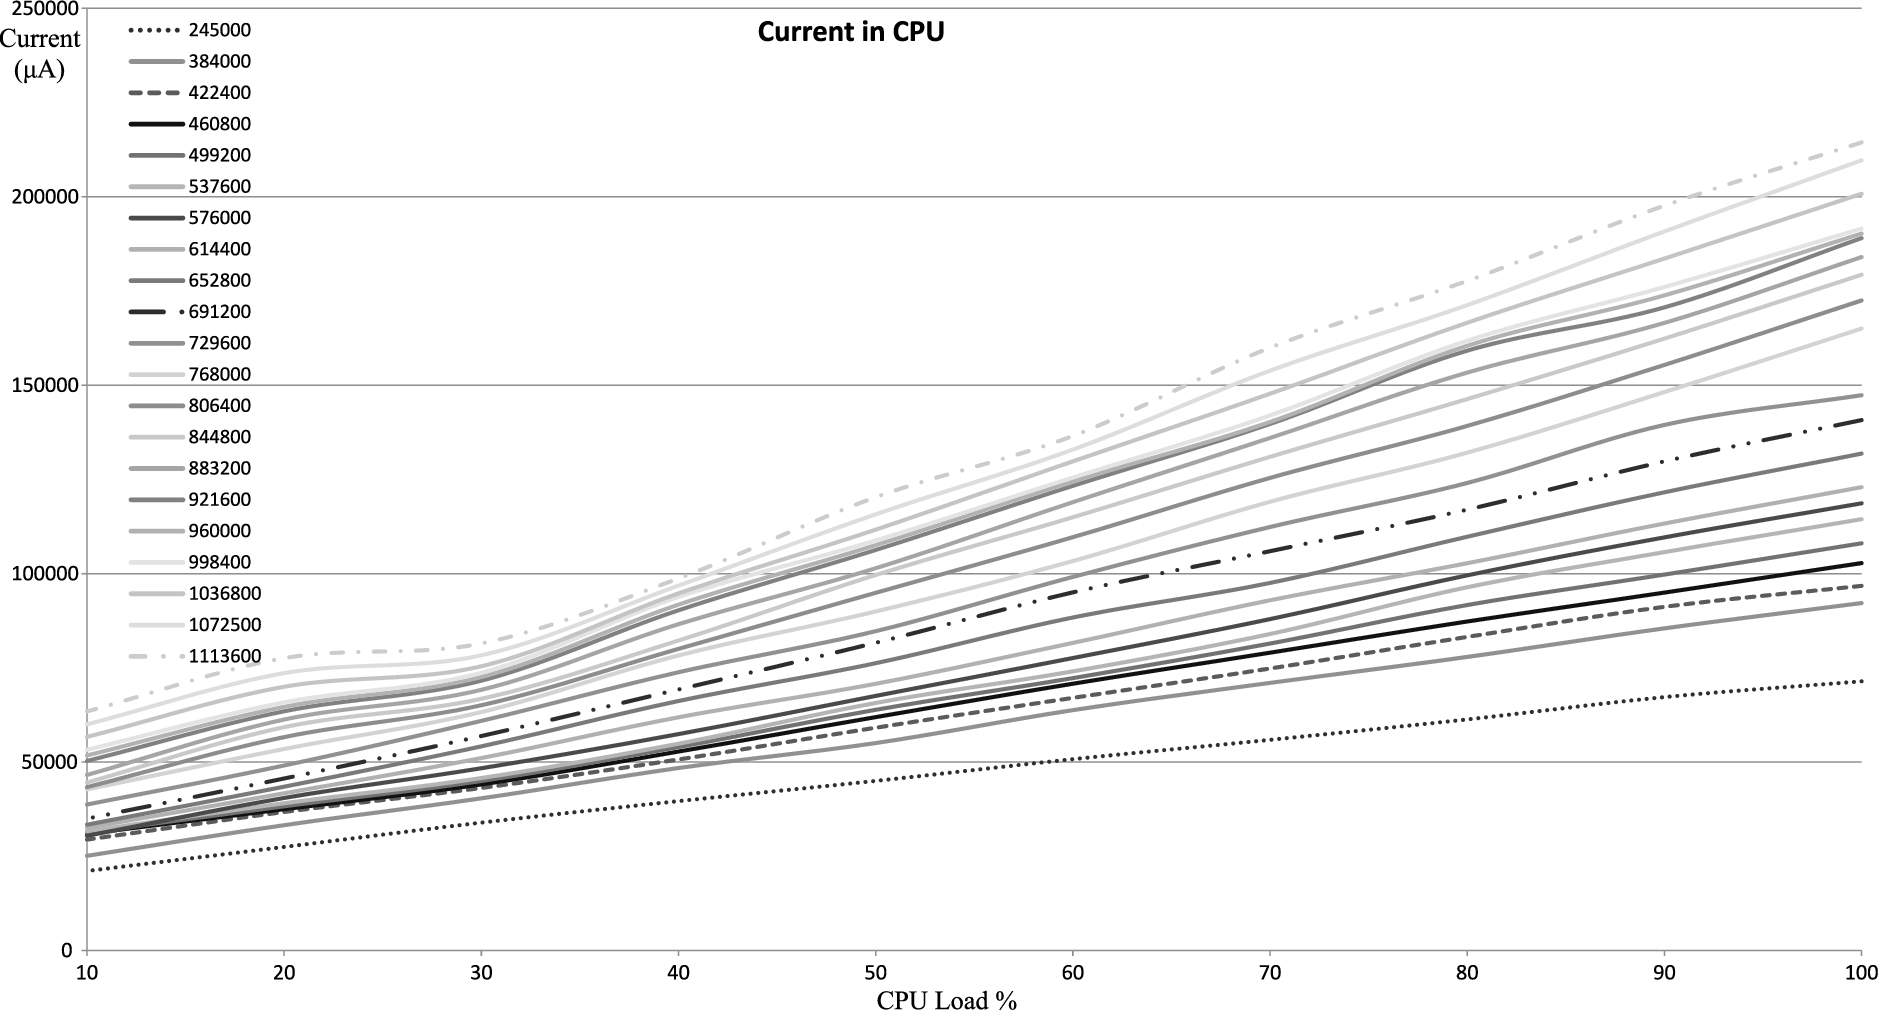
Current absorbed by CPU at different operational frequencies and loads.
Obviously, while the model is general, it contains parameters whose values are specific for a single hardware, namely
Current absorbed by CPU at different operational frequencies and loads

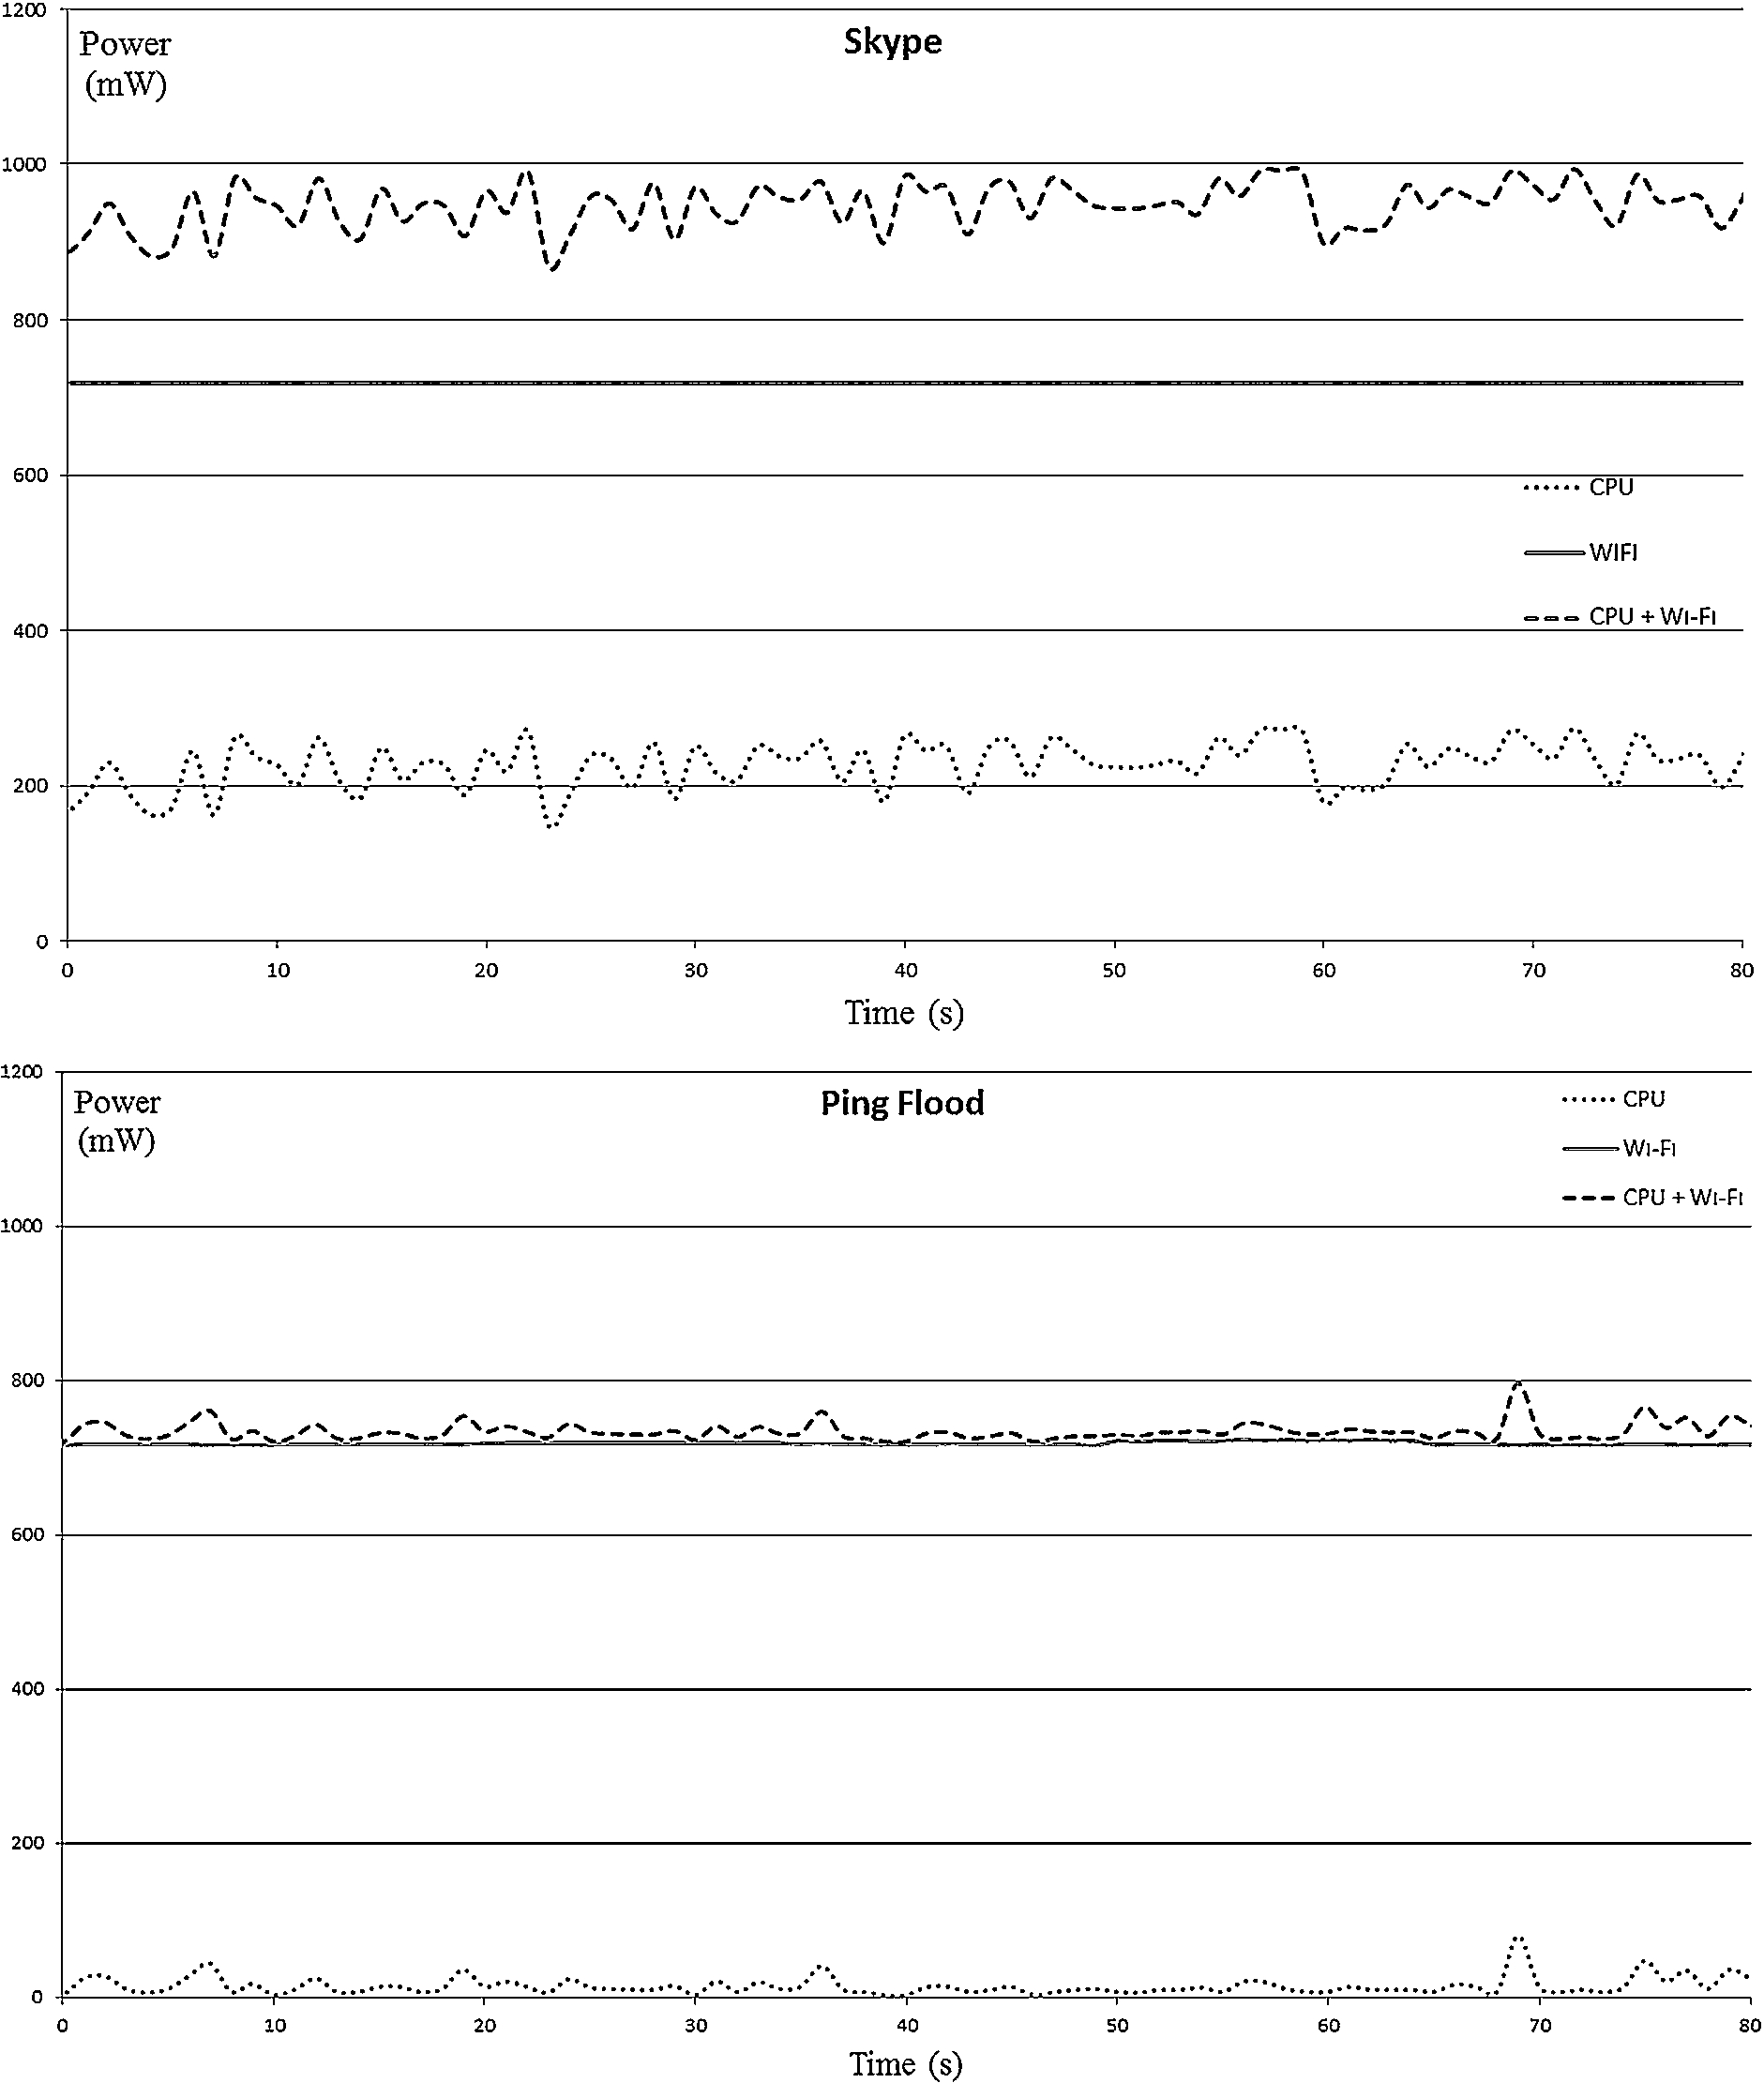
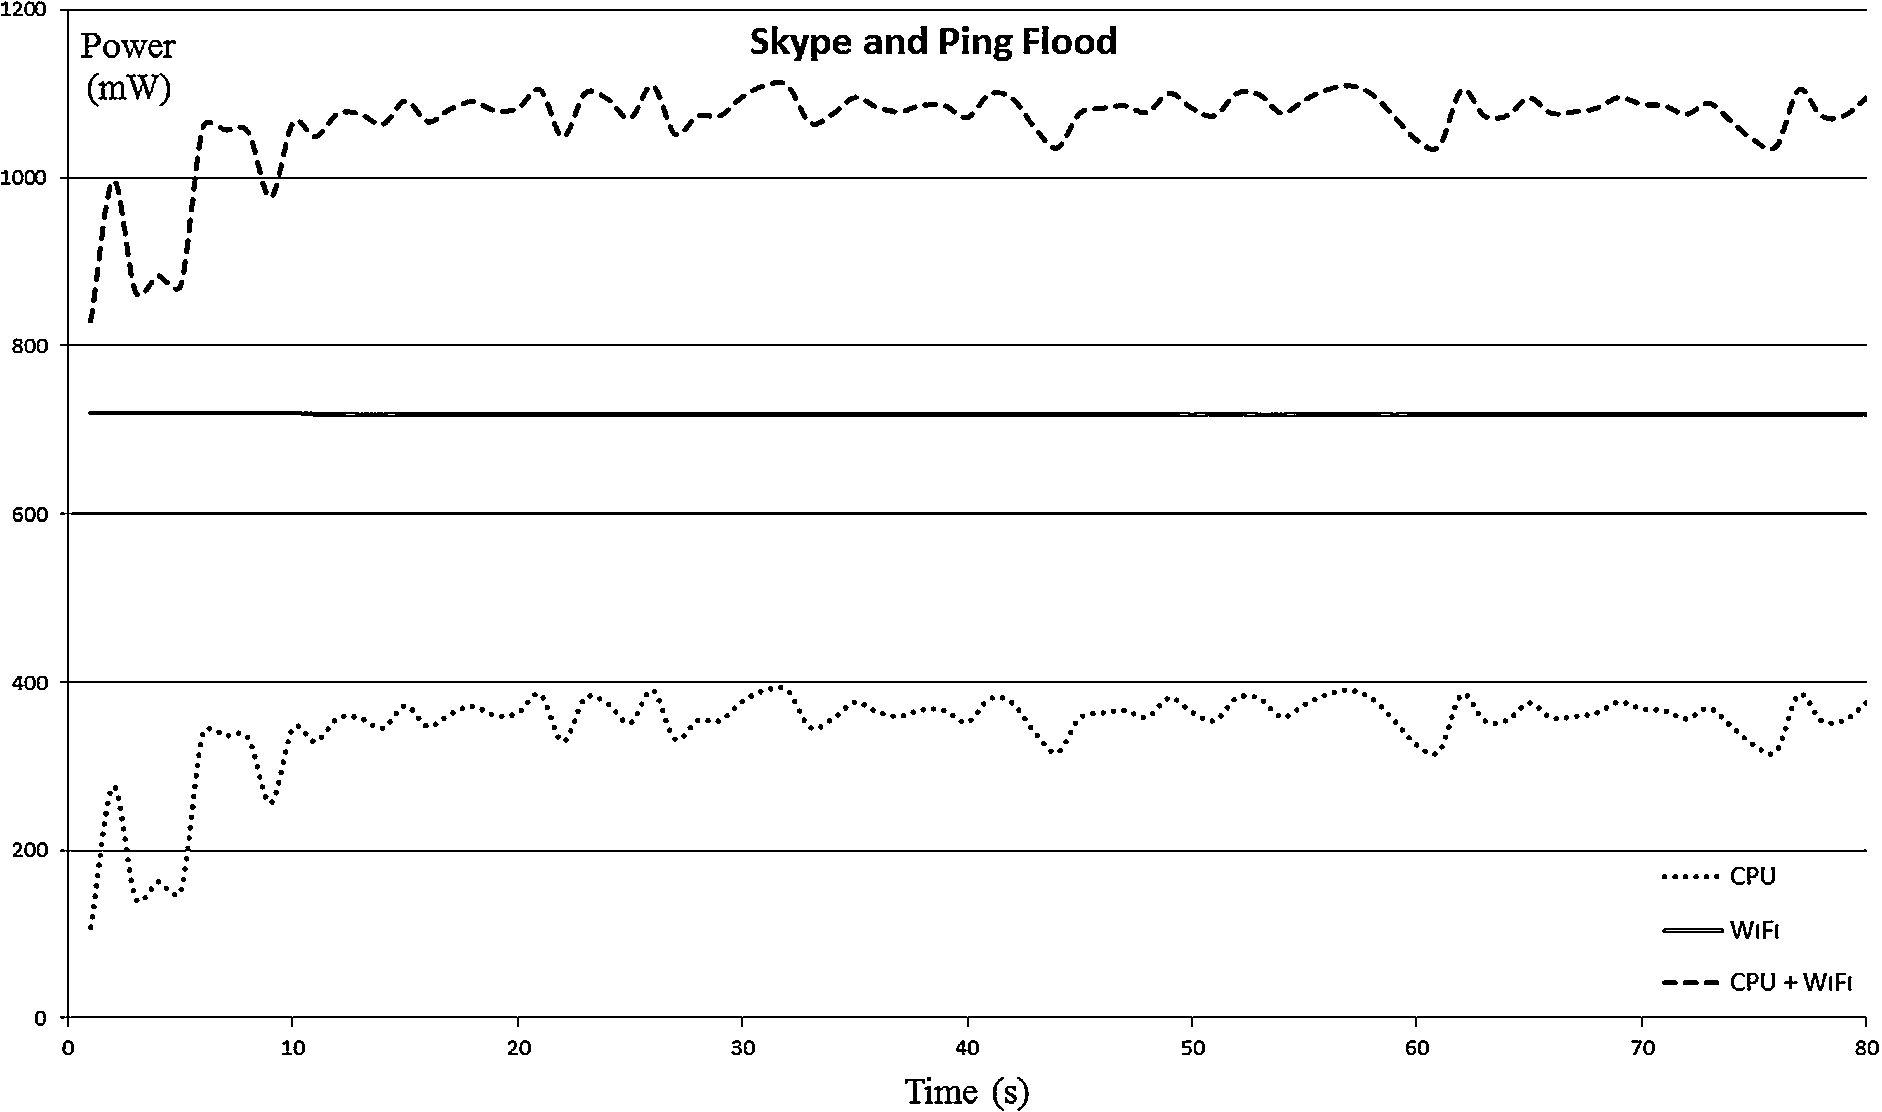
By adopting this model for the CPU power consumption, it is possible to subtract the power consumption of the CPU from the globally measured power consumption to obtain the contribution due to Wi-Fi alone. To validate this separation we repeat the experiment described in Section 3 (i.e. the Skype call attacked by a ping-flood) taking into account the CPU parameters for operational frequency and load. These values may be read from the /sys pseudo-file-system of the device, exactly as the current and the voltage. In Figs 13, 14, and 15 it is possible to observe the two components of the power consumption during the experiment described in Section 3.

Power consumption during a Skype call. The consumption is separated into CPU and Wi-Fi components by subtracting the estimated CPU from the global measurement.

Power consumption during a ping-flood attack. The consumption is separated into CPU and Wi-Fi components by subtracting the estimated CPU from the global measurement.

Power consumption during a Skype call interrupted by a ping-flood attack. The consumption is separated into CPU and Wi-Fi components by subtracting the estimated CPU from the global measurement.
However, this separation has two significant drawbacks:
first, it requires the global power consumption measurements to be taken;
second, the Wi-Fi estimate is independent from any observed value and simply includes anything that is not supposed to be part of the CPU consumption.
In the following section, a per-byte power consumption model for the Wi-Fi will be defined to achieve independence from the need to gather data for the global power consumption. Finally, this model will be used to generate a two-dimension power-consumption signature for both a Skype call and a ping-flood attack.
The CPU consumption model defined in the previous section allows separating the CPU power consumption component from the remaining part. By applying this model to the experiments described in Section 3 it is possible, as the only active contributions to the power consumption are the CPU and the Wi-Fi, to compute the average per-byte power cost of Wi-Fi transmissions.
According to the measurements, though, there is a very large difference between the average per-byte current value computed if the traffic is generated only by a low-level activity such as a ping-flood or a high-level activity such as Skype. This discrepancy reveals that the assumption that it is possible to completely prevent any power consumption besides the one caused by the CPU and the Wi-Fi has to be adjusted. In fact, had it been completely true, removing the CPU contribution to the measured power consumption would have left only the Wi-Fi contribution; this latter contribution should have shown a strong correlation to the amount of network traffic. On the contrary, measurements reveal that the average Ampere/Byte value for ping traffic is 1.2E−7 while the average Ampere/Byte value for application layer traffic such as Skype is 6.8E−6, i.e., an order of magnitude of difference.
However, the need for such an adjustment is rather obvious; in fact a low level activity such as replying to a ping request involves no interaction with user-space level memory and thus requires almost no intervention by any other device component besides the Wi-Fi and the CPU. On the contrary, an application layer activity such as Skype involves moving data in RAM, a component that, in these experiments, has been considered silent from the power consumption point of view. Nonetheless, it is possible to achieve a very good level of precision in the estimation of the power consumption related to Wi-Fi traffic just taking into account separately the amount of low level traffic and the amount of application level traffic. More in details, the power consumption due to the Wi-Fi may be modeled as a weighted sum according to the following formula:
Experimental results
The three scenarios previously described (i.e. Skype call, ping-flood attack, and Skype going on during the energy-biased version of the ping-flood attack) have been used to evaluate the precision with which the models defined in Section 4 allow estimating the actual power consumption. Due to the limited duration of these experiments, in this scenario too the voltage is assumed to be constant and, thus, current is assumed to be equal to the global power consumption least a scaling factor. The sum of the estimated CPU current and the estimated Wi-Fi current is compared to the current actually measured.
The model defined to evaluate the power consumption of the Wi-Fi requires distinguishing between the traffic at low-level and the traffic at application level. In the experiments described in this paper this separation is rather simple. First, we assume that the Skype calls require the suggested bandwidth of 100 kb/s; then, we observe the percentage of lost packets that Skype declares; finally, we assume that all the traffic beyond what Skype declares to have generated is due to the ping request/reply packets. This allows formulating the following equation:
Then the traffic due to the ping-flood can be obtained as:
During the experiments, Skype has a 0% packet loss before the onset of the ping-flood attack and a 1% packet loss once the attack starts. A 1% packet loss implies that of the nominal required bandwidth of 100 kb/s only 99 kb/s are actually generated. The average measured traffic during the experiment is 800 kb/s, thus 99 kb/s represent 12% of the measured traffic. Thus it is possible to assume that 100% of the traffic is of the application level type until the attack starts while this percentage decreases to the 12% of the global traffic after the attack starts. It is important to remember though, that this change in the percentage of traffic is not perceived at the application level as the Skype calls quality is substantially unchanged. Substituting these numbers in the above equations, it is possible to compute an estimate of the current due to the Wi-Fi on the basis of the traffic measured during the experiment.

Power consumption during a Skype call. The consumption is separated into CPU and Wi-Fi components. The global estimate is compared to the measured value.
Figures 16, 17 and 18 show the estimate current compared to the measured value for a Skype call, a ping-flood and a Skype call with a ping-flood. The estimate does not follow precisely the trend shown by the measurements, however the average error (computed as the absolute value of the difference divided by the measured value) is 6.56E−2, with a maximum value of 1.65E−1 and a minimum value of 1.25E−3. Furthermore, the increase in the current (and thus in the power consumption) that is caused by the attack is still clearly visible.
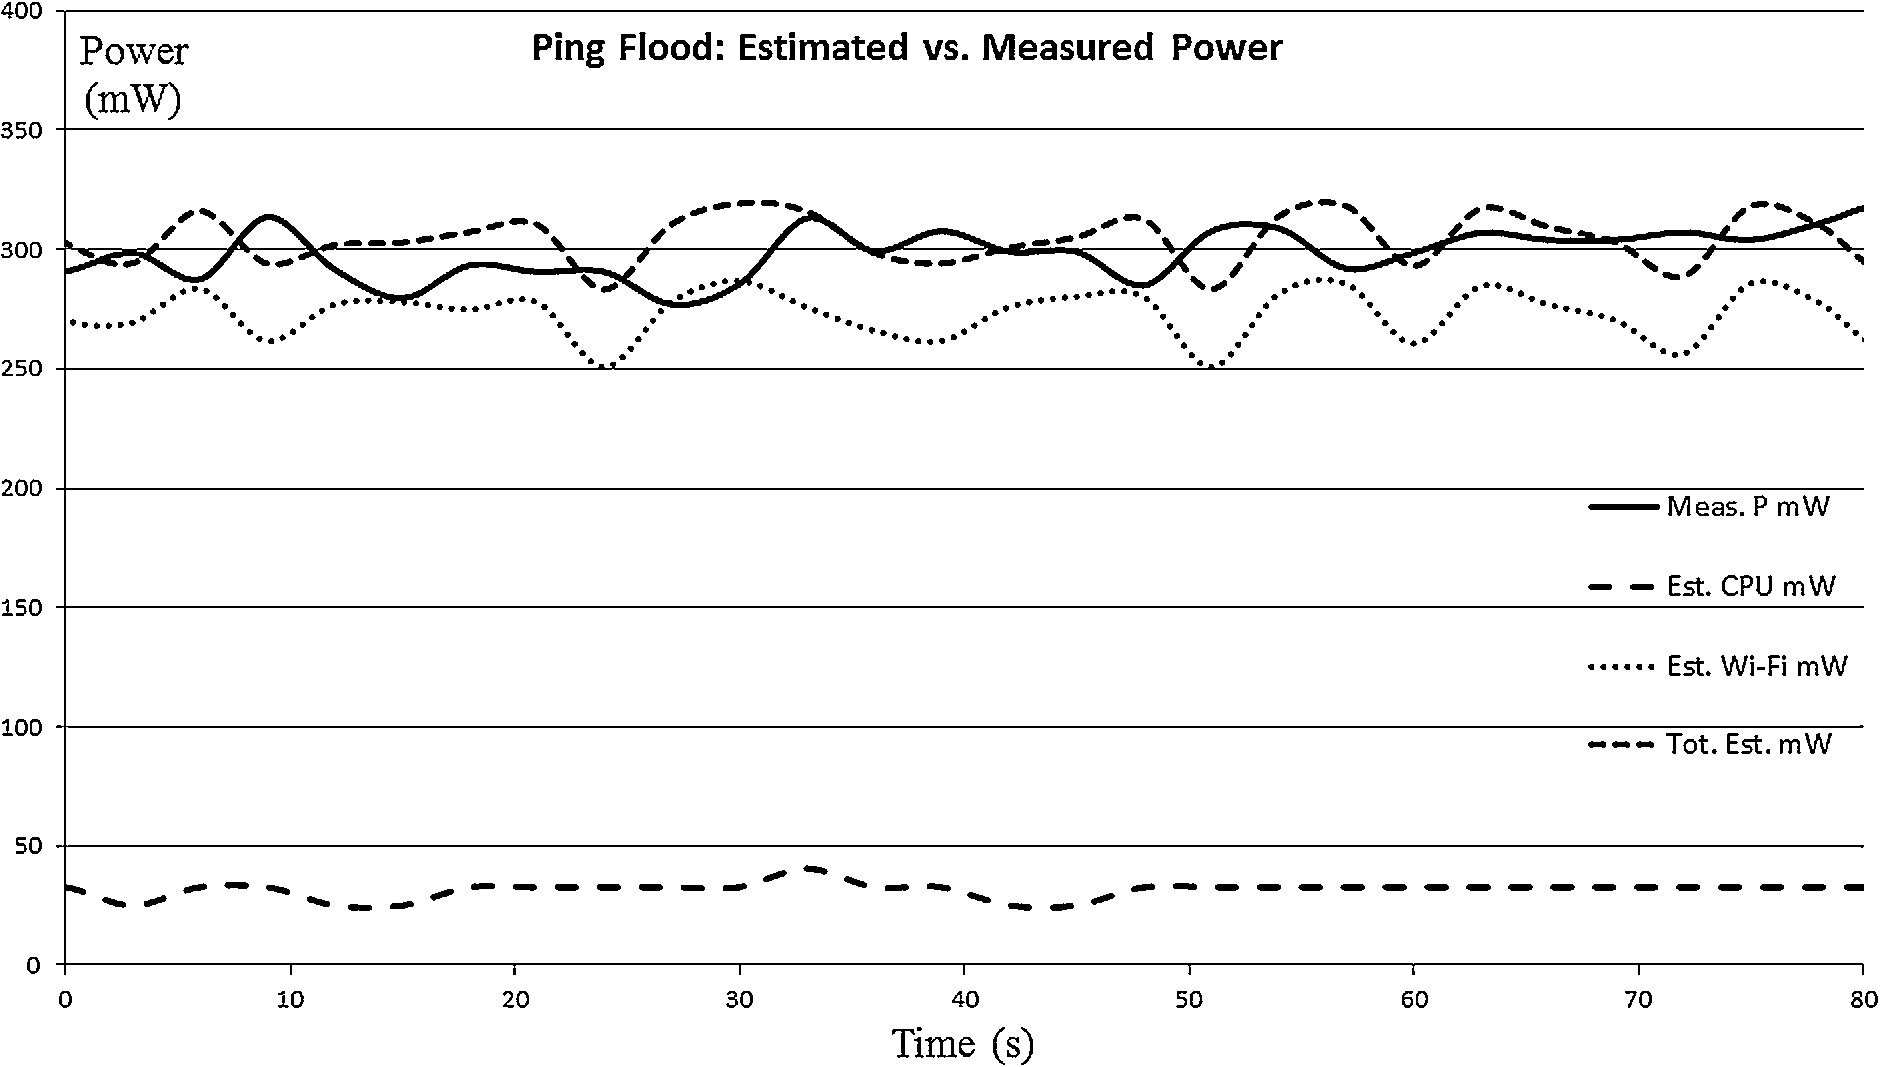
Power consumption during a ping-flood attack. The consumption is separated into CPU and Wi-Fi components. The global estimate is compared to the measured value.
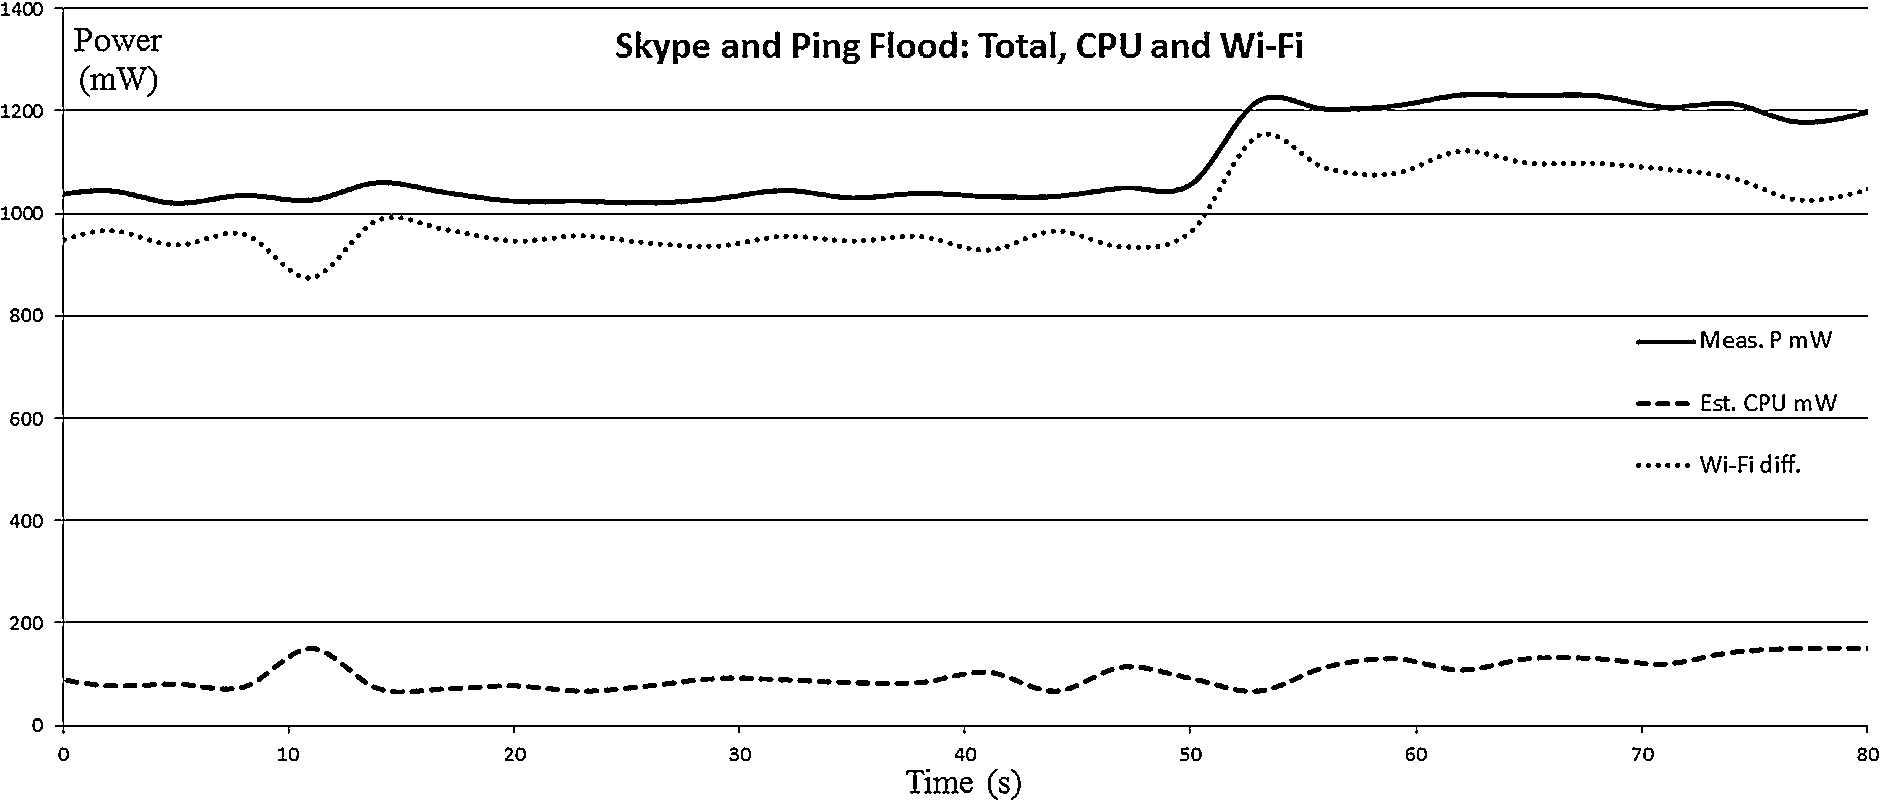
Power consumption during a Skype call interrupted by a ping-flood attack. The consumption is separated into CPU and Wi-Fi components. The global estimate is compared to the measured value.
Mobile devices have introduced several new dimensions in the field of information security; one of these new dimensions is their strict dependency from the battery. In fact, the inability to work if the battery is depleted turns the energy supply mechanisms into a significant attack surface. Nonetheless, this same dependency makes the monitoring of energy consumption behavior an additional source of information for entities dedicated to the detection of malicious or even just anomalous behaviors inside a mobile device.
In order to evaluate the feasibility of a new generation of threat detectors based on energy awareness, this paper has discussed three different methodologies (two already existing and a new proposal) aimed at obtaining reliable and accurate measurements of energy consumption in mobile devices. The reliability of such methodologies has been tested through experiments on actual mobile devices. On one hand, the experimental results show that previous existing methodologies are insufficient to support both reliable and non-energy-hungry profiling of activities. On the other hand, the same experiments suggest that the new methodology proposed in this paper can be suitably adopted as a basis to build accurate and reliable energy footprints of activities, sufficient to enable energy-aware intrusion detection on mobile devices. With accurate and reliable energy consumption measurements, it will be possible to adopt an hybrid approach in which energy signatures of known applications (or combination of those) will allow spotting anomalous energy events. It is important to notice that energy signatures for applications need to be dimensioned on the specific hardware. Finally, it is also worth noticing that our methodology can be suitably applied also to other energy-aware contexts (i.e., not strictly related with security), e.g., as in the approach discussed in [4].