
Abstract
In this paper we investigate on detecting opinion spammer groups through analyzing how users interact with each other. More specifically, our approaches are based on 1) discovering strong vs. weak implicit communities by mining user interaction patterns, and 2) revealing positive vs. negative communities through sentiment analysis on user interactions. Through extensive experiments over various datasets collected from Amazon, we found that the discovered strong, positive communities are significantly more likely to be opinion spammer groups than other communities. Interestingly, while our approach focused mainly on the characteristics of user interactions, it is comparable to the state of the art content-based classifier that mainly uses various content-based features extracted from user reviews. More importantly, we argue that our approach can be more robust than the latter in that if spammers superficially alter their review contents, our approach can still reliably identify them while the content-based approaches may fail.
Introduction
In recent years there has been a rapid and growing interest in opinion spamming [26,28,29,34,41,45,49]. Opinion spamming refers to malicious activities that aim to influence normal users’ decisionmaking for profit. While a number of methods have been proposed to detect opinion spams, most of them focus primarily on developing pure content-based classifiers [11,29,34,45,49]. The basic idea behind these approaches is to detect opinion spams through the analysis of review contents. These content-based classifiers can be limited for several reasons. First, content-based classifiers tend to be domain specific. A spam classifier designed for one domain (e.g., travel reviews) is often hard to be applied to another domain (e.g., book reviews) [34]. Second, spammers can easily manipulate review contents to avoid detection. For example, if duplicated text reviews are considered to be spams, spammers may simply paraphrase the contents. Third, while most content-based classifiers generally require ground truth labels for training, it is often hard to obtain for real world datasets. Some prior research used human experts to manually label data. However, given its high cost, it is impractical to do so reliably for large-scale datasets. In this paper we explore an alternative approach by examining what we call promotional opinion spammers through the analysis of user interactions. Promotional opinion spammers refer to attackers who try to improve the influence of their opinions by malicious artificial boosting. For example, many review systems employ some sort of reviewer/review ranking systems (e.g., a top reviewer list on Amazon, most helpful reviews on Amazon, or most recommended reviews on Yelp). It is believed that people tend to trust highly ranked reviews much more than others [4]. We thus hypothesize that spammers would seek to boost their ranks in order to increase the impact of their reviews.
To boost their rankings, spammers need to collect significantly more positive responses than negative ones. For example, the rankings of reviews and reviewers on Amazon are based primarily on the number of helpful votes received. Since multiple votes from the same user on one review are often counted as one vote, spammers need to boost their rankings by gathering positive votes from different users (i.e., collusion). Therefore, they may need to collaborate to express positive responses to each other. We thus hypothesize that such malicious artificial boosting activities would eventually lead to constructing communities in which spammers are strongly positively connected with each other through review-response interactions (e.g., votes and text replies on reviews); similarly, spammers may collaborate to express negative responses to competitors. We thus hypothesize that malicious demoting activities would eventually lead to strong negative connections from spammer groups to competitors.
In this research, our primary research question is whether we can detect opinion spammer groups through analyzing users’ interaction patterns. Note that normal users may also form natural communities based upon their genuine similar interests [8]. We thus focus mainly on
Our work is grounded in the context of a review ecosystem on Amazon. Previously, we identified implicit communities with differing strengths through review/response activities on Amazon [8]. Here we further explore the correlation between the strength of communities and spammicity and moreover, the spammicity of positively and negatively connected communities via sentiment analysis. The intuition behind sentiment analysis is that: if a user has an unusual positive or negative relationship with another, they may post fraudulent positive or negative responses to each other’s items and/or reviews to boost or demote the reputation of specific reviews or reviewers.
Generally speaking, our approach is based on 1) discovering strong vs. weak implicit communities by mining user interaction patterns and 2) revealing positive (boosting) vs. negative (demoting) communities through sentiment analysis on user interactions. More specifically, our approach can be divided into four stages. First, we build general user relationship graphs representing how users interact with each other. Second, we derive the sentiment of each relationship by aggregating sentiments of all responses between any two users and extract positive and negative relationship graphs from the general relationship graphs to capture boosting or demoting behavior. Third, we assume that spammers need to group and work collaboratively to post positive comments to each other to obtain a dominant position; thus we extract strongly connected communities from positive relationship graphs, referred as the anomalous positive communities in the following. Finally, we analyze the positive and negative relationships of the discovered anomalous positive communities to identify their targets.
Our main contributions are summarized as follows.
(1) We propose a general unsupervised hybrid approach that is based on user interactions coupled with sentiment analysis. To the best of our knowledge, this is the first attempt to identify opinion spammer groups through analyzing users’ interactions rather than purely focusing on their review contents. A key advantage of our approach is that it can detect opinion spammers even when traditional content-based approaches fail.
(2) We introduce a new angle of collusive spamming behavior that spammers deliberately build strong positive communities to make their own opinions influential. We thus propose to explore community structures and the strength of relationships (i.e., how much the relationships are likely to be built intentionally) as spam indicators. We also investigate the positive and negative relationships from the strong positive communities to find their positive and negative spam targets.
(3) We run extensive experiments over datasets collected from Amazon to evaluate the effectiveness of the proposed approach. While doing so, we compare our approach with existing content-based classifiers. Our experiments show that even though our community-based approach differs markedly from pure content-based approaches, it reaches the same level of accuracy as state of the art content-based approach targeting at Amazon spam reviews.
The remaining parts of this paper are organized as follows. In Section 2, we review related work. Section 3 describes the four stages in our approach. In Section 4, we describe our datasets and three types of reviewers involved in our comparisons. Sections 5, 6, and 7 present our experimental results. Finally, Section 8 discusses our results and concludes the paper.
Related work
There has been a lot of research on combating spams in the context of Web and Email, which can be classified into two categories: content-based and link-based approaches [1,7,12–15,31,39,44]. Content-based approaches analyze the content of the webpages including irrelevant contents, malicious urls, and unsolicited commercial advertisements [6,13,17,31,44]. Link-based approaches, on the other hand, specifically target to detect link-based web spams with which spammers try to boost their page rankings and get popularity by building strongly connected page links. To do so, link-based approaches leverage the properties of the link structure [7,39,50].
In recent years, there has been a growing body of research on a new type of spams, called
Despite the high payoffs and urgency for opinion spam research, significant barriers remain: unlike traditional spam analysis in the context of Web and emails, it is often hard to get ground truth labels for opinion spam. Previous research thus employed different mechanisms to obtain ground truth labels.
Early work including [11,20,21,24,48] manually inspected reviews and extracted simple features. For example, Jindal et al. classified reviews as spam/non-spam by detecting duplicate/near-duplicate reviews. Li et al. employed 10 college students to manually label randomly chosen reviews as spam/non-spam given a few intuitive features [23]. Then they introduced two semi-supervised methods to classify unlabeled dataset given the labeled dataset. In their research, the authors observed four spam review features and two spammer features based on which they classify unlabelled reviews and reviewers.
Similarly, prior research used manually labelled datasets to discover unexpected rating patterns [10,11,21,24,38,40,48]. For instance, Liu et al. proposed an algorithm combining a temporal analysis and a user correlation analysis to identify products under malicious ratings in e-commerce [25]. To do so, Liu et al. investigated whether rating changes dramatically or accumulatively over time. While their approach can capture reviewers’ unexpected behavior, it depends largely on heuristics; which is often domain-dependent and sometimes requires expert knowledge [28,29].
More recently, a few researchers generated ground truth labels by hiring human experts to manually label reviews [28,29] or by hiring online workers such as Mechanical Turkers to write spams [33,34].
For example, the dataset used in [33,34] includes 400 truthful reviews from Tripadvisor and 400 opinion spams generated by Turkers. In their work, content-based classifiers were developed by using various linguistic features that differ truthful reviews from spam ones. While these classifiers have been shown to be successful, it is not clear whether they can be applied reliably to other domains because they are very content specific. For example, linguistic features of hotel reviews may be different from those of electronics reviews. More importantly, there have been unresolved debates on whether datasets generated by Turkers are indeed representative of actual spams in real world [28,29].
Alternatively, Mukherjee et al. generated ground truth by hiring domain experts who manually detected spams using some expert predefined features [28,29]. The authors observed certain abnormal spamming-like behaviors in their datasets with ground truth labels. Based on these observations, they defined nine spam and spammer indicators and then developed an unsupervised classifier that exploited the behavior distribution to detect spams.
While existing research discussed above present promising results, it has the following caveats. First, it is often easy for spammers to avoid content-based spamming detection by making superficial alterations to their reviews [19,43,46]. Second, pure content-based detection methods are often domain specific and thus different classifiers are needed for different applications and task domains [33,34]. Finally, it is often hard, if not impossible, to manually generate ground truth labels reliably for large-scale datasets [28].
By contrast, our unsupervised approach is built based on the nature of spamming behaviors: it detects spammers by analyzing user relationships and sentiments built through user interactions. We believe it is much harder to fake user interactions than to rephrase their review contents; the same is true for sentiment analysis in that spammers may change their contents to avoid spamming detection but not the sentiments of their interactions. Because doing so would void the whole purpose of spamming.
The four-stage approach to discover opinion spammer groups and their spam targets
The aim of this research is to detect opinion spammer groups who artificially form implicit communities through coordinated interactions to promote collaborators (i.e., positive spam targets) and/or to demote competitors (i.e., negative spam targets). Our approach can be divided into four stages and Fig. 1 depicts the general four stages through four sub-graphs, one sub-graph per stage. The four stages are: 1) building a general user relationship graph in Fig. 1(a); 2) annotating the general graph through sentiment analysis shown in Fig. 1(b); 3) identifying anomalous positive communities in Fig. 1(c); and finally 4) detecting positive and negative targets of the anomalous communities shown in Fig. 1(d). In the following, we describe each stage in more details.

The general idea of the proposed approach.
We focus on two types of users in a review system: reviewers and commenters. A reviewer writes reviews about items and a commenter comments on the existing reviews. Both reviews and comments may take a variety of forms including assigning scores, voting, and writing text. For instance, Amazon users can assign a star rating along with text reviews, post text comments, and vote on the helpfulness of a review; while Urbanspoon users can vote on the helpfulness of a review but not post text comments.
Interactions are defined between two different users. More specifically, an interaction from user u to user v is formed if u made a comment on v’s review or v’s comment. Note that users may build threads of comments. In this paper, however, for simplicity reasons we will only consider the interactions made by commenting on a review where most attentions are generally focused on. Also, we count multiple comments from the same user on the same review as one interaction for the sake of fairness. In the following, we investigate whether we can discover any anomalous patterns by focusing only on user interactions.
We represent users and their interactions on a review system as a directed multigraph
Generally, the in-degree of v essentially reflects v’s tendency of getting comments as a reviewer (i.e., how popular v is to get comments); while the out-degree of u reflects u’s tendency as a commenter (i.e., how much u is willing to comment). For example, some user may write a lot of reviews and get a lot of comments (high in-degree); while some user seldom writes reviews, but posts a lot of comments (high out-degree). We further model a user’s tendencies as a reviewer and a commenter using incoming and outgoing probabilities defined as a reviewer’s probability to get incoming edges and a commenter’s probability to generate outgoing edges respectively.
Generally speaking, if we assume that there is no external relationship between users u and v, the typical interaction between a commenter and a reviewer can be modeled as a random process. User u simply stumbles upon v’s review by chance when browsing the system. He does not know v and seek out v’s review deliberately. In other words, if there was no prior relationship from u to v, interactions from u to v should happen randomly depending on u’s tendency as a commenter and v’s tendency as a reviewer.
Accordingly, we can represent all users’ interactions as a random graph in which edges (i.e., interactions) are randomly created following the incoming/outgoing probabilities of each user. As a result, we get random graph
Given the random graph model, we examine the real interaction patterns in a review system and see how much they deviate from the random graph. We define users’ relationship and its strength based upon the distance between users’ original interaction graph and its corresponding random graph. Intuitively, the larger the difference between the real interaction and the random model is, the more likely the relationships are artificially orchestrated. We measure such distances by building confidence intervals based on the random graph.
Suppose that there is a total number of N edges in graph G. u and v are two vertices (users) on G where u’s out-degree is O and v’s in-degree is I. So, without any relationship, the random chance for an edge (interaction) from u to v is
If the random probability
A formal definition of user relationship is given as follows.
u has a relationship to v with τ confidence interval, if the following condition holds:
where
Given Definition 1, we quantify the strength of a relationship in two ways. The larger difference between
The strength
where
Alternatively, the higher the value of τ with which the relationship is defined, the more likely a strong relationship exists between u and v by Definition 1. The strength can thus be defined with the confidence interval τ as follows.
The strength
where τ is confidence interval with which the relationship between u and v is defined.
The concept of strength of relationships can be naturally extended to communities. Concretely, edge
Given the definitions above, we extract separate user relationship graphs for each τ community in which vertices are users and edges are their relationships defined by interactions, as illustrated in Fig. 1(a). Figure 2 presents examples of user relationship graphs in Amazon. As we exclude higher strength of relationships from lower ones, relationships in Fig. 2(a) do not appear in Fig. 2(b).

Examples of user relationship graphs in Amazon (Books Datatset).
In Stage 2, we apply sentiment analysis on user relationships. To do so, we aggregate the sentiments of all comments between any pair of users and from these comments we derive the sentiment of each relationship.
If comments are in the form of explicit votes, it is straightforward to obtain sentiment values. However, in many systems including Amazon and Yelp, it is often unknown who made the vote as only aggregated information is publicly available. For example, we may know a certain review got 50 positive votes total, but we cannot know who made those votes. We thus focused only on text comments for the sentiment analysis of a relationship. For this purpose, we employed a publicly available tool, AlchemyAPI [2] which is known to present high accuracy on the identification of sentiments in various applications including reviews and tweets [37,42]. AlchemyAPI takes text contents as input, identifies the sentiment of the text contents, and output a sentiment score ranging from
There are many possible ways to derive the sentiment of a relationship from the sentiment of each comment. Here we simply define the sentiment of a relationship from commenter u to reviewer v as the average sentiment of all of u’s comments on v’s reviews. That is, to decide whether a relationship from u to v is positive or negative, we analyze the sentiment of each comment from u to v and then aggregate. We consider the relationship is positive, neutral, or negative if the average sentiment score is more than, equal to, or less than 0 respectively. We then build sentiment relationship graphs in which sentiments of all relationships are analyzed as illustrated in Fig. 1(b).
Stage 3: Identify spammer candidates by decomposing relationship graphs
In Stage 3, we identify spammers by analyzing community structures and the strength of relationships using the sentiment relationship graphs generated in Stage 2. Note that we are interested in spammer groups who work together, not individual spammers. To effectively spam for promotion and/or demotion, spammers would need to obtain a dominant position (i.e., reviewers whose opinions are believed to be trustworthy) in a system. One possible way to do so is to collect significant amounts of positive votes and thus spammers would need to group and work collaboratively to post positive comments to each other. Therefore, we extract only positive relationships from the sentiment relationship graph built in Stage 2, and build positive relationship graphs as illustrated in Fig. 1(c).
Here we hypothesize that non-spammers would rarely post positive comments to spammers or spamming reviews, thus it would be less likely for interactions from non-spammers to spammers to appear in the extracted positive relationship graphs. On the other hand, spammers would deliberately write extensive positive comments to each other and thus would exhibit strong interconnections in extracted positive relationship graphs. This motivates us to further extract strongly connected structure from positive relationship graphs. Accordingly, we cast the problem of detecting opinion spammers as the problem of finding strongly, positively connected communities (Fig. 1(c)).
More formally, a strongly connected component
∃ at least two vertices in
Each positive relationship graph can have multiple strongly positively connected subgraphs and each subgraph can be seen as a strongly positively connected community. These strongly positively connected communities will be considered as possible spammer candidates, referred as anomalous positive communities. Note that in Stage 1, we exclude stronger relationships, not users, from the lower strengths of graphs. Consequently, some user may appear in multiple general relationship graphs. However, we shall show that the behavior of users in different strengths of anomalous positive communities shows significant differences from each other in the following sections.
Based on the anomalous positive communities identified in Stage 3, the goal of Stage 4 is to identify the positive and negative spam targets of these anomalous communities. To do so, in Stage 4, we focus on the outgoing relationships of the anomalous communities and use the positive and negative outgoing relationships extracted in Stage 2 (as illustrated in Fig. 1(d)). More specifically, based on the positive outgoing relationship graphs extracted in Stage 2, we identify the positive targets of the anomalous communities discovered in Stage 3; and based on the negative outgoing relationship graphs extracted in Stage 2, we identify their negative targets.
Amazon datasets and three types of reviewers
Amazon datasets
Amazon Datasets
Amazon Datasets
Table 1 summarizes the datasets used in this research. They are collected from four popular categories from Amazon: Books, Movies, Electronics, and Tools. In this research, we investigated the characteristics of the discovered reviewers in each of the four categories individually and across the four categories, referred as Across. As the same patterns and observations were found across all categories, in the following we only report results on one individual category, Books, and Across datasets and primarily discuss results from the Across dataset.
We compare three types of reviewers: the discovered reviewers identified by our approach, the top reviewers recognized by Amazon, and the total reviewers that include all reviewers appearing in the corresponding datasets.
The number of discovered reviewers in each category
The number of discovered reviewers in each category
The average numbers of reviews of the three types of reviewers are shown in Fig. 3: one line per type. The x-axis represents the strength of the discovered communities in descending order (strongest on the left); the y-axis represents the average number of reviews submitted. Since the top and the total reviewers are fixed, their average numbers of reviews are constant and do not depend on the strength of the relationship. For comparison reason, they are represented as flat lines: squared and dashed for the top reviewers and the total reviewers respectively.
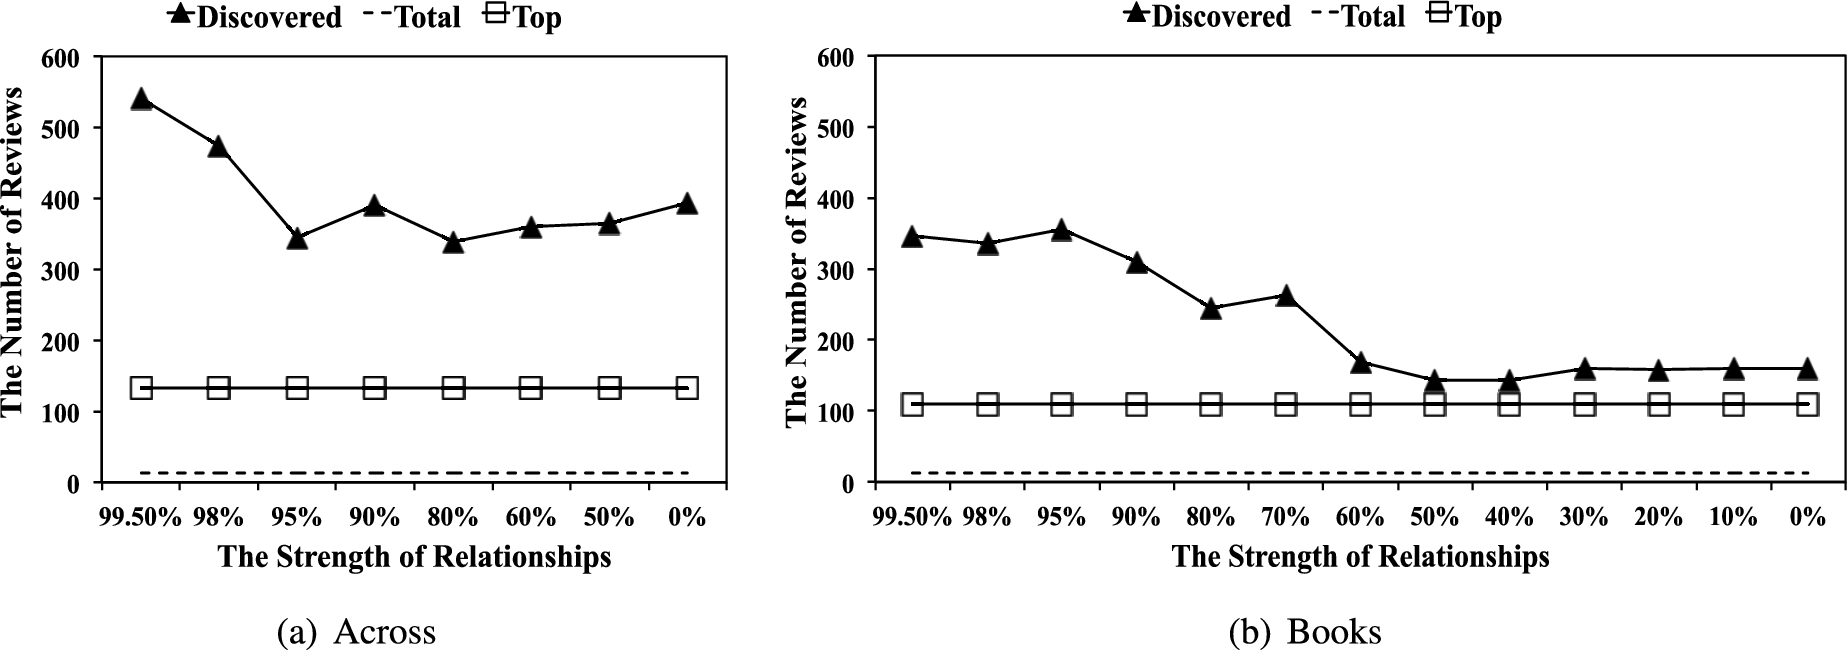
The average number of reviews (RNUM) in each category.
Figure 3 shows that on average our discovered communities and the top reviewers post more than 100 reviews while the total reviewers post less than 10 reviews. The latter result agrees with the results from prior research: the majority of reviewers only writes a few reviews [47,48]. One important observation from Fig. 3 is that both our discovered reviewers and the top reviewers are very active and more importantly, our discovered reviewers are seemingly to be even more active than the top reviewers across all the strengths. For instance, in the Across dataset,
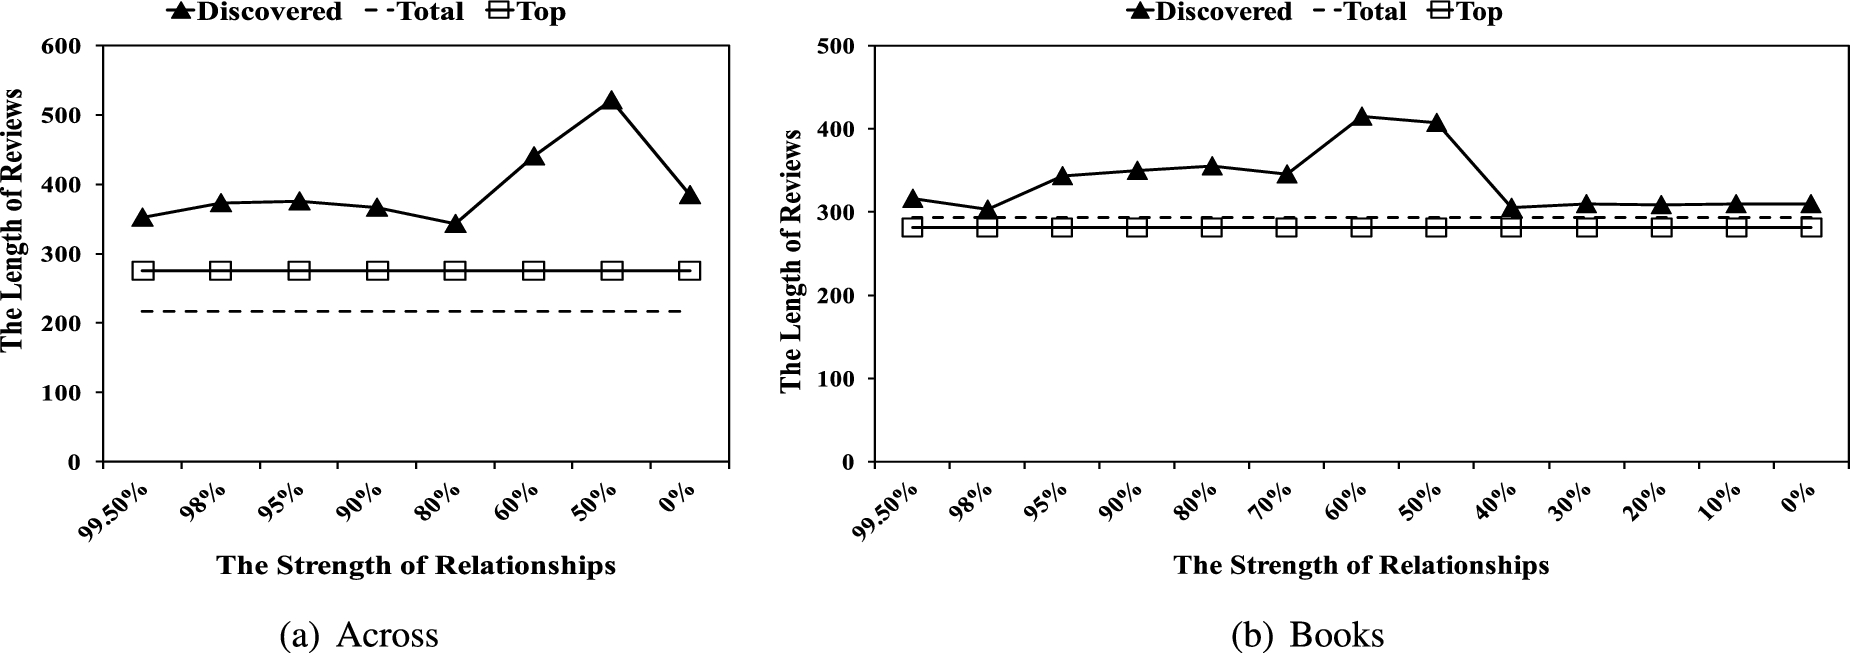
The average length of reviews (RLEN) in each category.
We also measured the length of each review by counting the number of words in the review. Figure 4 shows the average lengths of reviews submitted by the three types of reviewers: one line per type. The x-axis represents the strength of the discovered communities; the y-axis represents the average lengths of reviews submitted. Similar to Fig. 3, for comparison reason, the lengths of reviews of the top and total reviewers are represented as flat lines: squared and dashed respectively.
As shown in Fig. 4, on average the length of reviews submitted by the three types of reviewers do not show significant differences ranging from 200 to 400 words except those in the 50% and 60% communities in Across dataset. This result agrees with the results from prior research: the distribution of the lengths of reviews including spam and non-spam reviews do not show significant differences [20,34]. On the other hand, the reviews by the reviewers in 50% and 60% communities are relatively longer than the reviews by other types of reviewers. One possible reason might be that the reviewers in 50% and 60% communities are active reviewers who not only post genuine reviews but also discuss items more in detail, which will further be discussed in the following sections.
In this section, we compare the behavior of the three types of reviewers. Our goal is to show that although the discovered reviewers can appear to be as “helpful” as Amazon’s top reviewers (in terms of positive vote ratio in Section 5.1), they are strong spammer candidates (in terms of verified purchase ratio in Section 5.2 and various spammicity indicators in Section 5.3). We thus focus primarily on comparing our discovered reviewers with top reviewers in this section.
Positive vote ratio (PVR)
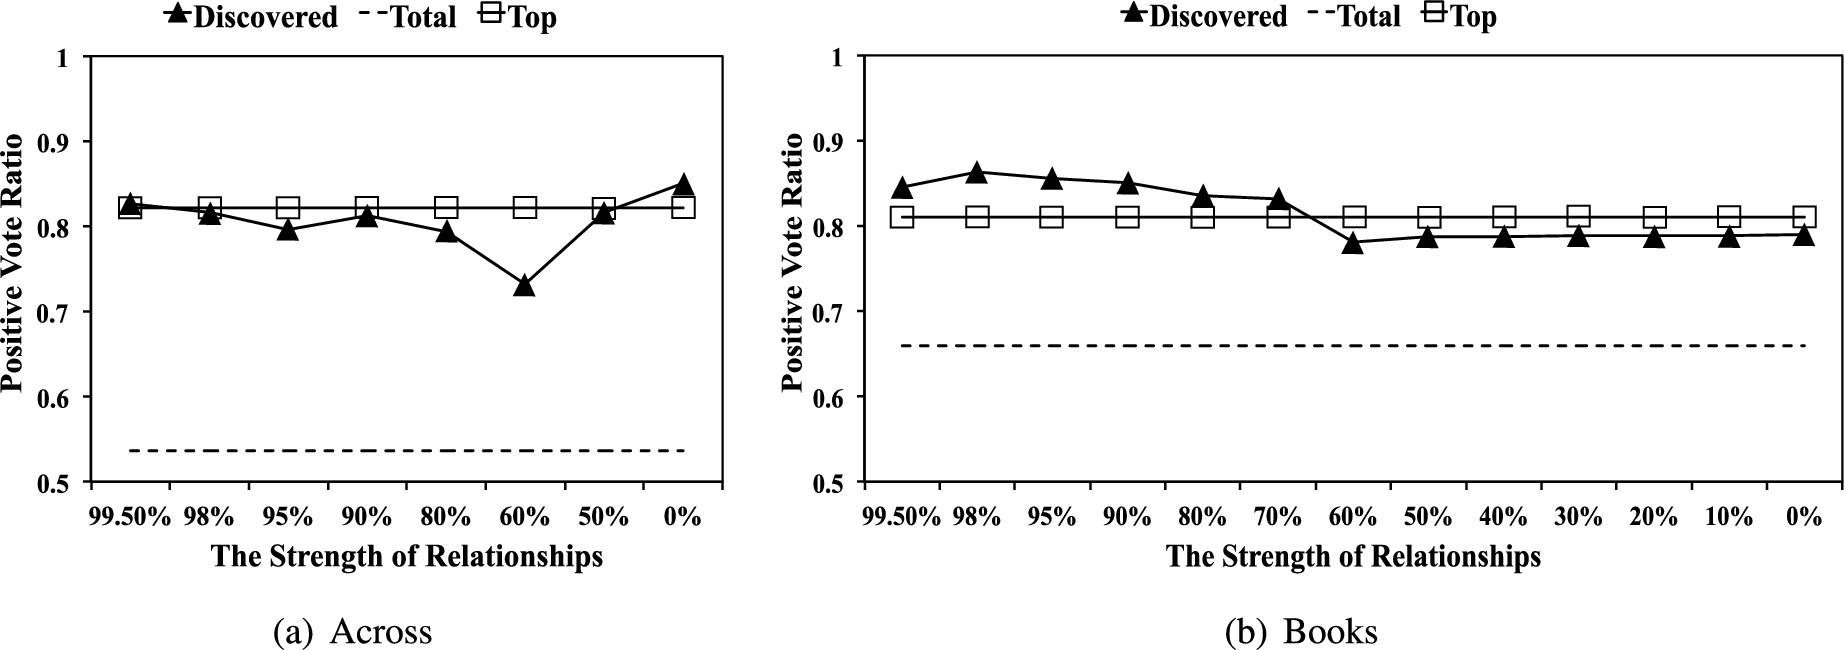
Positive vote ratio (PVR) in each category.
One important assumption of this research is that opinion spammer groups would maliciously and artificially boost their reviews to increase the impact of their reviews. As reviews marked as helpful can often be more influential, we define the
Figure 5 shows the average PVRs of the three types of reviewers. Again for comparison reason, the average PVRs of all three types of reviewers are shown in the graph: one line per type. The x-axis represents the strengths of the discovered communities; the y-axis presents the average PVR. The top and the total reviewers’ PVRs are represented as flat lines: squared and dashed lines respectively as their values do not depend on the strength of the relationship. As shown in Fig. 5, the PVRs of the discovered reviewers are relatively high and in fact, they are close to the PVR of the top reviewers. That is, their average PVR is close to 80% across the strengths of the communities. The only exception is that 60% community in the Across dataset has the lowest PVR around 70%. Both types of reviewers (i.e., discovered and top reviewers) have much higher PVRs than the total reviewers whose PVRs are closer to 55% for the Across dataset and 65% for the Book dataset. This indicates that the reviews of discovered reviewers do indeed appear to be as “helpful” as those of the top reviewers.
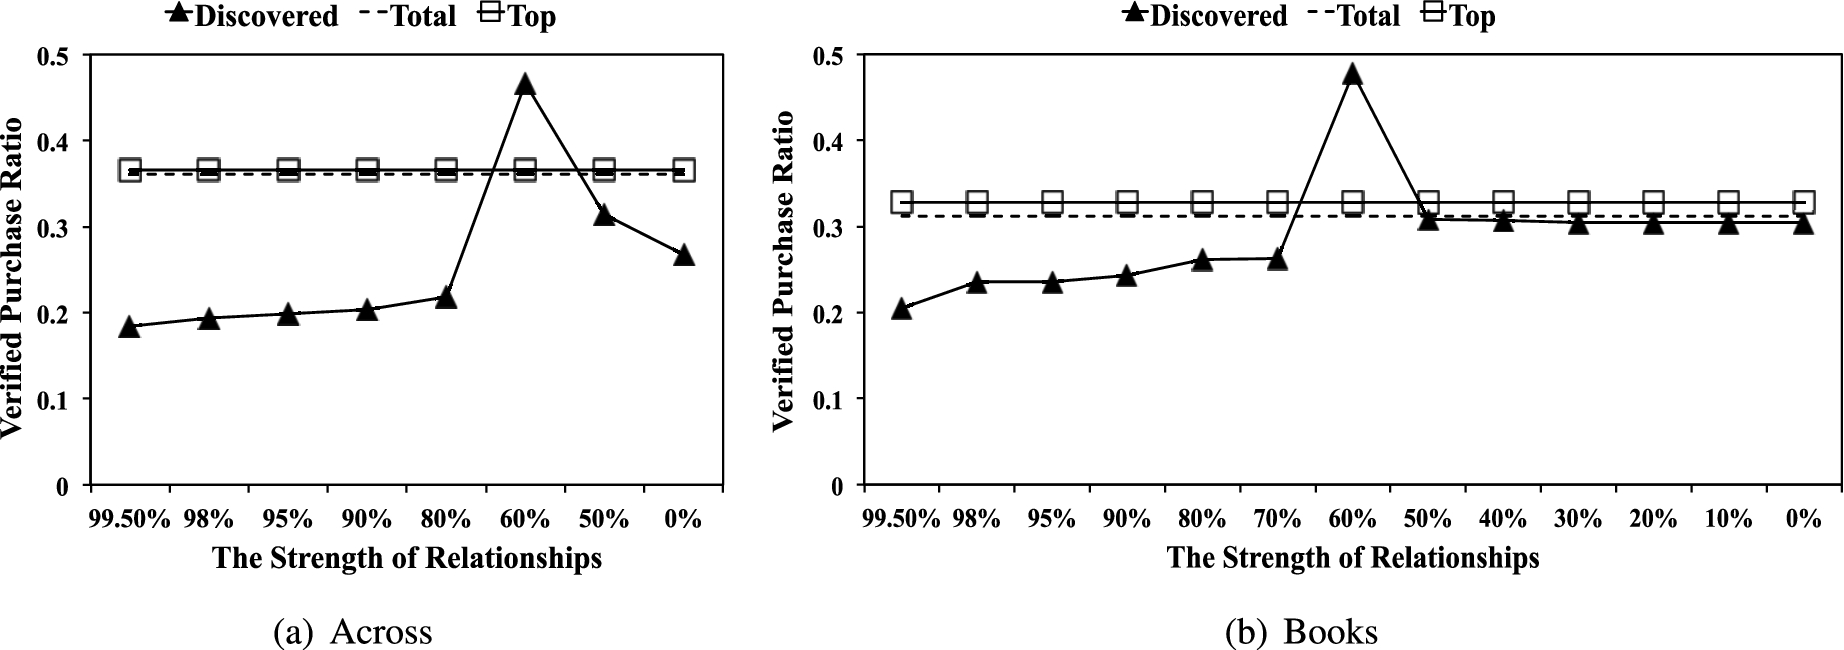
Verified purchase ratio (VPR) in each category.
Amazon would tag a review with “Verified Purchase” if the reviewer made a purchase through Amazon. Given the amount of efforts and monetary involved in actual purchase, we hypothesize that spammer groups are less likely to actually purchase the item than the non-spammers [18,22,28]. We therefore define the
Figure 6 shows the average VPRs of the three types of reviewers. The x-axis represents the strengths of the discovered communities; the y-axis presents the average VPR. The top and the total reviewers’ VPRs are represented as flat lines: squared and dashed lines respectively as their values do not depend on the strength of the relationship.
Interestingly, Fig. 6 shows that there was no difference between the top and the total reviewers in terms of their VPRs. In other words, the top reviewers were no more likely to purchase the reviewed item than normal users, while the former’s reviews are more helpful as shown in Fig. 5. As we expected, our discovered reviewers, especially those in the
Another interesting phenomenon is that in both Across and Books datasets, the 60% communities show slightly higher VPRs than the other two types. Our hypothesis is that our discovered 60% communities include active yet non-spam reviewers who form natural communities based upon their genuine similar interests [8]. This might also explain that the lengths of reviews by the reviewers in 60% communities were relatively longer than other types of reviewers (Fig. 4). Specifically, the reviewers in 60% communities might write more detailed reviews based on their actual purchase.
We use nine content-based spam indicators suggested by the existing research [28–30] to examine the level of spammicity of reviewers (i.e., how likely users are to be spammers) across our discovered communities. They will also be compared against other types of reviewers. All the nine spam indicators range from 0 (non-spammers) to 1 (spammers). In the following we will describe each of the measures used and will present the results in a series of plots where: the x-axis demonstrates the strengths of the discovered communities and the y-axis presents the strength of the corresponding measure; and we have one line per reviewer type. Again, the top and the total reviewers’ values are represented as flat lines: squared and dashed lines respectively.
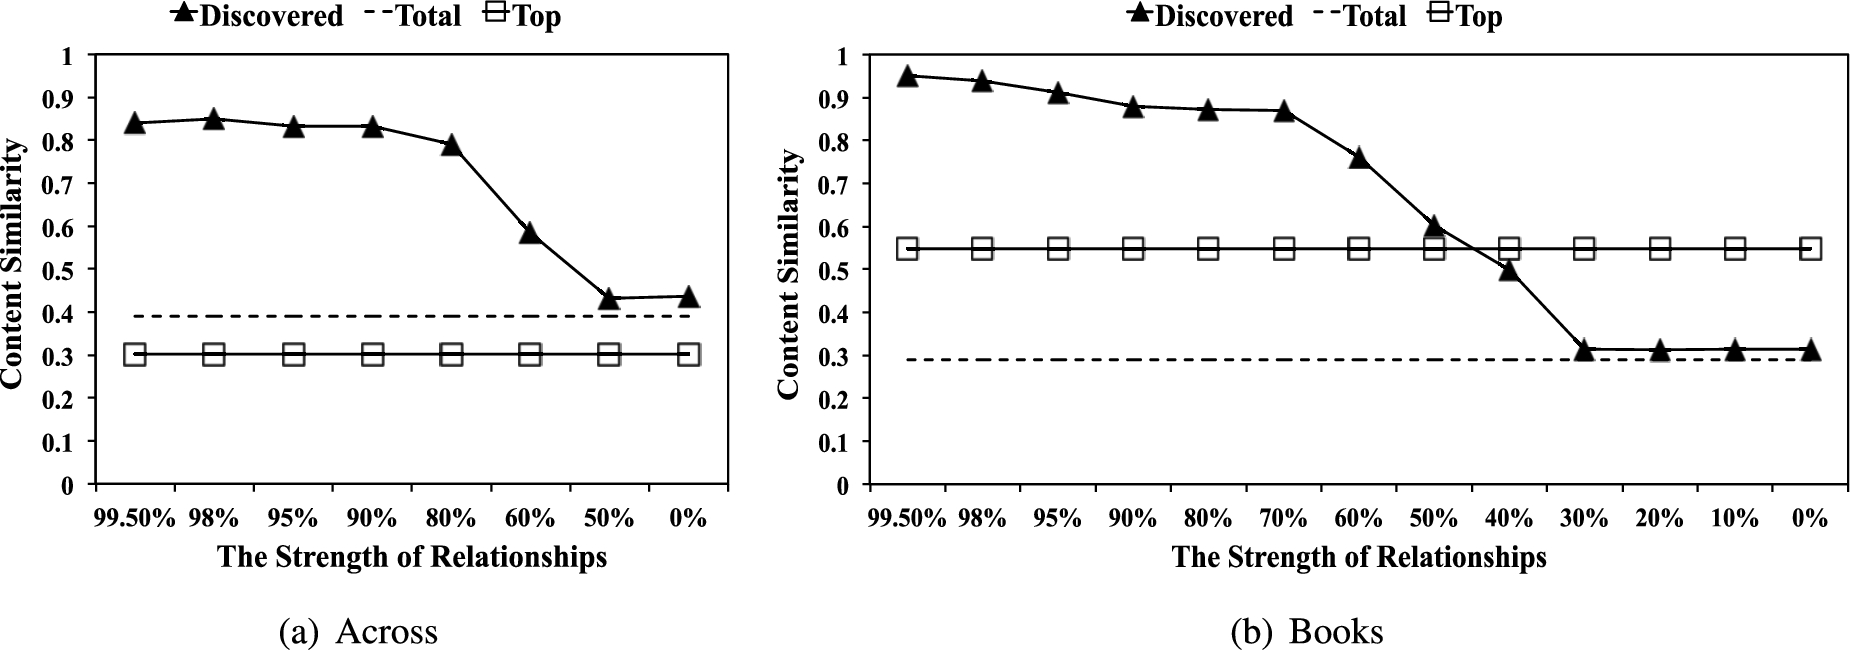
Contents similarity (CS) in each category.
CS measures how similar the user’s reviews are, as spammers often copy their own reviews across items. Following [28–30], we measure the maximum of pairwise content similarities of two reviews by the same reviewer to capture the worst case. Figure 7 presents the average CSs of the three groups of reviewers. Mukherjee et al. stated that the expected value of CS of spammers was 0.7 [28]. As shown in Fig. 7, we observe that the CSs of reviewers in
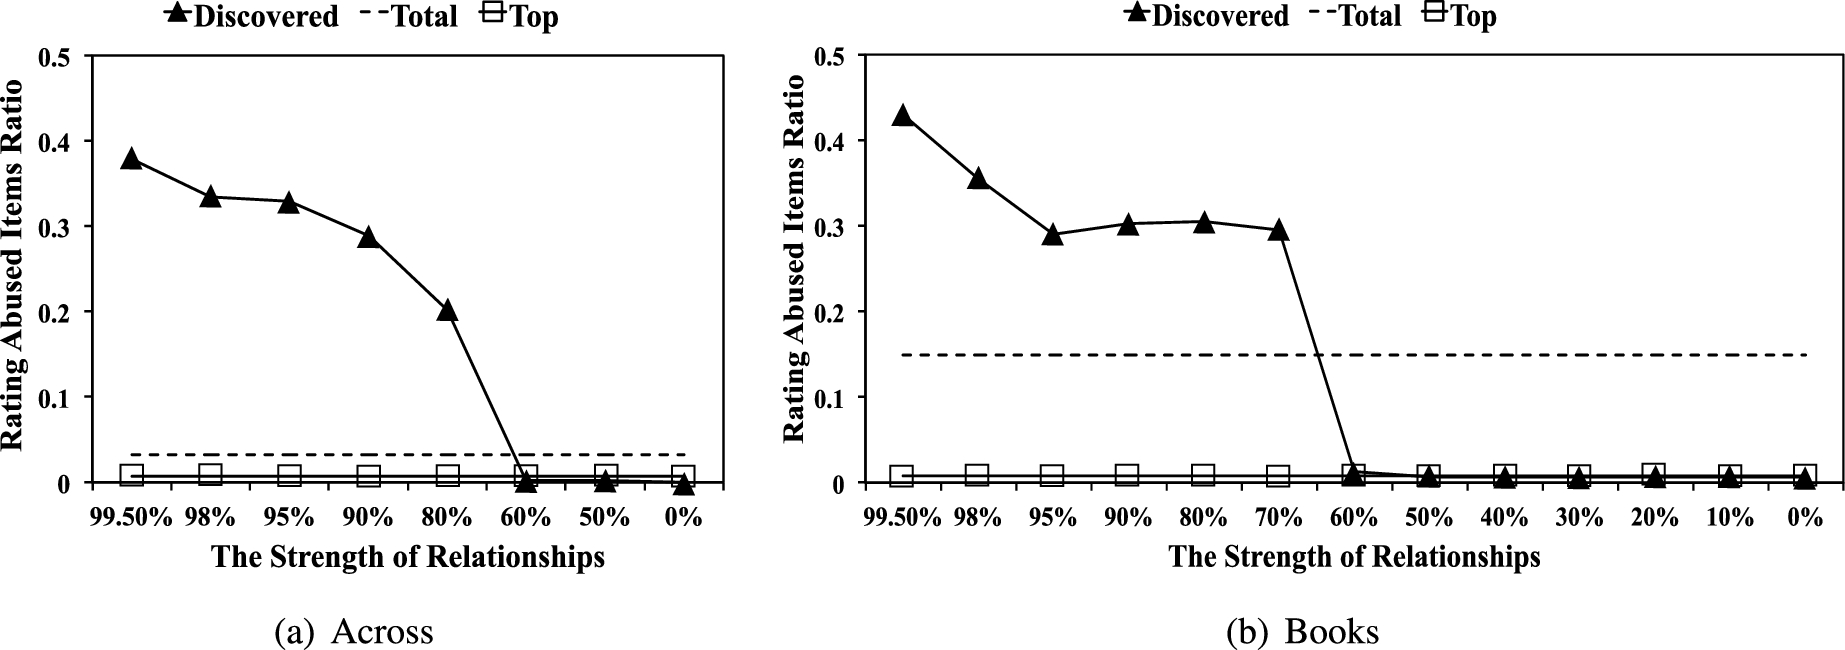
Rating abused item ratio (RA) in each category.
RA checks whether a user posted multiple reviews with similar ratings on the same item, as non-spammers post multiple reviews usually when her opinion changes. Following [28,29], we measure the similarity by computing the difference between the maximum and minimum ratings of each reviewer for an item; and we assume a reviewer abuses ratings, if he/she posts the similar ratings more than twice on the same item. We then measured how many items are involved in rating abuse for each user. Figure 8 presents the average RAs of the three types of reviewers. In general, non-spammers are not likely to involve in rating abuse. Indeed, RAs of reviewers in

Review duplicated items ratio (DUP) in each category.
DUP checks whether a user posts similar multiple reviews on the same item. Although DUP is similar to RA, it focuses on review contents, not ratings. DUP can thus capture similar multiple reviews by a spammer with multiple identifiers. Following [28,29], we assume that reviews are spams if the content similarity between two reviews on the same item is over 0.72, and measure how many items a user is involved in review duplication. In general, non-spammers are not likely to involve in such activities. Figure 9 presents the average DUPs of the three types of reviewers. Indeed, DUP of reviewers in
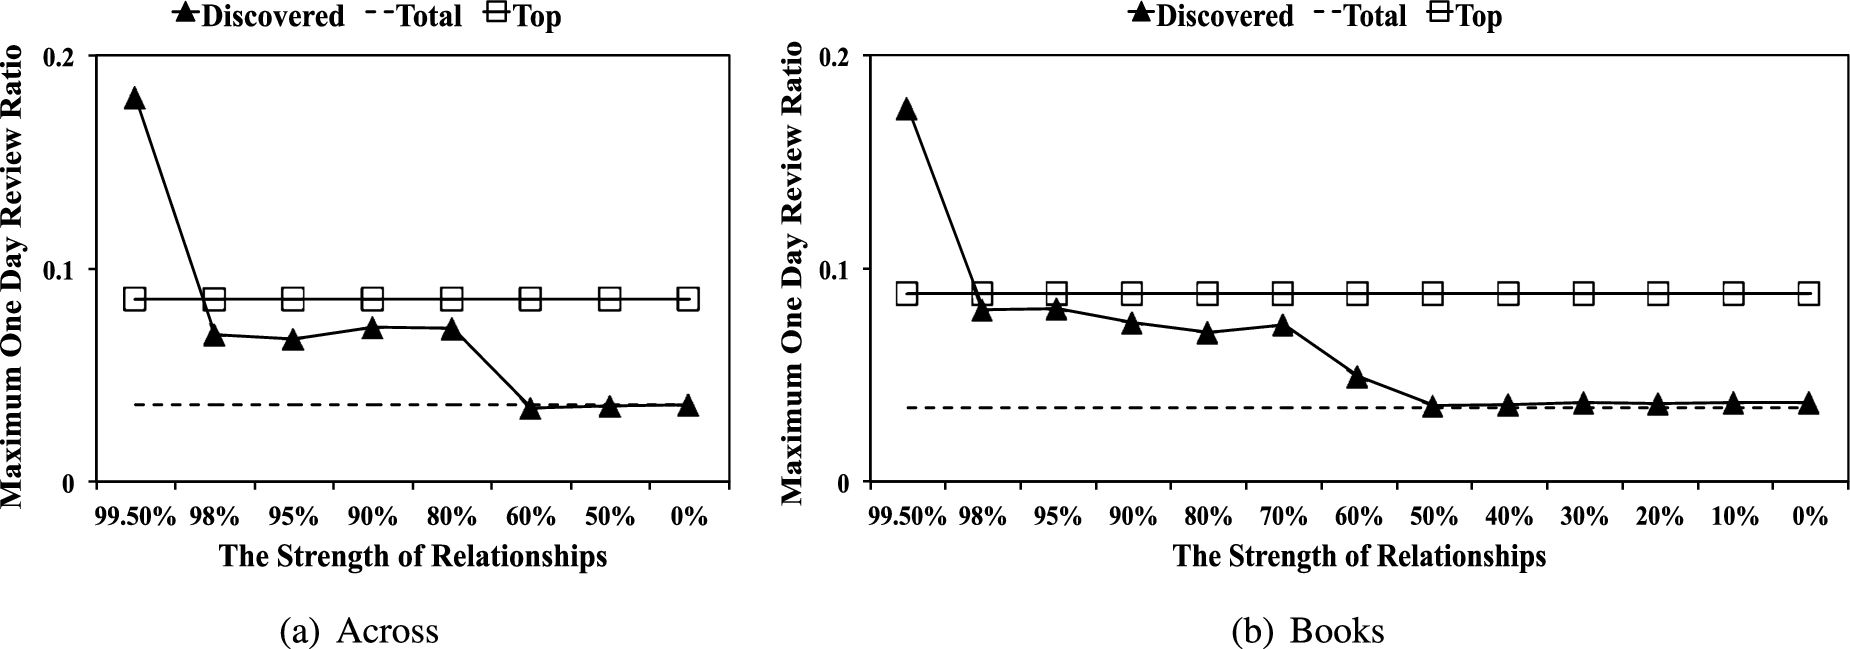
Maximum one day review ratio (MOR) in each category.
MOR measures how many reviews a user posted in one day compared with the maximum across all reviewers, as a massive amount of reviews in one day often looks suspicious. In our dataset, the maximum number of reviews per day were 95 (Books) and 96 (Across), which we can undoubtedly say is suspicious amounts of reviews for a single day. Figure 10 shows the average MORs of the three types of reviewers. Mukherjee et al. stated the maximum number of reviews per day was 21 in their dataset, and the expected MOR of spammers was 0.28 and that of non-spammers was 0.11 (i.e., the expected number of reviews in a day of spammers was
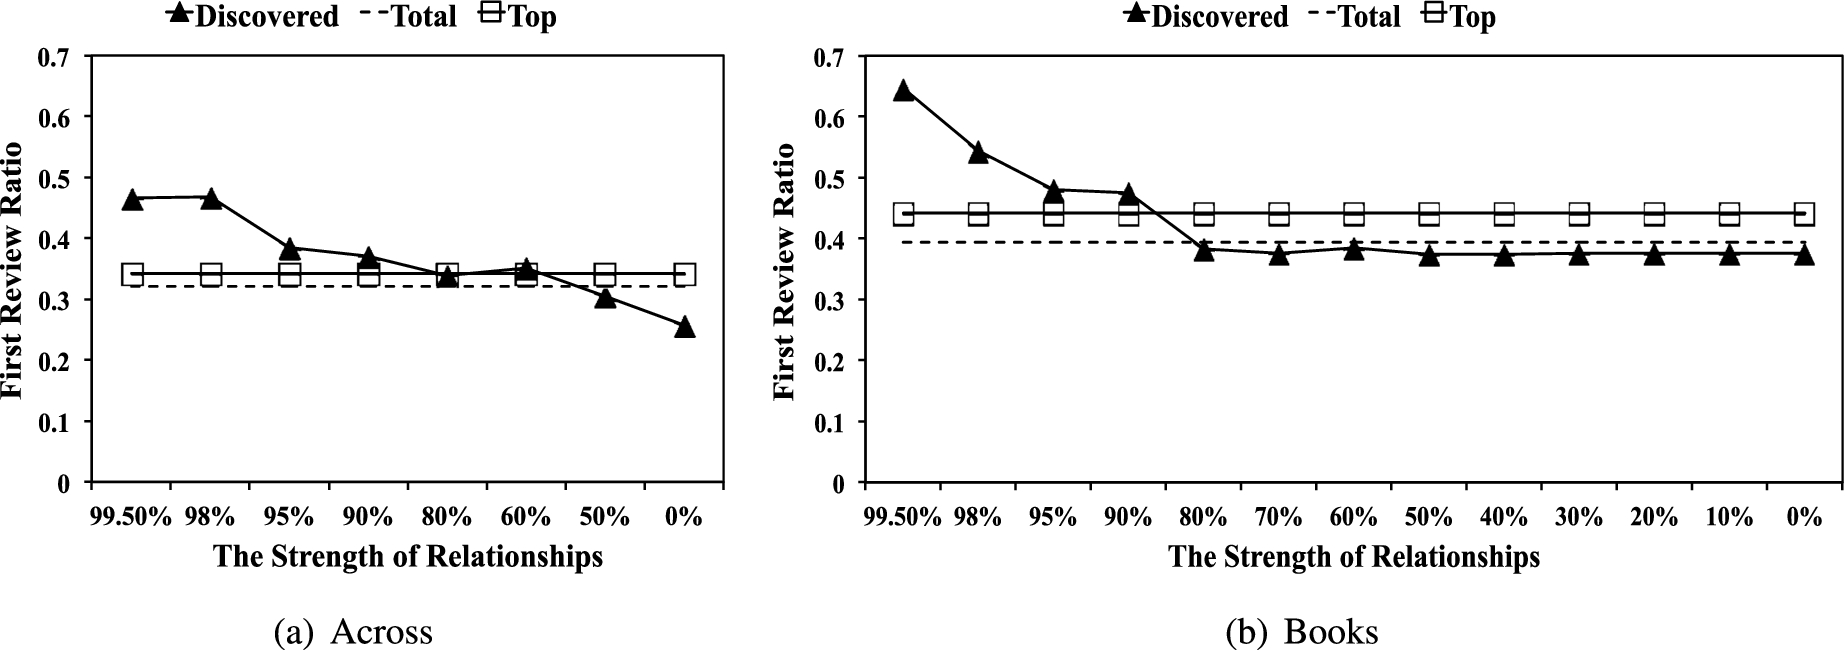
First review ratio (FRR) in each category.
FRR measures how many of user’s reviews are the first review for a item, as spammers often post reviews early in order to maximize the impact of their reviews. Figure 11 presents the average FRRs of the three types of reviewers. As shown in Fig. 11, the top and the total reviewers have very close FRRs overall but for our discovered reviewers, we observe that FRR increases, as the strength of a community increases. Note that this result may simply reflect the fact that reviewers in the higher strength of communities are more active and thus are more likely to author the first review. This may also explain that top reviewers also have relatively high value, compared to total reviewers in Books category. However, the high FRRs for reviewers in
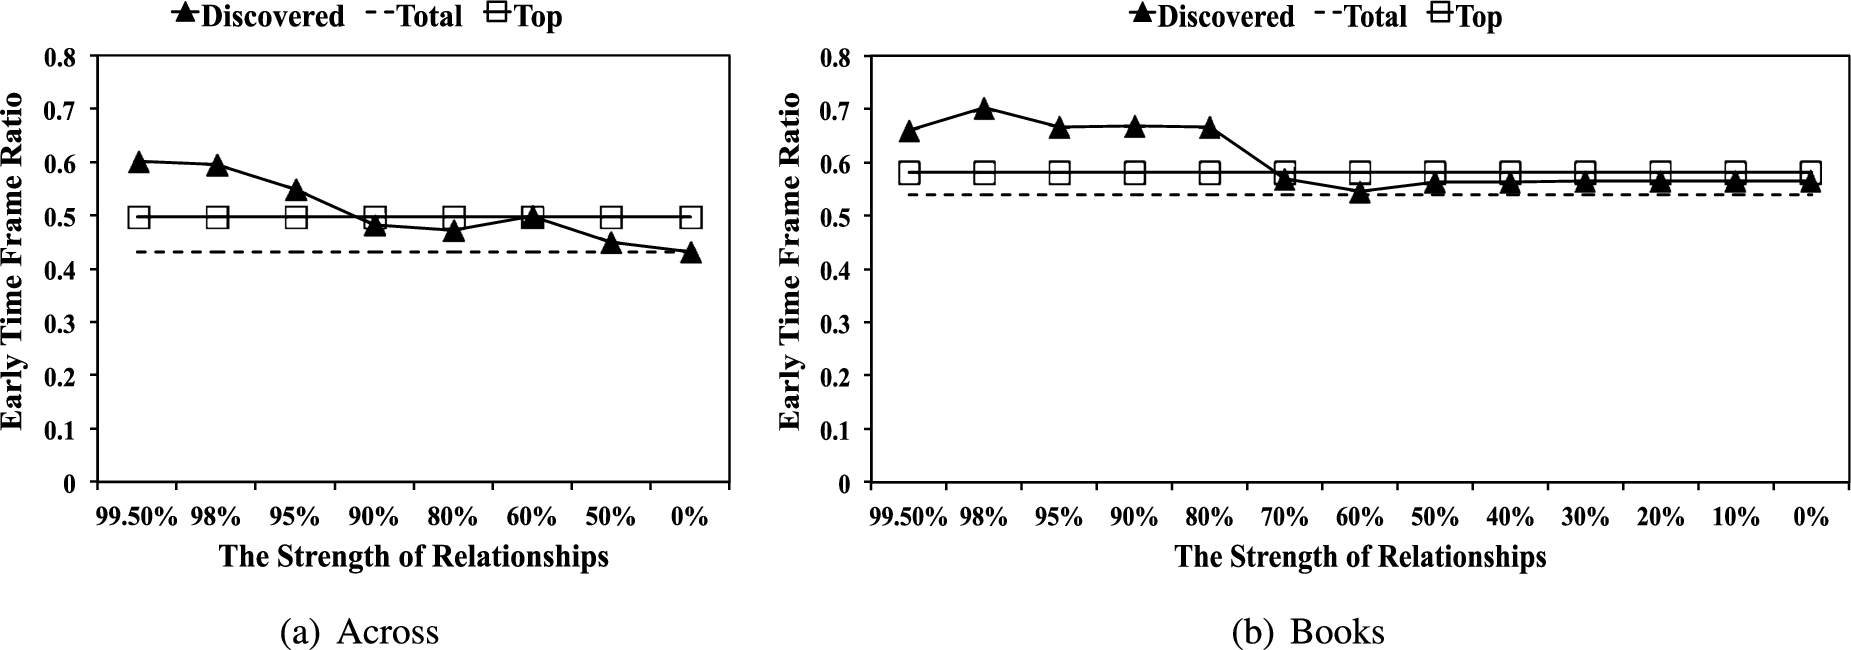
Early time frame ratio (ETF).
ETF measures how early a user reviewed the item. The intuition behind ETF is the same as for the FRR, because if not the first review, earlier reviews may have a bigger impact. Mukherjee et al. estimated the appropriate threshold to decide whether the review is written early [28,29]. We employed the same threshold (0.69), and measured the percentage of a user’s reviews that were written early. Figure 12 shows the average ETFs of the three types of reviewers. As shown in Fig. 12, we observe similar results to FRR in that ETF increases as the strength of a community increases, especially for
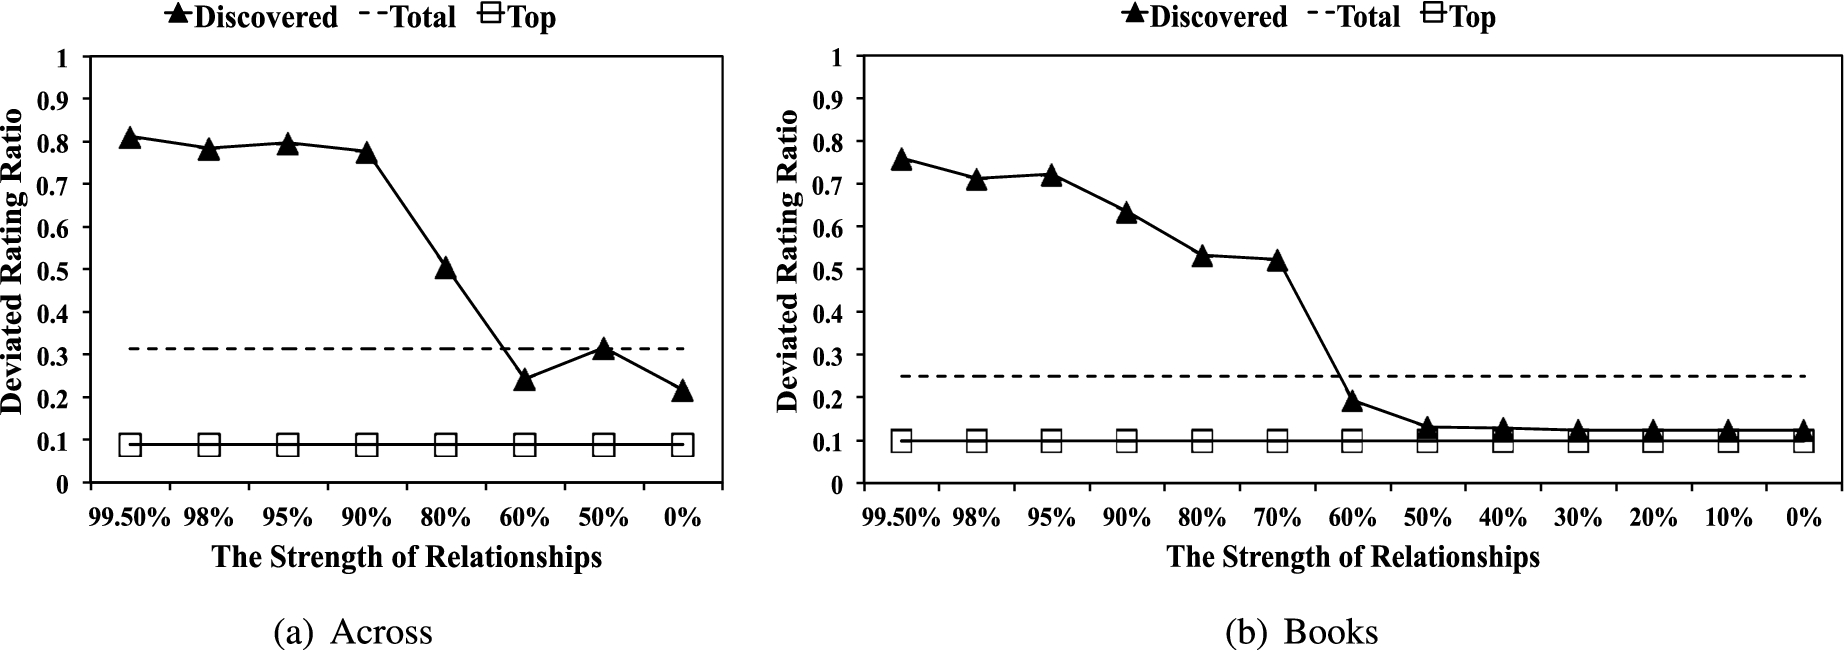
Deviated rating ratio (DEV) in each category.
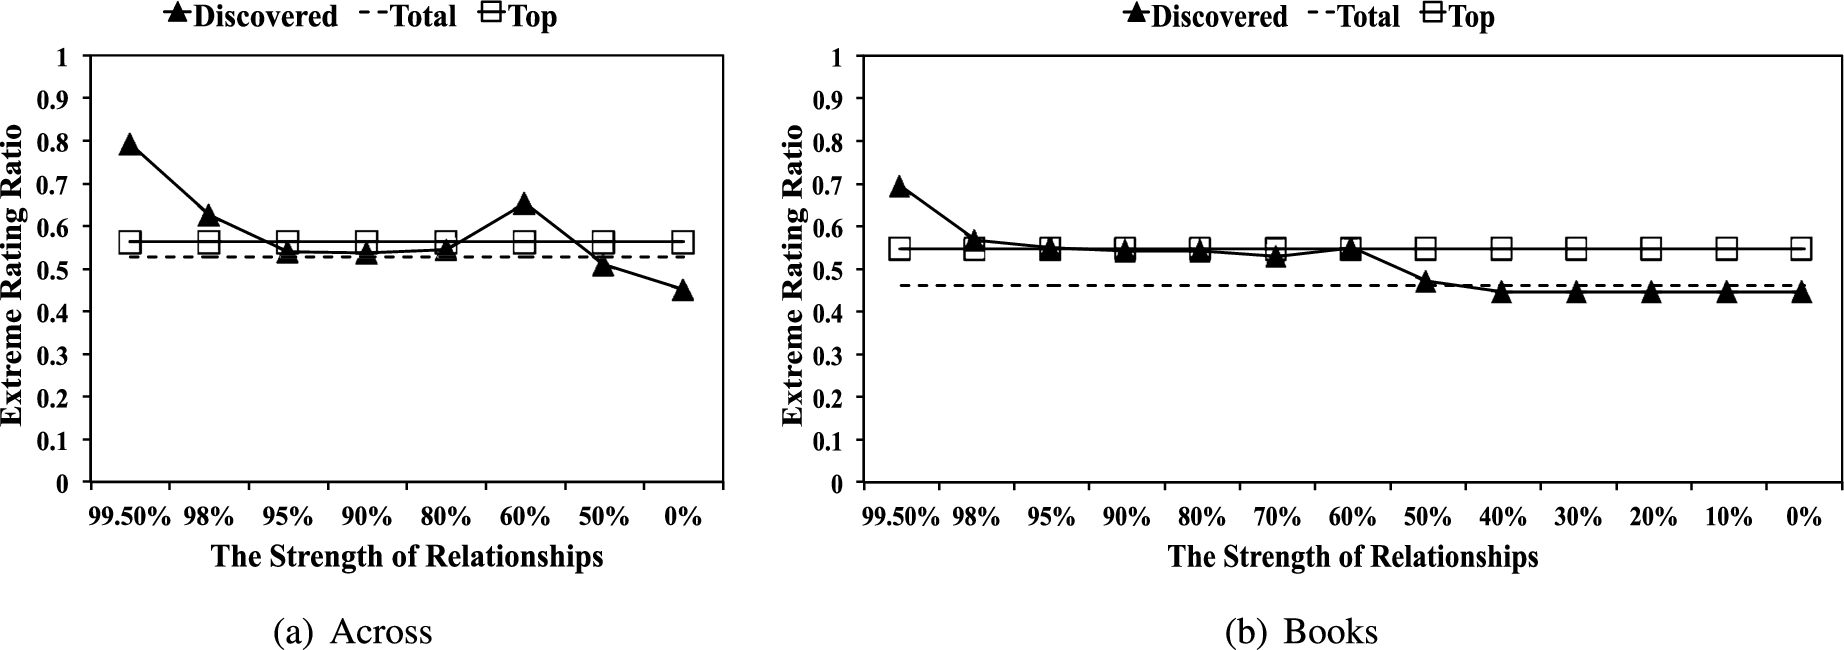
Extreme rating ratio (EXT) in each category.
DEV checks the difference between a user’s rating and the average rating of other users on the same item, as spammers often try to inflict incorrect projections which deviate from the common consensus. We employed the same threshold of 0.63 used in [28,29] to decide whether a rating is deviated, and measured the percentage of a user’s reviews that are deviated. Figure 13 shows the average DEVs of the three types of reviewers. Note that DEV of the top reviewers is the lowest. This suggests that top reviewers’ reviews are actually reliable or consistent with others’ perceptions, whereas most reviews by reviewers in the
Extreme rating ratio (EXT)
EXT measures whether a user’s rating is extremely high or low, as spammers are likely to post extreme ratings while non-spammers post more moderate product-specific ratings. Since ratings range from 1 to 5 on Amazon, we consider 1 and 5 as extreme rating, following [28,29], and measured the percentage of a user’s reviews having extreme ratings. Figure 14 shows the average EXTs of the three types of reviewers. We observe that the EXTs of reviewers in
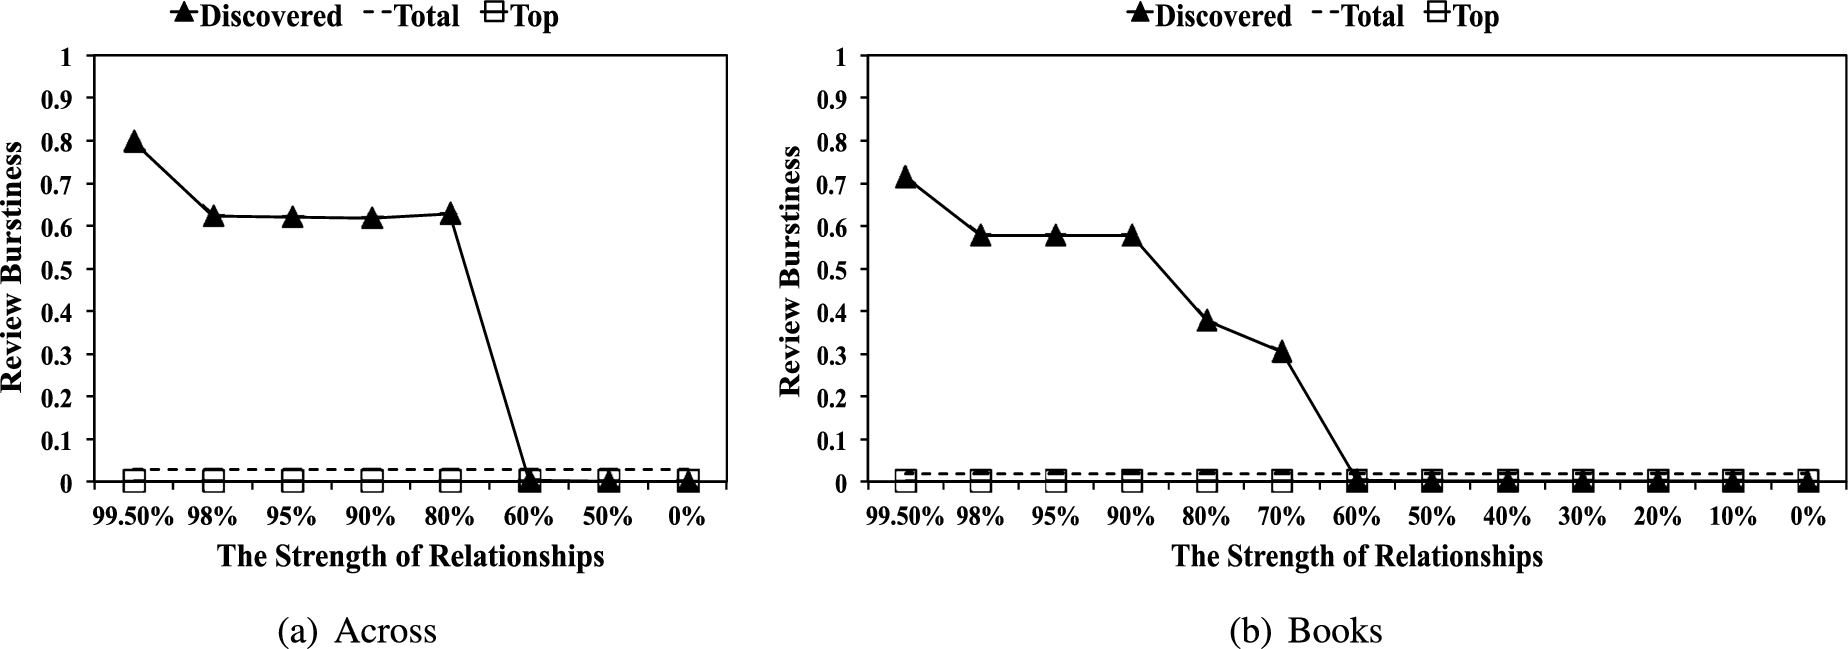
Review burstiness (BST)
BST measures the interval between a user’s first and last reviews, as spammers often post reviews in a short period of time. Mukherjee et al. compared each reviewer’s history with an estimated threshold of 28 days [28,29]. The shorter the interval, the larger the burstiness. Burstiness was 0 if a reviewer has a history equal to or longer than 28 days. Figure 15 shows the average BSTs of the three types of reviewers. Note that top reviewers are expected to be valued customers who have a relatively long history with high-quality reviews. Indeed, top reviewers have the lowest BSTs (close to zero) as shown in Fig. 15. By contrast, we observe that reviewers in the 80% and 99.5% communities have rather high BST scores. Recall that both the top reviewers and the discovered reviewers in the 80% and 99.5% communities have high PVRs, but the BST score analysis suggests that the latter are likely to be spammers since they do not have a long history but collect many positive comments in a short period of time to appear to be very “helpful”.
Review Burstiness (BST) in each category.
In short, our findings from Verified Purchase Ratio (VPR) and the nine spammicity indicators show that: there is a clear distinction in terms of VPR and each spammicity value between reviewers in the
In sum, in this section we have shown that although the reviewers in our discovered communities appear to be as “helpful” as the top reviewers and much more helpful than the total reviewers, the strongly, positively connected
Comparing to two state of the art spammer classifiers
In Section 5, we have discussed discovered reviewers have distinctive characteristics in terms of spammicity values. In this section we show the correlation between the strength of each community and the probability of being spammers. Our goal is to suggest a way to incorporate distinctive characteristics of different strengths of communities for spammer detection, and to show the effectiveness of our community-based scheme. The most direct way to evaluate our approach is to compare our detection process to the state of the art content-based classifier with Amazon ground-truth dataset. However, after several attempts, we were unable to obtain access to Amazon datasets with ground-truth labels used in previous research such as [28,29]. Therefore, we will compare our discovered reviewers against reviewers classified as spammers by two state of the art classifiers: a linguistic model-based classifier proposed in [34] and a spam indicators-based classifier proposed in [28].
Comparing to a linguistic model-based classifier
Ott et al. trained a series of machine learning models based on ground truth set including truthful reviews extracted from TripAdvisor and spam reviews written by Turkers [34]. Given the high accuracy reported in [34], we investigated whether their models can be directly applied to estimate the spammicity of reviews on Amazon. Among their proposed machine learning models, we employed unigram Naive Bayes Classifier given its high performance in [34]. Strictly following [34], a 5-fold cross validation procedure was performed and the rest of details can be found in [34].
As Ott et al.’s approach focused on review contents, we used the Naive Bayes Classifier to calculate a fake probability for each review and based on them, we measured the spammicity of discovered reviewers. More specifically, we define the fake probability of a reviewer as the average fake probability of all of his/her reviews, and average over all the reviewers in a group to calculate the average fake probabilities of the group. Figure 16 shows the average fake probabilities of the three types of reviewers. The x-axis represents the strengths of the discovered communities; the y-axis presents the average fake probability.
Figure 16 shows that in Across dataset, we see the fake probability increases as the strength of communities increases. However, the average fake probability of top reviewers was also relatively high, compared to that of total reviewers. This result is seemingly inconsistent with our assumption that top reviewers are trustworthy. Figure 16 also shows that in Books datasets, we could not find any clear patterns in terms of the fake probability when varying the strength of communities. Moreover, the fake probabilities of the three types of reviewers are very close to each other, around 0.5.
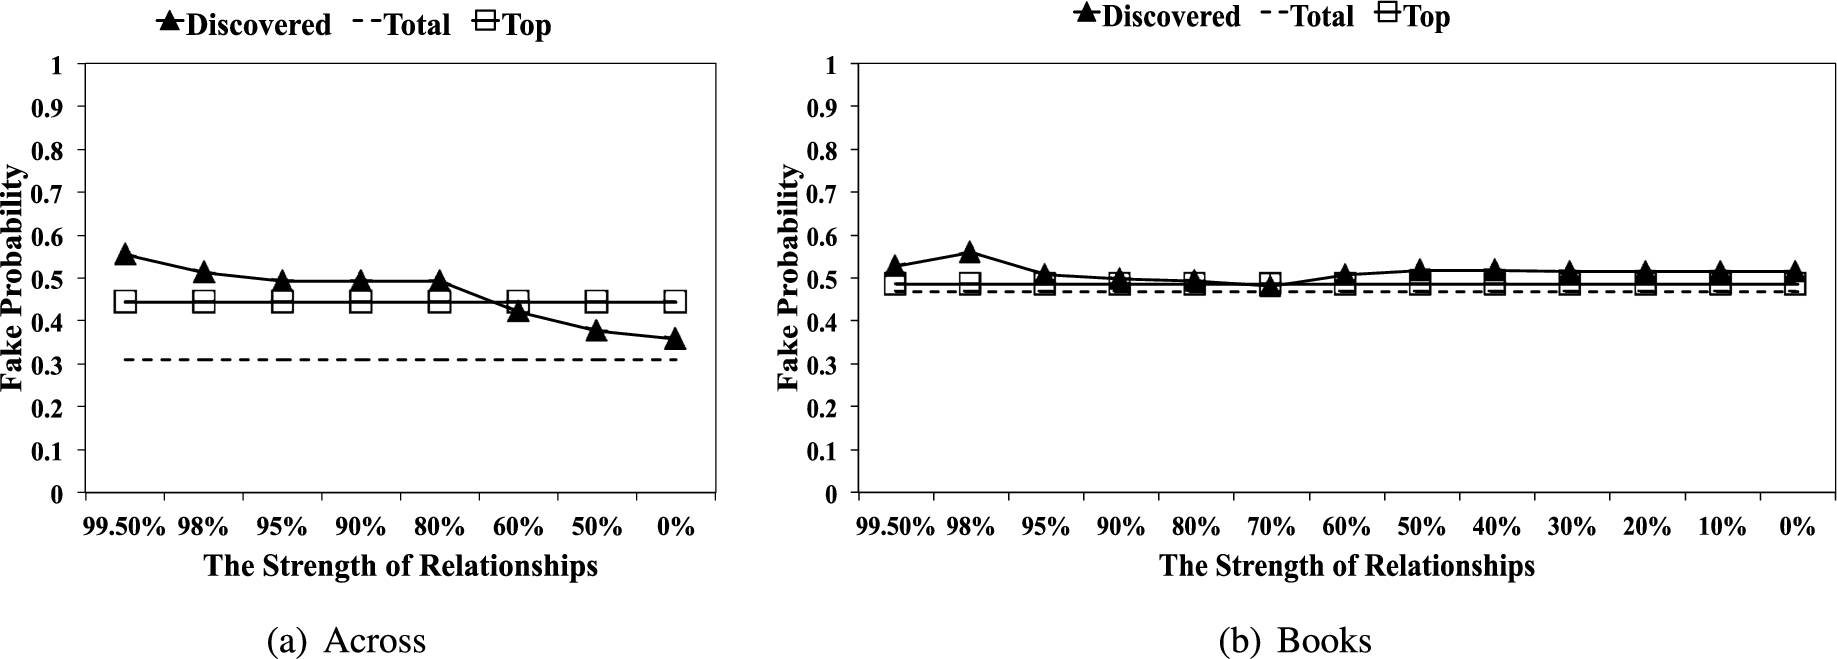
Fake probability in each category.
To compare our classification results to that of the linguistic model-based classifier, we additionally sort all reviewers based on the fake probability calculated by the linguistic model-based classifier in descending order, and assume that top ranked reviewers are spammers and bottom ranked reviewers are non-spammers. As previous work reported 15% spam ratio in TripAdvisor, we assume that top and bottom 15% ranked reviewers can be classified as spammers and non-spammers respectively [32,34]; which is used for “pseudo ground-truth labels”. We believe this is a plausible approach without ground-truth labels for spammers, as a reviewer will be more likely to be spammers if most of her reviews has high probability to be spams, in turn, resulting the high average fake probability [28]. Then we compare the correlation between discovered reviewers and the “pseudo ground-truth labels”.
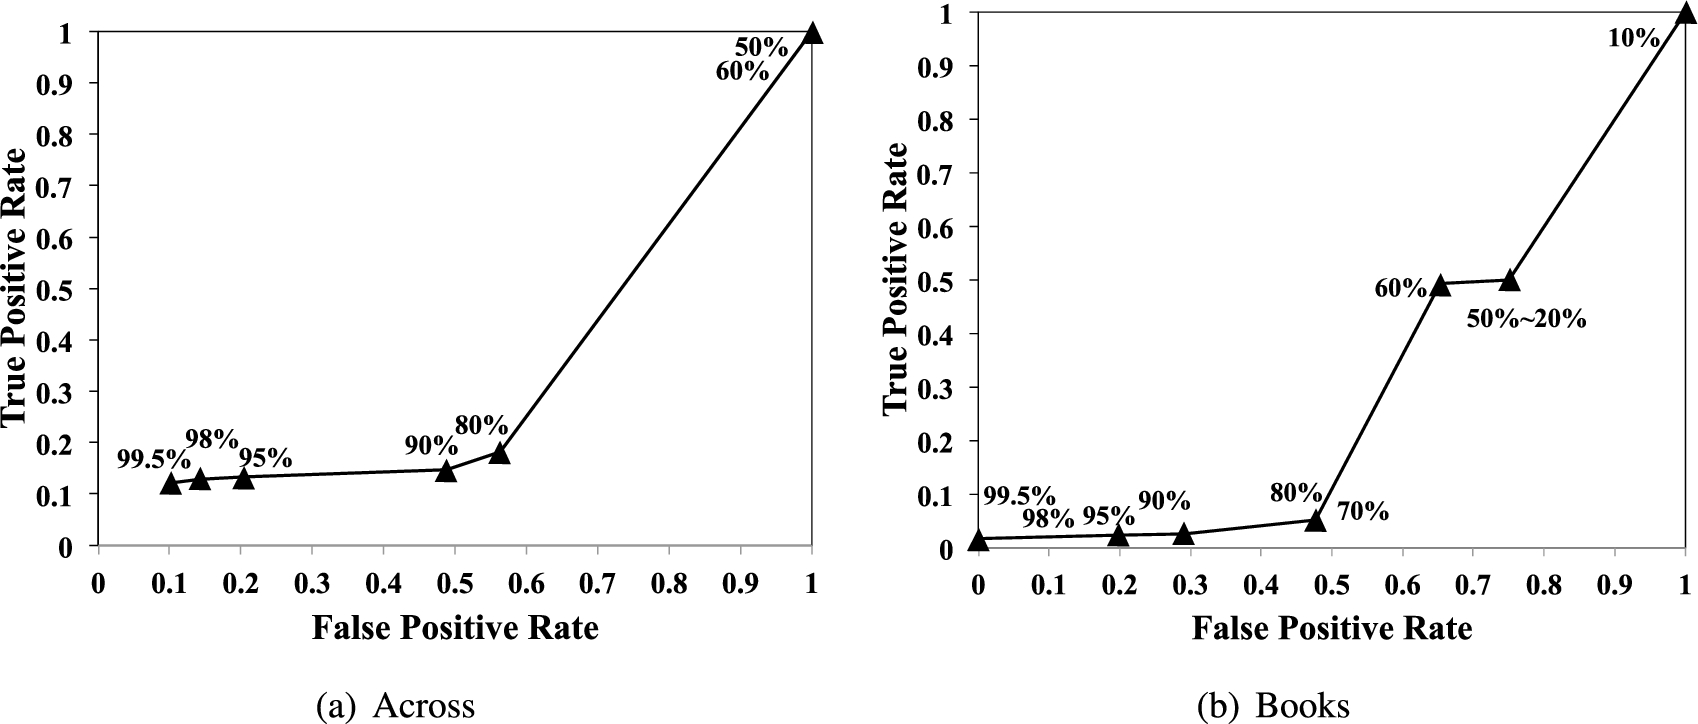
Modified community-strength based ROC curve using the linguistic-based classifier.
Figure 17 shows modified ROC curves by varying community strengths as thresholds to define spammers. Here we assume that reviewers in communities with strengths greater than or equal to τ are spammers; those in communities with strengths less than τ are non-spammers. For example, a point labelled as 90% represents that we assume reviewers in
However, we argue that these results are due to 1) the fact that their spam reviews are written by Turkers; and 2) the difference between the linguistic features of Amazon and TripAdvisor reviews. In other words, the linguistic features that work for TripAdvisor reviews may not work for Amazon ones. More specifically, the Naive Bayes Classifier proposed in [34] extracts features that would most significantly differ spam reviews from the truthful ones based on the word frequency. For example, in their data the words “expensive” and “accommodations” tend to appear in truthful reviews seven and nine times more often than in spam reviews respectively. However, while “expensive” can appear in both truthful and spam reviews in multiple domains including our Amazon datasets, “accommodations” may be very less likely to be shown in some domains such as book and movie reviews. Indeed a few researchers suggested the linguistic model-based classifier does not work well in some applications including Yelp [30].
To summarize, our results suggest that the linguistic model-based classifier as a form of content-based classifiers, tends to be domain specific. In order to verify our community-based scheme against content-based classifiers, we thus focus on a content-based classifier developed for Amazon datasets, which will further be discussed in the following section.
Mukherjee et al.’s spam indicators-based approach is the state of the art content-based classifier shown to have high accuracy over Amazon dataset with ground truth labels [28]. To compare our classification results to that of their spam indicator-based classifier, we generated a “pseudo ground truth labels” by applying the classifier to our Amazon dataset. In particular, following [28,29], we assume that when reviewers are ranked in descending order based on the sum of nine spammicity values (Section 5.3), top and bottom 5% ranked reviewers can be classified as spammers and non-spammers respectively in an unsupervised setting. We then show that our community-based approach reliably identifies opinion spammers even when pure content-based classifiers fail, and achieves the same level of accuracy as state of the art pure content-based classifier.
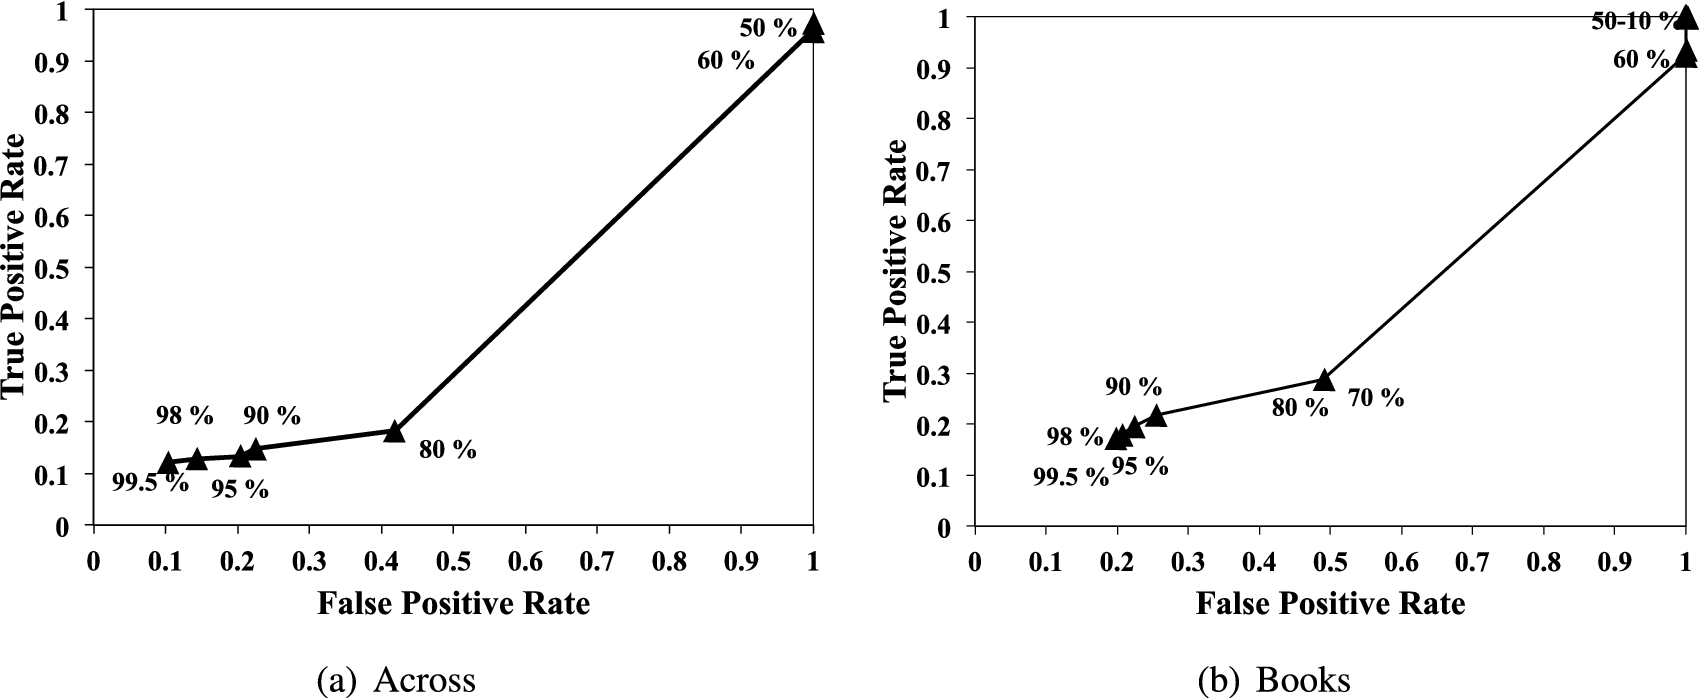
To measure the accuracy, we again plot the modified ROC curve by varying different strengths as thresholds to define spammers. Figure 18 shows the modified community-strength based ROC curve where the x-axis represents the false positive rate and the y-axis represents true positive rate. Each point represents true positive rate against false positive rate given
When
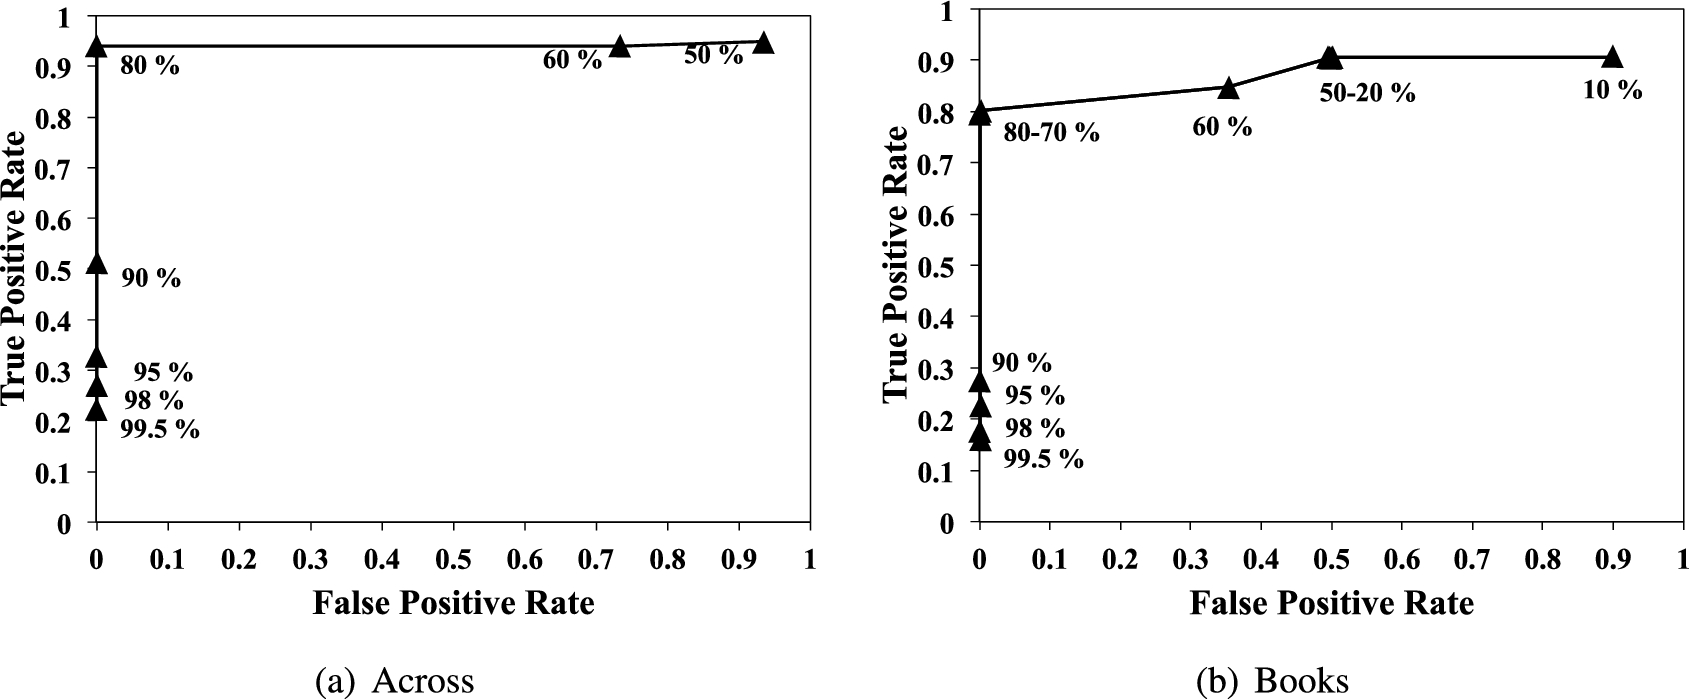
Modified community-strength based ROC curve using the spam indicators-based classifier.
On the other hand, when we use 60% or less strengths as a threshold, the false positive rate dramatically increased (over 0.7), meaning that
Note that we get the best result (i.e., 0% false positive rate and high (close to 100%) true positive rate), when 80% is used as a threshold; and the classifying results get worse with thresholds lower than 80%. This implies a clear distinction between reviewers in
In short, our findings from the modified community-strength based ROC analysis can be summarized as follows. First, our analysis suggests that while strongly positively connected communities may be naturally constructed with different strengths, communities with a strength higher than 80% are strong spammer candidates. Second, we have shown that there exists a great correlation between the strength of communities and content spammicity. In fact, we have shown that we could achieve 0% false positive rate and nearly 100% true positive rates using 80% as a threshold. However, by no means do we claim that our classification using 80% as threshold is almost perfect with 0% false positive rate and nearly 100% true positive rates; as the accuracy was measured by comparing to the pseudo ground truth set. The correctness of accuracy measurement in our modified ROC analysis may thus depend on the accuracy of the pseudo ground truth set. Nevertheless, we showed that the strength can be used an indicator to distinguish spam communities from non-spam communities and it can achieve the similar level of accuracy to the state of the art content based classifier.
On the other hand, we argue that it is hard to evade our community-based scheme as spammers essentially need to build these strongly, positively connected communities to make their opinions influential; whereas spammers can easily fake their content features (e.g., reword their contents for lower content similarity value) to evade detection by content-based classifiers. Furthermore, it is also important to note that the discovered communities not only include reviewers but also commenters who may not write any spam reviews. Existing pure content-based approaches will not be able to discover such supporting commenters, though they are also suspicious and indirectly contribute to opinion spams. In other words, our approach can discover both spam reviewers and suspicious commenters, which is a great advantage over pure content-based approaches.
As we discussed in Section 6.1 and Section 6.2, we have observed inconsistency between two classifiers: the Linguistic model-based classifier and the Spam indicators-based classifier. While we have mentioned one possible reason (i.e., the linguistic model with TripAdvisor ground truth set can only be applied to travel-related or even only TripAdvisor reviews), in this section we further investigate how different these two classifiers actually are.
Spearman’s rank correlation coefficient ρ is a measure of testing statistical dependence between two ranked lists [36]. To compare the ranks in Section 6.1 and the ranks in Section 6.2, we apply Spearman’s rank correlation coefficient.
The definition of Spearman’s rank correlation coefficient is as follows.
The sign of the Spearman’s correlation indicates the direction of association between two ranked lists
Spearman’s rank correlation coefficient in each category
Spearman’s rank correlation coefficient in each category
As shown in Table 3, ρ in each category is close to zero, meaning that there are no correlation between the ranked list from Section 6.1 and that from Section 6.2.
We now explore the results from Stage 4 of our approach: characteristics of spam targets of the discovered reviewers. Specifically, we will show the differences between the outgoing relationships of high and low strengths of strongly positively connected communities (i.e., spammers and non-spammers).
As we have observed strong spammer candidates are those who build strongly positively connected communities with a strength higher than 80%, we investigate the high strengths (
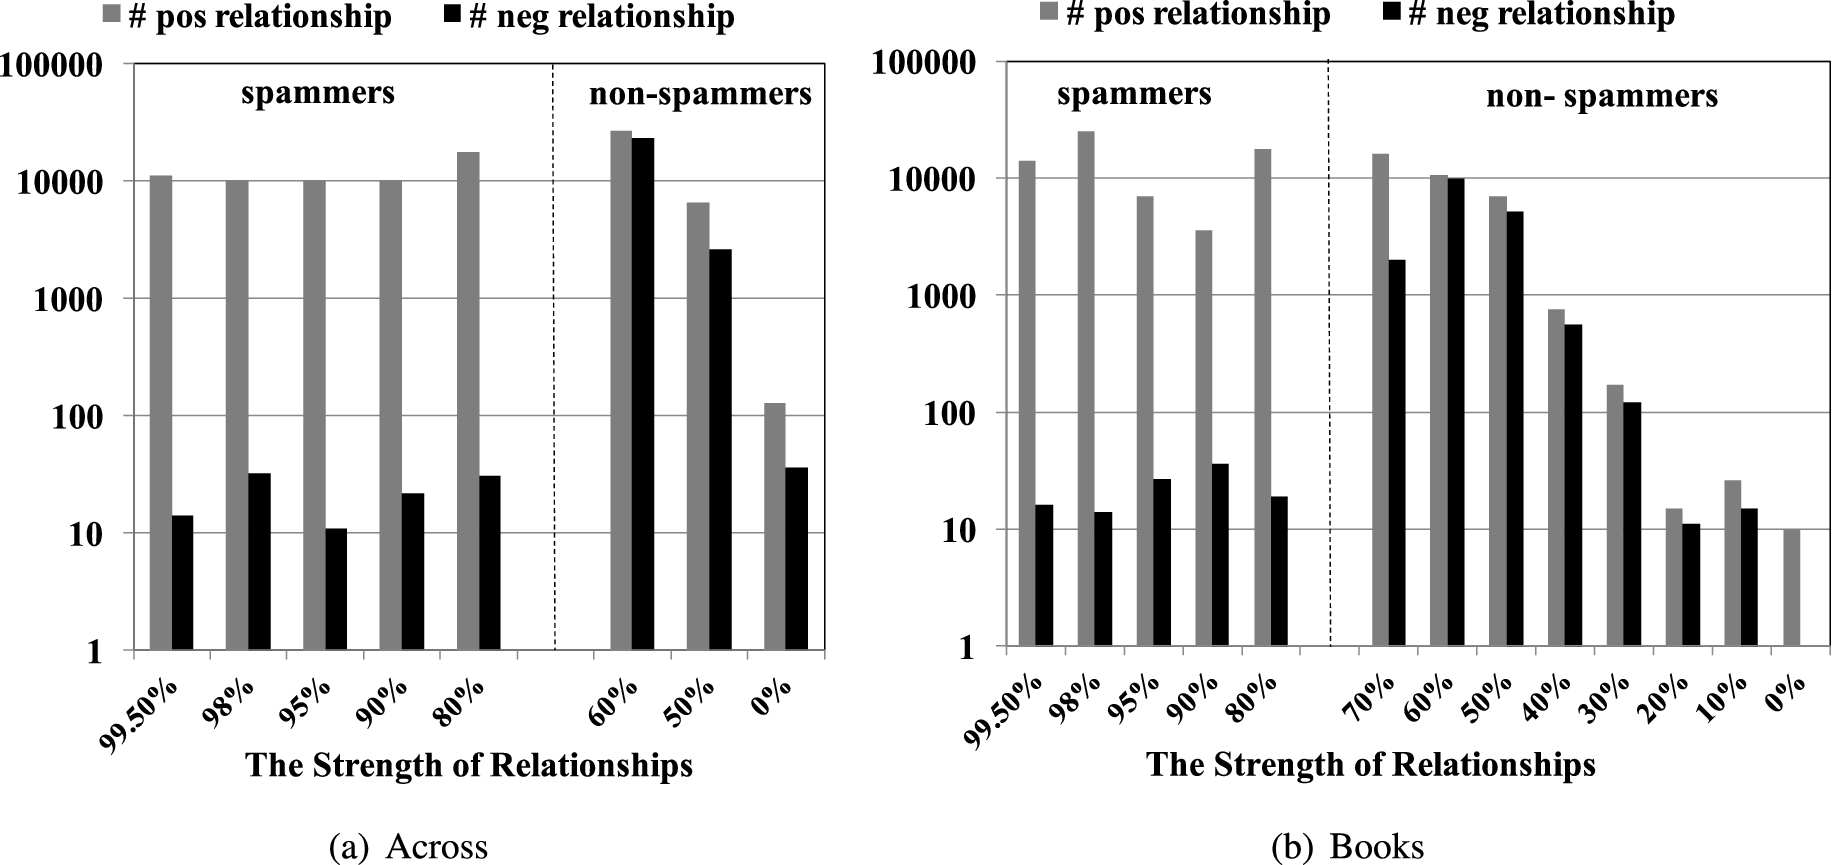
The number of positive and negative relationships of spam reviewers in each category.
Figure 19 shows the number of positive and negative outgoing relationships from the discovered reviewers with various different community strengths. To show the differences clearly, we put the dotted lines between spammer and non-spammer communities in Fig. 19. Recall that in the Across dataset, no community is found with strengths
First, the discovered spammers have a relatively large number of strong positive outgoing relationships, compared to the strong negative outgoing relationships as shown in the left sides of Fig. 19(a) and Fig. 19(b); whereas non-spammers have a similar number of weak positive and negative relationships as shown in the right sides of Fig. 19(a) and Fig. 19(b). Furthermore, we have observed that there are not many strong demoting behavior in our dataset as shown in the left sides of Fig. 19(a) and Fig. 19(b). In fact, we also want to note that most strong positive outgoing relationships tend to appear inside the discovered spammer communities. This result might suggest that the primary goal of spammers is rather promoting their own reviews than demoting those of competitors.
In this paper we proposed a novel approach to find opinion spammer groups by analyzing community structures built through abnormally non-random positive interactions based on the intuition that spammers need to form artificial communities to make their opinions influential. Note that we are fully aware of the fact that non-spammers may form natural communities because of their genuine common interest on items as mentioned in Section 1. Therefore, we focused on the strongly, positively connected communities with high strengths (
The statistical differences among each strength of discovered communities
Statistical differences in terms of edge probability distribution in each category (t-test)
Statistical differences in terms of edge probability distribution in each category (t-test)
Statistical differences in terms of spammicity value distribution in each category (t-test)
We performed t-test to show the statistical differences among each strength of discovered communities. Specifically, we will show that two-tailed t-tests reject the null hypotheses that there are no significant differences among the communities in terms of edge probability distribution and spammicity value distribution. Table 4 and Table 5 show the statistical differences among each strength of discovered communities in terms of edge probability distribution and spammicity value distribution, respectively. As we observed that the major behavioral change occurs in 0%, 60%, and 99.5% communities, we present the results comparing 99.5% communities against 0% and 60% communities. As shown in Table 4, we observe that the three communities are significantly different from each other in terms of edge probability distribution (
On the other hand, we also observe that 99.5% communities (i.e., spam communities) are significantly different from 0% and 60% communities (non-spam communities) in terms of spammicity value distribution, as shown in Table 5 (
Figure 20 shows the modified ROC curve without sentiment analysis using the Spam Indicators-based Classifier in [28]. In particular, we ignored sentiments of relationships and found strongly connected communities in each strength of general user relationship graphs. For this analysis, we vary strengths of strongly connected communities as thresholds to define spammers. The x-axis represents the false positive rate and the y-axis represents true positive rate. Each point represents true positive rate against false positive rate given τ strength as a threshold.
Modified community-strength based ROC curve without sentiment analysis.
Similar to the analysis in Section 6.1 and Section 6.2, we assume that reviewers in communities with strengths greater than or equal to τ are spammers; those in communities with strengths less than τ are non-spammers.
As shown in Fig. 20, we observe that all points are yielded in the bottom right corner. Unlike the results in Fig. 18 where we observed 0% false positive rate with 80% as a threshold, Fig. 20 suggests that false positive rates are close to 50% with 80% as a threshold; unlike the results in Fig. 18 where we observed high (close to 100%) true positive rate with 80% as a threshold, Fig. 20 suggests that true positive rates range from 10% to 20% with 80% as a threshold. This indicates that reviewers in strongly connected communities whose strengths are greater than 60% are not necessarily to be spammers unlike our findings on the strengths of strongly yet positively connected communities. This agrees with our assumption that spammers are strongly correlated with each other through positive interactions, and both analysis including the sentiment analysis and the strength analysis of relationships is needed to discover spammers.
In this section, we analyze the correlations between the spammicity of reviewers and the number of reviews they submitted. The reviewers are grouped by the number of reviews submitted. Since the number of reviews of discovered reviewers ranges from 100 to 600, they are divided into five groups with 100–200, 200–300, 300–400, 400–500, and 500–600 reviews. In Across dataset, there are 2,375, 892, 433, 213, and 127 reviewers respectively; in Books dataset, there are 1,172, 439, 185, 103, and 50 reviewers respectively.
We compare the nine spammicity values of five groups of reviewers against the top and the total reviewers. By doing so, we will show reviewers who have the corresponding number of reviews to each strength of communities do not show specific behavior patterns like discovered reviewers. In fact, we will show that those five groups of reviewers behave similar to either top reviewers or total reviewers.
In the following we will present the results in a series of tables where: each row represents each group of reviewers.
Contents similarity (CS) in each category
Contents similarity (CS) in each category
Rating abused item ratio (RA) in each category
Review duplicated items ratio (DUP) in each category
Maximum one day review ratio (MOR) in each category
First review ratio (FRR) in each category
Early time frame ratio (ETF) in each category
Deviated rating ratio (DEV) in each category
Extreme rating ratio (EXT) in each category
In short, our findings from spammicity analysis of reviewers grouped by the number of reviews can be summarized as follows. First, in general, we could not find specific spammicity patterns based on the number of reviews submitted. Generally speaking, the spammicity values of the five reviewer groups are similar to that of total reviewers (low spammicity). This lends support to our claim that distinguishing characteristics of discovered reviewers presented in Section 5.3 are not simply due to the reason that the discovered reviewers reviewed more.
Second, users who reviewed more tend to show similar behavior to top reviewers in some features such as ETF, MOR, FRR, and DEV. This also agrees with the common sense that users who submitted many reviews are actually active users who review more and earlier. And opinions of such more active reviewers may be considered as reliable.
In this section, we analyze the correlations between the spammicity of reviewers and the average length of reviews they submitted. The reviewers are grouped by the average length of reviews submitted. Since the average length of reviews of discovered reviewers ranges from 300 to 600, they are divided into three groups whose lengths of reviews are 300-400, 400-500, and 500-600, respectively. In Across dataset, there are 3,037, 1,713, and 956 reviewers respectively; in Books dataset, there are 1,443, 739, and 437 reviewers respectively. We compare the nine spammicity values of three groups of reviewers against top and total reviewers.
By doing so, we will show reviewers who have the corresponding length of reviews to each strength of communities do not show specific behavior patterns like discovered reviewers. In fact, we will show that those three groups of reviewers behave similar to either top reviewers or total reviewers.
In the following we will present the results in a series of tables where: each row represents each group of reviewers.
Contents similarity (CS) in each category
Rating abused item ratio (RA) in each category
Review duplicated items ratio (DUP) in each category
Maximum one day review ratio (MOR) in each category
First review ratio (FRR) in each category
Early time frame ratio (ETF) in each category
Deviated rating ratio (DEV) in each category
Extreme rating ratio (EXT) in each category
Review Burstiness (BST) in each category
In short, our findings from spammicity analysis of reviewers grouped by the length of reviews can be summarized as follows. First, in general, we could not find specific spammicity patterns based on the length of reviews submitted. Generally speaking, the spammicity values of the three reviewer groups are similar to those of top and total reviewers (low spammicity). This lends support to our claim that distinguishing characteristics of discovered reviewers presented in Section 5.3 are not due to their longer reviews. Second, the behavior of the reviewers who submitted relatively long reviews are not much different from total reviewers, meaning that the length of reviews rarely affects the spammicity of reviewers.
Some challenges still must be surmounted. First, the proposed approach has focused mainly on spammer groups so it cannot find individual non-group spammers. We may combine our approach with content-based classifiers (e.g., [28,48]) to detect such non-group spammers. Second, while we have discussed the effectiveness of our approach in terms of detection accuracy, it would also be useful to develop a model to measure the effect of various spamming strategies (e.g., manipulate contents and build artificial communities). We thereby plan to investigate the robustness of our approach to other domains (i.e., to what degree attackers can manipulate their behavior to avoid detection). Also, while our research was done with the static historical data, we plan to study the dynamics of user activities to deal with evolving spammer communities (e.g., a non-spammer may be compromised, new spammers join, and the existing spammer may be suspended).