
Abstract
Modern network infrastructures are in a constant state of transformation, in large part due to the exponential growth of Internet of Things (IoT) devices. The unique properties of IoT-connected networks, such as heterogeneity and non-standardized protocol, have created critical security holes and network mismanagement. In this paper we propose a new measurement tool, Intrinsic Dimensionality (ID), to aid in analyzing and classifying network traffic. A proxy for dataset complexity, ID can be used to understand the network as a whole, aiding in tasks such as network management and provisioning. We use ID to evaluate several modern network datasets empirically. Showing that, for network and device-level data, generated using IoT methodologies, the ID of the data fits into a low dimensional representation. Additionally we explore network data complexity at the sample level using Local Intrinsic Dimensionality (LID) and propose a novel unsupervised intrusion detection technique, the Weighted Hamming LID Estimator. We show that the algortihm performs better on IoT network datasets than the Autoencoder, KNN, and Isolation Forests. Finally, we propose the use of synthetic data as an additional tool for both network data measurement as well as intrusion detection. Synthetically generated data can aid in building a more robust network dataset, while also helping in downstream tasks such as machine learning based intrusion detection models. We explore the effects of synthetic data on ID measurements, as well as its role in intrusion detection systems.
Keywords
Introduction
With people, objects, sensors, and services all connected through devices ranging from household appliances to smartphones and PCs, the Internet of Things (IoT) network infrastructure faces the challenging task of managing heterogeneous devices and their communications in the absence of standardization. The proliferation of IoT systems has introduced new, and emerging security vulnerabilities [1,4,12,53] which can be readily exploited to cause harm. Such vulnerabilities arise because of device manufacturers neglecting security for performance considerations [13], end-users not updating each device regularly [50], and a continually expanding marketplace of devices and manufacturers [12].
Further, the unique characteristics of IoT networks have introduced new complications. Notably, heterogeneity and non-standardized protocol of IoT networks have been posited as critical challenges for enhancing the security of IoT systems [10,24,39] – networks with diverse devices ranging from single-purpose machines to robust servers, each with varied communication structures, are cumbersome to protect. Past work has proposed behavioral fingerprinting of devices [8], and further fine-tuning device-specific anomaly detection models depending on the complexity of devices [19]. Others propose supervised machine learning solutions [27,43], utilizing modern network datasets such as Aposemat IoT-23 (IoT-23) [15].
In this work, we take a different approach by first examining the supposition that benign heterogeneous IoT networks have higher complexity than regular non-IoT datasets. We calculate ID, a property that has been proposed to measure the complexity of a data set as a whole [54] and evaluate it on four IoT datasets and two non-IoT datasets. We analyze the datasets from three perspectives: network level, device level, and through sampling, and show that, despite the variability of IoT devices, the complexity of benign network activity is low. Further, we show that at the sample-level, IoT traffic can be categorized as benign or malicious using a device-independent unsupervised model. We do this using LID, which estimates the intrinsic dimension around an individual data point, and show that malicious activity exhibits higher LID values than benign samples.
Problem statement
We focus on the question of heterogeneity and complexity in IoT networks and their effects on detecting malicious activity via Network Intrusion Detection Systems (NIDS). Specifically, we ask the following questions:
Do the properties of multi-device heterogeneous IoT networks exhibit fundamentally more complex behavior? What devices are harder to protect in machine learning-based NIDS frameworks? Can we detect malicious activity at the IoT network level in an unsupervised manner, without the need to label each device and attack? Can the use of synthetic datasets aid NIDS in building more robust ML-based detection models?
Limitations of prior attempts
Quantifying the complexity of IoT-based network traffic can aid in tasks such as network administration, provisioning, quality of service metrics, and security. However, current research has found that existing network complexity metrics are insufficient [29]. Notably, Liu et al. [29] examined several classical complexity metrics such as Normalized Trace Complexity, Multiscale Sample Entropy, and Plug-in Packet Timing Entropy, finding disagreement between the rank order results of each algorithm. In summary, they conclude that new quantitative measures are needed to incorporate the diversity of IoT traffic.
Additionally, various machine learning solutions have been proposed for NIDS in IoT networks. Such solutions incorporate deep learning such as autoencoders and classifiers [9,40,46,47], as well as traditional machine learning algorithms [34]. While these solutions are each impactful in their own right, most are supervised learning solutions requiring a fully annotated dataset to train – a costly, time-intensive task. Moreover, with constantly evolving attack vectors (malicious actors acting in novel ways), supervised NIDS solutions trained on datasets with particular attack types become vulnerable [35,51]. Further, IoT networks are fundamentally different from standard networks – devices will be added to the network, and existing devices may have software/firmware updates with greater frequency. Supervised algorithms are unable to detect new devices or updates in these situations without expensive retraining or reconfiguration [8].
To mitigate the problems of supervised learning algorithms in IoT, Haefner and Ray [19] take the novel approach to intrusion detection in IoT from the perspective of device traffic complexity. The authors measure the complexity of network traffic on a per device basis to tune an (unsupervised) Isolation Forest algorithm. They find that several single-purpose IoT devices contain simple (non-malicious) network traffic, enabling us to assume trust of the device based on its low network packet variability. However, the tuning procedure used for the Isolation Forest assumes a particular contamination rate: for more complex devices, they assume a more significant and fixed percentage of network packets are anomalies, an assumption that could lead to false positives and not perform well in real-world scenarios.
Proposed approach
In this work, we measure the complexity of IoT network traffic using the novel perspective of ID, testing the hypothesis that IoT networks have increased complexity as a result of their heterogeneous behavior. We first measure ID at the network dataset level, showing that, counter to intuition, several IoT datasets exhibit lower ID compared to non-IoT benchmarks. We expand this analysis to the IoT device level, confirming the work by Haefner and Ray [19] that single-purpose devices have low complexity measurements. Additionally, we show that the ID measurement used in our experiments exhibit similar rank order complexity as [19], i.e., the complexity measurements of devices are arranged in a similar order in both works. Finally, we find that more complex devices still exhibit low ID, which can help in modeling and risk management of new devices in NIDS (lower ID indicates we can feasibly model these complex devices better than previously thought).
Second, we focus on the problem of detecting malicious actors in IoT networks. We measure the complexity of network packets using LID by formulating an entropy-weighted Hamming distance calculation on top of the LID measurement to construct a novel anomaly detection algorithm. The results of the algorithm show that benign network data in IoT datasets exhibit a lower LID measurement compared to malicious actors, which provides us the opportunity to threshold this measurement during test time. The unsupervised algorithm uses benign IoT network data as a training set and assumes any test sample under threshold τ is benign network behavior. If the LID estimate is above this threshold, we can flag the example as malicious.
Finally, we assess our proposed ID and LID approaches with synthesized network data. Specifically, we generate new synthesized benign and malicious datasets using a Variational Autoencoder (VAE). We hypothesize that by adding new data to our experimentation we can better assess the quality of the metrics. To begin, we assess the quality of our synthetically generated data by measuring its separability from real data. We achieve this with both the variational autoencoders reconstruction error of a sample and additionally using the receiver operating characteristic curve of the synthetic dataset compared to the real dataset. We then measure the ID of synthesized benign datasets to test whether the metric is consistent with the real samples. Next, we test the ability of our Weighted Hamming LID Estimator against synthesized attack data. In our final experiment, we test whether the performance of unsupervised anomaly detection algorithms increases as a result of the newly added synthetic data. Our experiments show that we can build a robust dataset using the synthesized data while maintaining a similar ID measurement.
Key contributions
Our contributions are as follows:
We measure the complexity of several IoT and non-IoT datasets at both the network and device level using ID, testing the hypothesis that IoT networks contain complex interactions. Despite being heterogeneous in nature, we show that IoT network activity has low ID measurements, with ID values similar to device-level traffic. Low ID measurements provide strong evidence that we can build robust and secure Machine Learning (ML) models to protect IoT networks. To the best of our knowledge, this is the first work that analyzes IoT datasets using ID.
We propose a novel algorithm for unsupervised anomaly detection using a combination of Hamming distance and the Hill Maximum Likelihood Estimator (MLE) LID, and show that the algorithm performs competitively with several state-of-the-art algorithms.
We measure the complexity of network traffic using synthesized datasets, showing that ID metrics are similar across real and synthetic values. Additionally, we show the benefits of using synthesized data for enhancing unsupervised learning algorithms.
We find that adding synthetic data to the benign and attack datasets provides new insights into the quality of different metrics and algorithms. In particular, adding synthetic data to the benign datasets provides enhanced generalization capabilities in IoT datasets. Additionally, we find that the anomaly detection algorithms studied in this paper are robust to synthetically generated attacks.
The rest of the paper is organized as follows. We first summarize related and prior work in Section 2. We then detail ID, and LID concepts in Section 3 as well as discuss our methodology. We summarize the datasets we used in experiments in Section 4. Next is our analysis of ID results in Section 5, followed by device level ID estimates in Section 6. In Section 7, we present results at the algorithm level and attack level. In Section 8 we examine the intrinsic dimensionality of synthetic datasets. Finally, we conclude this paper with a discussion and pointers to future directions in Section 9.
Related work
In this section, we review Intrusion Detection Systems (IDS), IoT security research, current algorithms for IoT intrusion detection, and finally, open problems in deep learning anomaly detection.
Intrusion detection systems
IDS can broadly be classified based on 1) where the detection is placed (network or host) and 2) the detection method that is employed (ML anomaly-detection algorithms or traditional signature-based detection where attack patterns are defined in a database). In this work, we concentrate on network-based intrusion detection where anomalies are classified based on an ML algorithm. ML based NIDS are employed in production into a key point within a network to monitor traffic to and from all devices connected to the network. Network features are extracted from the entire subnet about the passing traffic and scored by the ML detection algorithm. NIDS can operate on-line (real-time detection) or off-line (batch detection). Real-time detection offers more robust security and beneficial results as long as it does not impair the overall speed of the network. Our study aims to characterize network data in real-time.
IoT is a rapidly evolving field, with research being done at dozens of institutions across industry and academia [10,24,26,39]. It is postulated that IoT increases the vulnerability of networks because the attack surface has increased, with many new entry and exit points with new devices available on networks [32,41]. A heterogeneous IoT network is typically made up of various sub-devices within a distributed network. It includes resource-constrained devices, such as a smart light bulb or garage door opener, and more powerful devices such as embedded and regular computers.
Existing research notes that IoT networks and devices have multiple intrusion sources: IoT backends, cloud services supporting an IoT device, and other hubs within the IoT system [38,49], which makes it difficult to implement traditional intrusion detection approaches such as rule-based and signature-based methods.
State-of-the-art network intrusion models
Several works propose new and existing algorithms for intrusion detection on commonly used datasets. Moustafa [34] released dataset TON_IoT (TON_IoT), including baseline results that use many supervised learning algorithms. Sahu et al. [43] proposed a hybrid deep learning model which uses a CNN/LSTM framework to achieve 96% accuracy on the IoT-23 dataset generated by [15] and outperformed several proposed deep learning-based attack detection. Kozik et al. [27] use hybrid time window embeddings with a transformer neural network to classify IoT-23 data. This model achieves between 93% and 95% accuracy on attacks in IoT-23 and does better than three other proposed deep learning models: HaddadPajouh et al. [18] use an LSTM trained on IoT devices execution operation codes (OpCodes), Roy and Cheung [42] use a bi-directional LSTM for detecting attacks on UNSW-NB15, and Azmoodeh et al. [6] use OpCodes to train a deep Eigenspace model to detect attacks.
Moustafa and Slay released UNSW-NB15 dataset [35] that was generated using IXIA PerfectStorm. The dataset has been widely used as a benchmark for comparison. MStream [9] is an online neural network-based anomaly detection algorithm using both continuous and categorical features. This tool achieves 0.90 AUROC on UNSW-NB15 and is considered state-of-the-art according to PapersWithCode.com.2
Several other papers are published using alternative datasets that propose different machine learning models for intrusion detection. Rezvy et al. [40] proposed a deep learning framework for intrusion classification and prediction in 5G and IoT networks. They propose an autoencoder neural network for detecting intrusion or attacks in 5G and IoT networks, evaluating the model on the Aegean Wi-Fi Intrusion dataset. Their results showed an overall detection accuracy of 99.9% for different types of attacks. Kasongo and Sun [22] argue that feature selection is essential for the performance of ML models in intrusion detection since model accuracy decreases with more high-dimensional datasets. They apply a filtering technique on features and train several ML models using this technique, showing strong performance. They relate the feature selection to IoT devices with limited capacity, showing that less robust modeling techniques are favorable in limited-capacity systems such as small IoT devices.
Neural networks trained with back-propagation provide diverse structures and objectives to learn from high-dimensional data. Despite their incredible power, anomaly detection remains an open research problem, even in state-of-the-art models. Notably, several works in computer vision have shown that classification, generative, and unsupervised deep neural networks are all susceptible to anomalous data [16,20,33,36,45]. For example, one common computer vision experiment involves training a deep learning model on the CIFAR-10, a dataset with 60,000 images labeled into ten classes. It is expected that the likelihood of a CIFAR-10 test image will be higher than images from other datasets during test time. However, several papers have shown that the examples from the dataset SVHN produces a higher likelihood when passed through the model trained on CIFAR-10 [33,36,45]. Recently, Serra et al. showed that anomalous high-likelihood data could be linked to complexity [45]. They find that the simplicity of SVHN data compared to CIFAR-10 data causes the deep learning model to exercise a higher likelihood on SVHN examples than the complex CIFAR-10 data. They use image compression scores as a complexity metric (likelihood ratio) to determine whether the high likelihood can be attributed to lower complexity.
Interestingly, a similar complexity finding was found in a recent security paper published by Haefner and Ray [19]. Using data from various IoT devices, they find that each device has varying complexity. They formalize a complexity measure (IP Spread/IP Depth) per device in order to fine-tune an Isolation Forest anomaly detection algorithm. Their architecture, ComplexIoT, measures network traffic on a device level, which can be used in Host Intrusion Detection Systems.
This work is similar to ComplexIoT [19] in that we propose a complexity measurement; however, there are several key differences:
We analyze IoT datasets both from the point of view of network-level and the device level, while ComplexIoT only looks at device level complexity. ComplexIoT proposes a device complexity score to moderate the contamination rate of an Isolation Forest. This is problematic as it assumes The ComplexIoT complexity score is based on IP spread and IP depth and does not consider other network features to compute its complexity estimate. The efficacy of the ComplexIoT approach has not been measured via binary classification metrics on benign and malicious examples. In this paper, we measure the results of the weighted Hamming LID estimator on common IoT network intrusion datasets.
Methodology
In this section we first briefly explain the concepts and the mathematics behind ID and LID. We will later use ID to measure both network and device level IoT and non-IoT datasets, showing how this complexity measurement is a strong tool of our ability to assess network data at multiple levels. Next, we propose our algorithm, the Weighted Hamming Distance LID Estimator, include the algorithm details, baseline models to compare against, and our experimental protocol.
Intrinsic dimensionality
The ID of a dataset is the minimum number of variables needed to retain a full approximation of the data [7]. It is based on the observation that high-dimensional data can often be described by a smaller number of variables. The utility of lower dimensional representations is apparent throughout ML research, from data compression (such as autoencoders [21]) to dimensionality reduction (PCA). ID is akin to autoencoders and PCA, however quite distinct in that its an estimate of the lowest possible dimension of a dataset (e.g. the lowest possible bottleneck size in an autoencoder), and not a reduction technique in itself. ID can be thought of as a geometric property to measure complexity of a dataset as a whole [54].
Formally, the ID of dataset
As an intuitive example, points
The main approach to estimate ID involves examining the neighborhood around a reference point
Recently, ID has been gaining relevance in the machine learning community [3,5,37]. Pope et al. [37] showed that common computer vision datasets exhibit very low intrinsic dimension relative to their number of pixels. They also showed that the intrinsic dimension greatly impacts learning: the higher the intrinsic dimension of a dataset, the harder it is to learn from it. In addition, they showed that the extrinsic dimension of the dataset, i.e. the total number of pixels per image in a dataset, did not effect learning and generalization, indicating that sample complexity only depends on the intrinsic dimension rather than the total dimension of the dataset. Ansuini et al. [5] showed that neural networks exhibit low intrinsic dimensionality at deep layers of neural networks. Outside of deep learning, intrinsic dimensionality has been used in applications such as anomaly detection [48], clustering, similarity search, and deformation in complex materials.
Local intrinsic dimensionality
In contrast to ID, LID estimates individual data samples, rather than the full dataset. It is based on the observation that individual data points in a dataset often fit within a specific lower-dimensional structure when only considering a subset of the nearby data. As a result, these values can vary greatly within a dataset. Intuitively, the LID measurement can be interpreted as the dimension immediately surrounding a data point.
LID has been proposed for anomaly/out-of-distribution detection [52] as well as detection of adversarial examples in deep neural nets [30]. Theoretically, examples within a dataset should have lower LID values than anomalous examples generated from an alternative source.
Amsaleg et al. [3] propose several estimators for the LID, though they note that these are theoretical quantities and only estimates of the true local dimension. We use their Maximum Likelihood Estimator in Section 3.3. Their equation provides a strong balance between efficiency and complexity:
Ma et al. [30] used LID estimates to characterize adversarial subspaces in deep learning. They showed how traditional density measures can fail to detect adversarial examples in the final layers of deep learning models, while LID measurements can better characterize these subspaces. This is because traditional measures only measure the density of neighboring points surrounding an example, whereas LID measures the rate at which new neighbors occur.
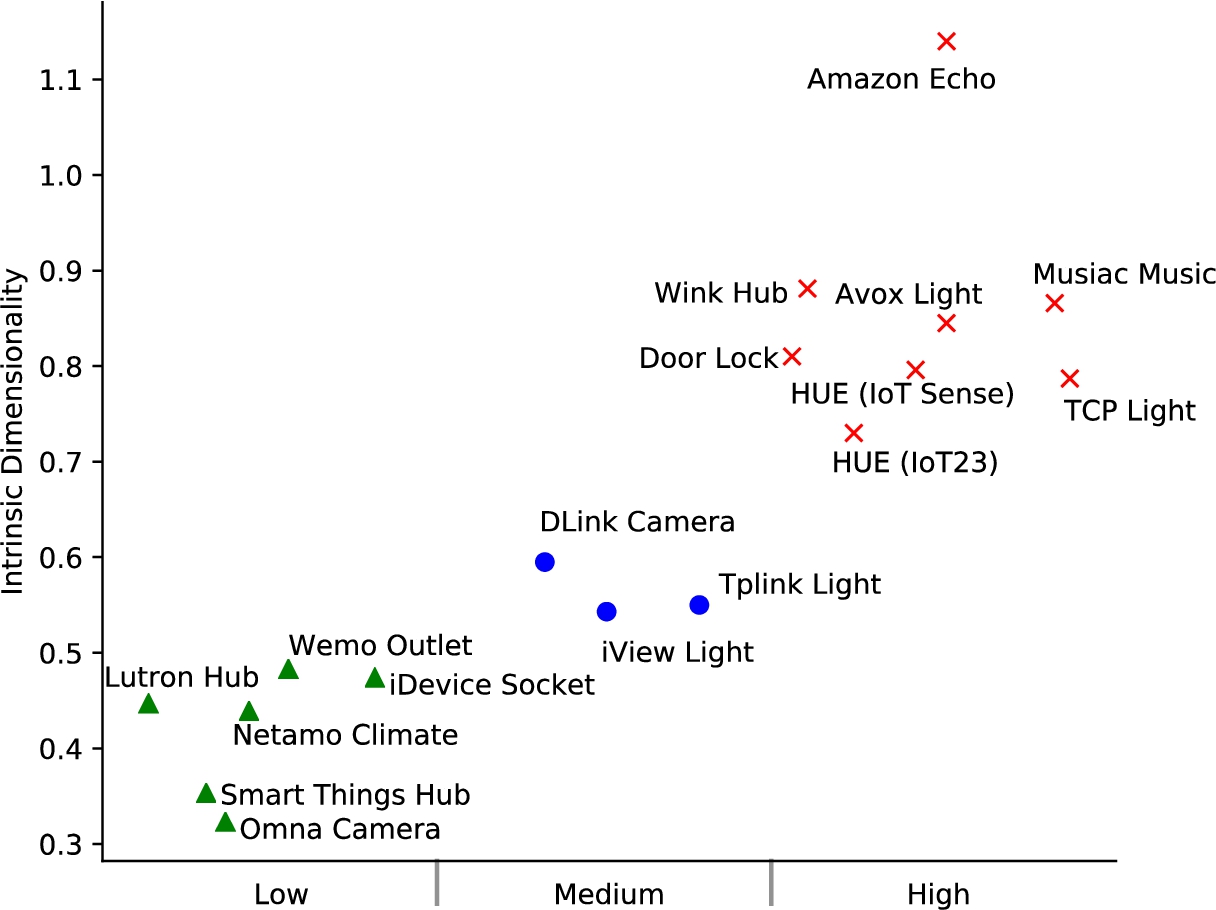
Weighted Hamming distance LID estimator
LID is typically measured on a sample using distances from its neighbors in a dataset, and can be thought of as the rate of growth between a point and its neighbors. In this work, we use Equation (2) for LID estimation, using the training data
Distance metric. For the distance metric required in Equation (2), we use Hamming Distance to compute similarity between both categorical and continuous feature points. While Euclidean Distance is typically used in Equation (2) to measure LID, Ma et al. [30] suggested not using Euclidean Distance as the underlying distance metric. Choosing the Hamming Distance metric over Euclidean Distance for continuous variables showed better experimental results. Effectively, this turns each pairwise feature distance into a binary metric: 0 for same, 1 for different. We compute Hamming Distance using the Python SciPy library as:
Entropy. We calculate entropy of each feature and set it as the weight. In a dataset with n features, we set weight
After computing Hamming distance between
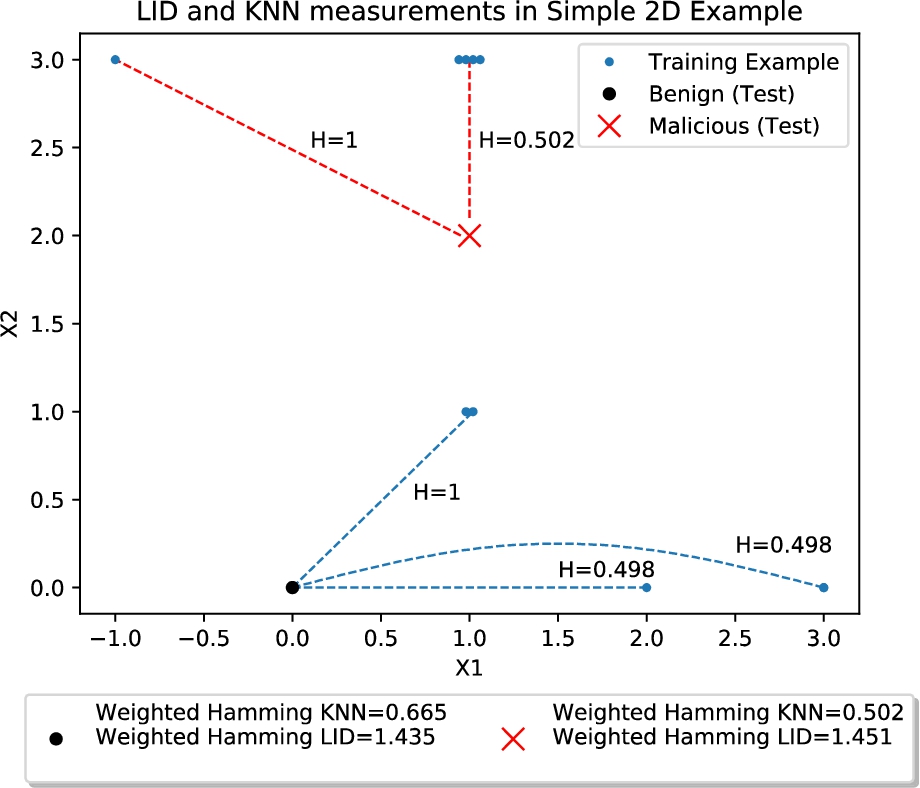
A visual explanation of how the weighted Hamming distance LID estimator can detect anomalous examples where the traditional KNN algorithm will fail. See the end of Section 3.3 for more details.
Weighted Hamming distance LID estimator
Figure 1 depicts a visual example of how the Weighted Hamming LID Estimator can classify an anomalous example where the KNN algorithm will fail. For example, the traditional KNN algorithm can discriminate test examples as benign or malicious by measuring a samples average distance to K training samples, where lower average distances indicate a benign example and higher distances indicate a malicious example. Figure 1 shows how KNN can fail on a simple two dimensional problem: the red X is closer to several training examples, however, the black dot matches the more relevant feature, X2. We show how the LID estimate corrects this issue, yielding a lower value for the benign example compared to the malicious example. We weight the Hamming distances in the KNN and LID estimates with 2/Entropy of each feature. Entropy for X1 is 1.99 and 2.01 for X2. In the image, results are presented with a weighted Hamming distance, however Euclidean distance yields the same results on KNN. K = 3. Here, the LID is calculated as
In the previous section, we explain our proposed Weighted Hamming Distance LID Estimator model. We compare our proposed model with several models as baselines in the tasks of detecting attacks in the IoT networks. These models include several modern and classic algorithms: KNN, Isolation Forest, and Autoencoder. In the following, we briefly explain each of these models.
KNN algorithm
K-Nearest Neighbors (KNN) classification is an unsupervised machine learning model that measures the distance between a sample point and its neighbors. It takes an arbitrary distance measurement and measures the average distance between a reference point and its neighbors using this distance. In our experiments, we take the average of these nearest neighbor distances and use them to threshold scores. Theoretically, reference points with lower KNN averages should belong to the normal, non-malicious examples in the dataset, and malicious examples should have higher KNN averages.
Isolation forest
Isolation Forest is an efficient algorithm to determine anomalies in an unsupervised manner. It does not need a profile of what is normal and not normal and identifies anomalies independent of labels. The algorithm relies on the tendency of anomalies to be easier to separate from the rest of the sample compared to normal points. It recursively generates partitions on the sample by randomly selecting an attribute and then randomly selecting a split value for the attribute between the minimum and maximum values allowed for that attribute.
Notably, an Isolation Forest was used in [19], where they tune the contamination parameter based on the complexity of an IoT device. They argue that devices with low complexity should have contamination values close to zero because their expected network traffic should fit certain patterns, hence the device should never receive anomalous traffic. This means that, should the device be compromised, the algorithm would likely not classify the attack as anomalous because of the low expected contamination. As a result, the algorithms assumption that a certain percentage of examples are contaminated makes it vulnerable to changes in the number of contaminated records.
Autoencoder
Autoencoder is a neural network based model commonly used for unsupervised anomaly detection, such as in [40]. The model compresses the training set into a bottleneck representation before reconstructing it. We train the autoencoder on benign examples, and in theory, the reconstruction loss should be smaller for all benign examples compared to malicious examples.
The objective function is the reconstruction loss: given example x and continuous feature
We sum the loss of the continuous and categorical variables to obtain the full reconstruction loss. We use Adam optimization with the default learning rate.
Experimental setup
To train each model in an unsupervised manner, we first take all clean examples (
A proper threshold τ can be determined based on the desired accuracy rate. In other words, if it is important to classify all malicious samples, we can set a lower τ for higher detection, though this may lead to some benign examples being classified as malicious (false positive).
To measure results, we use Area Under the Receiver Operating Characteristic curve (AUROC) and Area Under the Precision-Recall curve (AUPR). AUROC plots the True Positive Rate (TPR) against False Positive Rate (FPR). AUPR plots the precision versus the recall calculated by following formulas:
Datasets
This section summarizes the datasets we use in our experiments. We use two common non-IoT network intrusion datasets, UNSW-NB15 and KDD Cup, and four IoT related datasets (TON_IoT, NetFlow Bot-IoT (NF Bot-IoT), IoT-23, IoT Sense).
Non-IoT: UNSW-NB15
UNSW-NB15 [35] (2015) is a standard and commonly used network intrusion dataset from the USNW at Canberra Cyber Range lab. The dataset provides modern network traffic scenarios compared to the KDD datasets, which are more than a decade old. There are 47 features (of which we use 42), ranging from basic features to content and time-related features. Nine types of attacks are included in the dataset.
Non-IoT: KDD Cup 1999
We use a variation of the KDD Cup 1999 dataset [14] located on Kaggle. The dataset consists of 13,449 benign instances and 41 features, which we use to measure ID.
TON IoT
TON_IoT [2,34], published in 2020, comprises heterogeneous IoT data across several devices. The work uses several data source types, including sensor, raw, and log data. Additionally, it includes several infrastructure layers in the testbed architecture, such as the edge, fog, and cloud layers with nine types of generated attacks: Distributed Denial-of-Service (DDoS), Scanning, Ransomware, Backdoor, and Injection attacks. The dataset has 41 total features; however, the authors recommend not to use source IP/port and destination IP/port. The dataset simulates traffic from seven IoT sensors: weather, smart garage door, smart fridge, smart TCP/IP Modbus, GPS tracker, motion-enabled light, and a smart thermostat.
For measuring ID, we deduplicated data instances, and as a result, 61.8% of instances have been removed. However, for the anomaly detection task in Section 7 and Table 3, we consider packets that are duplicate of benign data as being benign.
NF Bot-IoT
NF Bot-IoT [44], published in 2020, is a dataset based on the BotNet IoT dataset [25,26]. Botnets are an important attack vector to protect against as they have been the source of several breaches over the past few years [25]. NF Bot-IoT converts four common network NIDS datasets into network flow datasets using the commonly deployed NetFlow [11] protocol for network traffic collection. Authors argue NetFlow’s features are easier to extract compared to the complex features used in the original NIDS datasets since NetFlow’s features are usually extracted from packet headers. The dataset includes several attacks, including DDoS, Denial-of-Service (DoS), OS and Service Scan, Keylogging, and Data exfiltration attacks.
IoT-Sense
IoT Sense [8], published in 2018, is a dataset of benign examples generated based on 14 real IoT devices. Authors activated different functionalities of each device using controller apps and captured packets. There are 21 features captured in the dataset, with labeled devices for each sample. We categorize devices in this dataset into four categories (Light, Appliance, Hub/Outlet, Smart Controller).
Devices include TCP Light, Avox Light, Musiac Music Player, DLink Camera, iDeviceSocket, iView Light, LutronHub, Netamo Climate, Omna camera, Phillips HUE, Tplink Light, Wemo Outlet, Wink Hub, and Smart Things Hub. We use this dataset for both ID measurements as well as device-specific ID measurements in Sections 5 and 6.
IoT-23
IoT-23 [15] was released in 2020. The dataset has 23 different scenarios, of which three are benign traffic scenarios captured on real IoT devices. The dataset contains almost 11 million total records; however, with the difficulty of modeling this much data, we sample a million records with the following logic: From the entire dataset, we sample 500K malicious records and 500K benign examples from simulated files that contain a source IP or destination IP with an internal IP address and have at least 50 samples belonging to that specific IP address. We find that 99.99% of internal IPs have at least 50 samples. We also included all samples from three real devices (Philips HUE smart LED lamp, Amazon Echo, and a Somfy smart door lock) with 1,634 total packets.
We categorize these devices similar to IoT-Sense as a light (Philips HUE smart LED lamp), Smart Controller (Amazon Echo), and Appliance (Somfy smart door lock). Philips HUE light is in both datasets so that it can be used for comparison device-specific ID measurements.
This dataset also captures 20 simulated scenarios of both benign and malicious traffic. It offers several attack examples: DDoS, FileDownload (to infected device), HeartBeat (indicates packets sent on the connection are used to keep track of infected host by CC server), Mirai, Torii, and Okiru BotNets (new common attacks), and HorizontalPortScan (used to gather information for further attacks).
IoT dataset features
We use the available features for each dataset, except we exclude source and destination IP and port as well as any ID or timestamp columns for TON_IoT and IoT-23. We include IPs and ports in NF Bot-IoT because of its small number of available features to provide more discriminability. Features among the datasets include protocol, source, and destination bytes, connection state, service, duration, missed bytes, number of packets, window size, payload, entropy, DNS, SSL, and HTTP properties. A summary of each dataset is presented in Table 1.
Dataset summaries including total number of samples, percentage of benign samples, percentage of malicious samples, percent duplicates, number of features, and number of attacks
Dataset summaries including total number of samples, percentage of benign samples, percentage of malicious samples, percent duplicates, number of features, and number of attacks
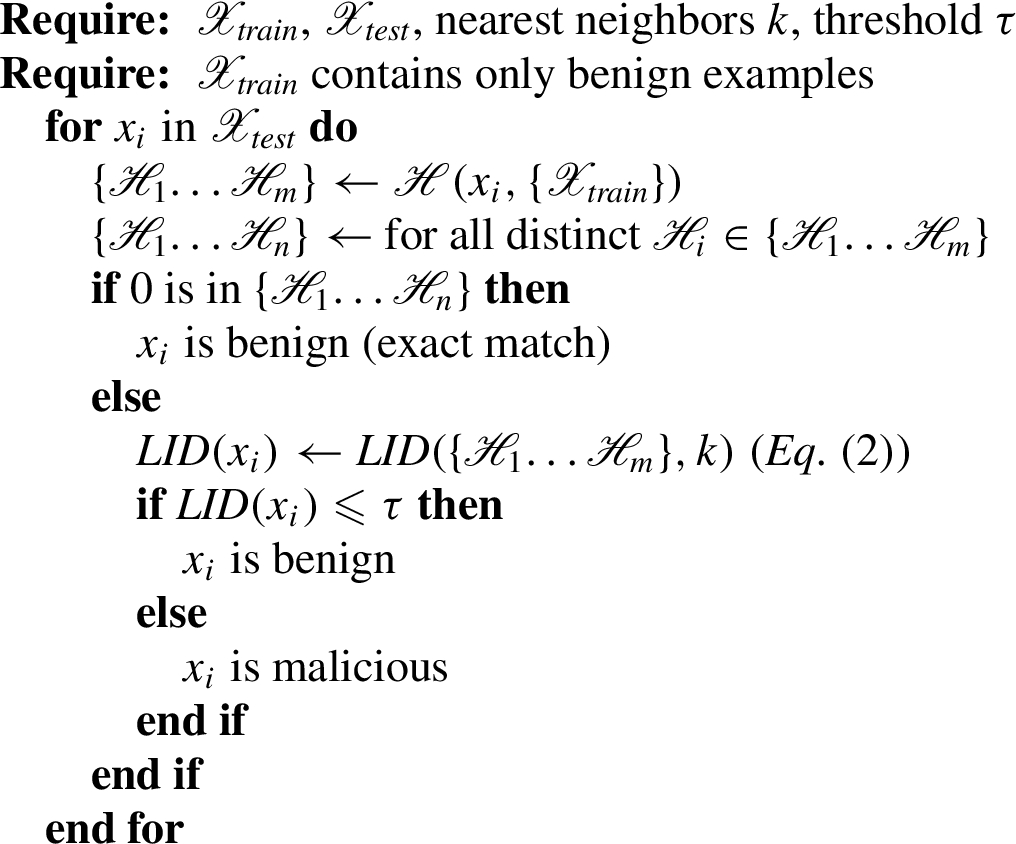
Our first ID analysis is measuring benign networks at the full dataset level, using the approach explained in Section 3.1. We measure the ID over several K estimates (K = 3, K = 5, K = 10, and K = 20). Results of this experiment are depicted in Fig. 2.
IoT datasets vs. non-IoT datasets. First, we look at the benign subsets of four IoT datasets (TON_IoT, IoT-23, NF Bot-IoT, IoT-Sense). Each dataset contains an ID estimate under 2. Comparatively, the non-IoT network datasets of UNSW-NB15 and KDD Cup ’99 have ID estimates between 3.61 and 7.1, substanially higher than the IoT network data. The relative simplicity of IoT network data indicates it will be easier to estimate its behavior, leading to better NID models and more robust detection of attacks.
ID measurement for six different datasets. The four left datasets are IoT datasets and the two right datasets are non-IoT datasets. This figure also depicts different K values for ID.
Effects of K value. One other observation is related to K values. Several works note that the ID estimate is sensitive to K [3,37], so estimating ID values over several K’s gives us a robust picture. As Fig. 2 shows, rank order of each dataset does not change substantially given the choice of K. Hamming Distance is used for all distance computations as described in Section 3.3.
Effects of number of features. Another notable finding across all datasets is that the extrinsic dimensionality, or number of features in the datasets, does not appear to be correlated with its intrinsic dimensionality. For example, TON_IoT contains almost as many features as UNSW-NB15 and KDD Cup 1999, however, its ID estimates are substantially lower than each. This indicates that the features of IoT network data are more simplistic in nature than both non-IoT datasets.
IoT vs. computer vision datasets. Finally, we can compare these values to more difficult modeling on common computer vision datasets. Pope et al. [37] show that MNIST has the lowest ID, estimated between 7 and 13, with the state-of-the-art accuracy of 99.84%. In contrast, ImageNet has an ID between 26 and 43 with a state-of-the-art accuracy of 88.5%, indicating that datasets with a higher ID may be difficult to model. This is further examined in [37]. Relating these values to ID estimates on network data, we see that UNSW-NB15 has a similar ID to MNIST. While this indicates that UNSW-NB15 can still be modeled with very high accuracy, its ID is substantially higher than IoT network datasets, indicating IoT networks may be easier to model.
Potential applications. As noted by Liu et al. [29], a common complexity metric has use in several network-related tasks. For example, network management and provisioning, quality of service metrics, and security can each benefit from a metric to understand the complexity of the network.
In our results above, we show that non-IoT datasets have low ID values. Evidence suggests that such observations can lead to more robust and reliable modeling and quantification [37]. We explore this observation more in the following sections.
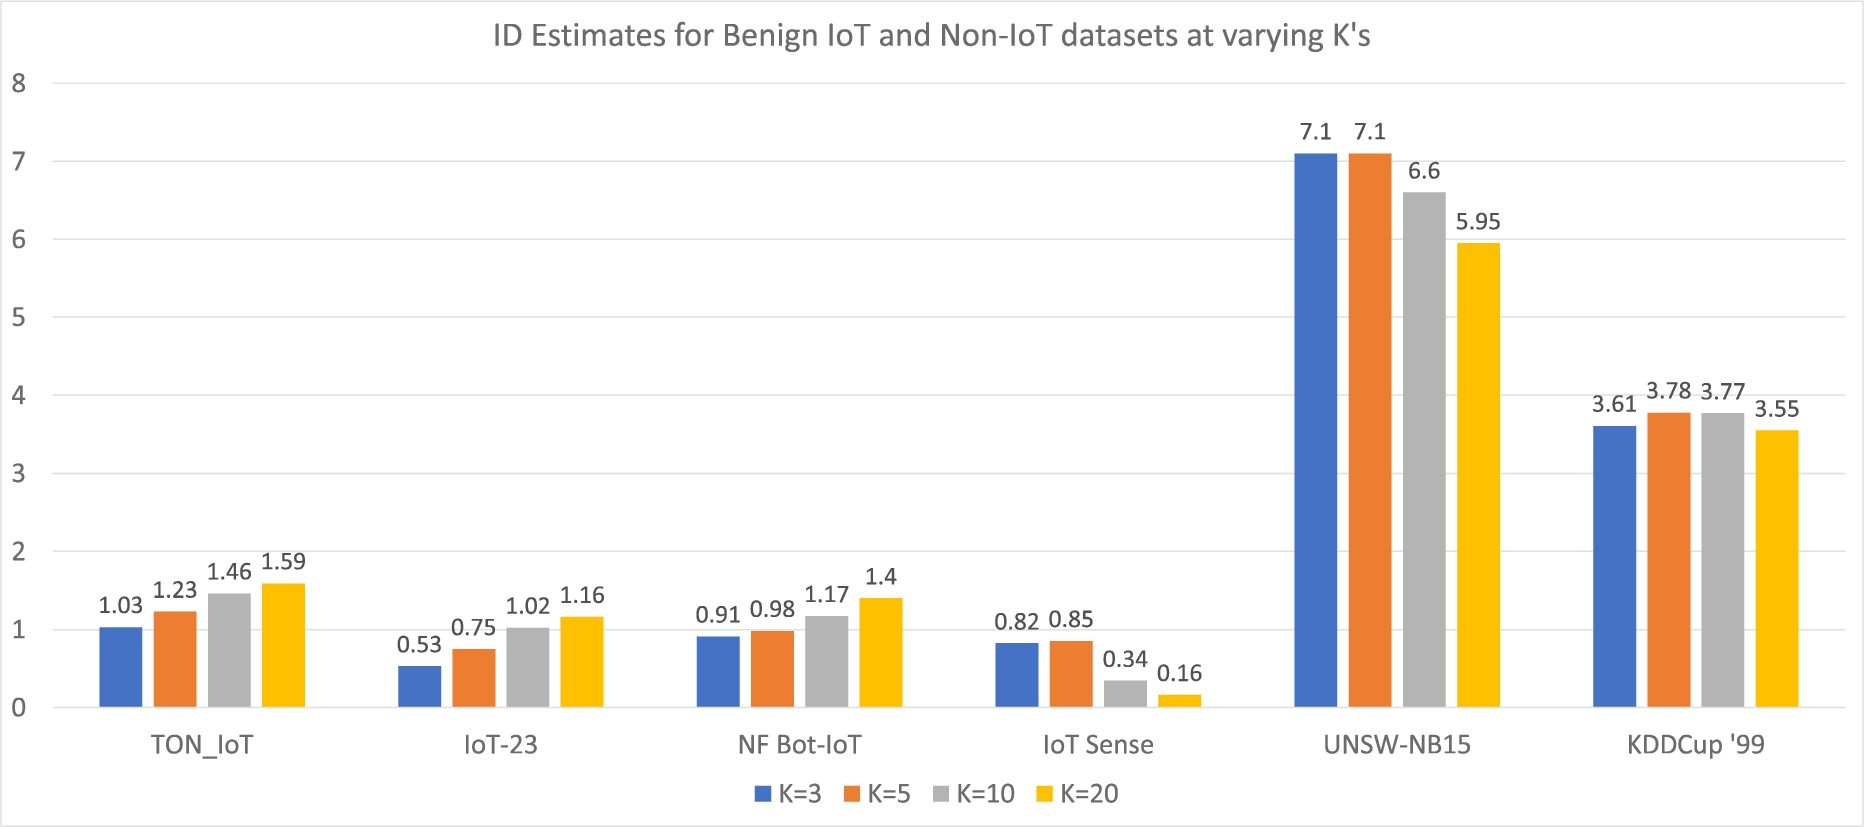
In this section, we analyze benign IoT traffic for specific devices. The purpose of this analysis is to compare device-specific complexity via ID in order (i) verify the behavior of various devices as described in [19] and (ii) reason about the ID values across different IoT devices. We present the results in Fig. 3.
Intrinsic dimensionality of specific devices for each dataset. We use 14 devices from IoT sense dataset plus the 3 real devices from IoT-23 to measure ID. We categorize each value into low (up to 0.5), medium (0.5 to 0.7), and high ID (0.7+). The x-axis represents the three categories (low, medium, high) while the y-axis denotes the exact numbers for each device.
We hypothesize that IoT datasets have lower complexity because the networks contain devices with simplistic behavior compared to non-IoT datasets. For example, devices such as lights and appliances are likely to have more straightforward network interactions compared to devices such as laptops and televisions.
For this task, we need to have the labeled devices in each dataset; however, not all IoT datasets labeled their devices or used simulated devices like IoT-23 for attack data. Consequently, we excluded those from this experiment. We were able to find three real IoT devices in IoT-23 and 14 other real devices from IoT-Sense dataset. We categorized devices into four categories of Lights, Appliances, Hubs/Outlets, and Smart Controller. In total, we have 17 labeled devices with benign traffic, with one device (Phillips HUE Light) in both IoT-23 and IoT Sense. Table 2 reports results of this experiment.
Results for LID experiments for 17 different devices on IoT-23 and IoT-sense
Results for LID experiments for 17 different devices on IoT-23 and IoT-sense
Haefner and Ray [19] defined a spectrum for the complexity for IoT devices, starting with simple devices such as single-purpose machines with low variability in their network interactions to complex devices (like Amazon Echo) with high variability in their network interactions. Similarly, and to simplify understanding of our results, we split ID measures into three categories: Low (0 to 0.5), Medium (0.5 to 0.7), and High ID (more than 0.7+).
In our datasets, 6 of these devices (Omna Camera, Smart Things huB, Netmao Climate, Lutron Hub, Wemo Outlet, and iDevice Socket) are labeled as low complexity devices. Three devices of iView Light, TP-Link Light, and D-Link Camera are labeled as medium complexity. Seven devices are classified with high complexity measures (Wink Hub, Philips HUE light, Door Lock, Musiac Music, AWOX light, and Amazon Echo). Multiple observations can be made here.
First, Amazon Echo has the highest ID value among all devices, which makes sense. In addition, while Haefner and Ray [19] do not measure Amazon Echo directly, they measured a similar device in Alexa. Their results confirmed that Amazon Alexa had a high complexity measure, which matches our findings. Further, the rank order of ComplexIoT is similar to ours: both sets had TP-Link Light, Philips HUE, Smart Hub, and Alexa/Echo devices. ComplexIoT measured TP-Link as the lowest complexity, followed by the HUE, Smart Things Hub, and Alexa. Our measurements indicated that the Smart Things Hub had the lowest complexity, followed by the TP-Link Light, HUE, and Echo. The only inconsistency in the ranks was the Smart Things Hub, where Complex IoT measured a higher complexity value. Otherwise, the order of complexities of each device was the same. The Smart Things Hub could have yielded different measurements between the two results because of varying network captures between the two datasets.
All devices in the low-complexity range are aligned with our understanding of the simple-functionalities of these devices, except the Omna Camera. Like a camera with a high volume of sending and receiving data, we expect it will fall in the medium complexity range, similar to the D-Link Camera. One reason could be that the camera uses a specific protocol for sending images/videos (like UDP) that are not captured in the dataset we had, and only command packets have been captured. Consequently, the LID model does not give it a high value.
In our experiment, we had six lights, and all of them fell into medium and high complexity, a consistent result among them. We had two instances of the same device (Philips Hue light) in two datasets with different sets of features. The results of these two devices are very close to each other, 0.796 and 0.73 for IoT-Sense and IoT-23 datasets, respectively. This shows that regardless of the different features in the two datasets, our proposed approach consistently evaluated the same device, which is promising.
Anomaly detection results
In this section, we extend our findings of ID measurements on IoT networks to the sample level, showing that we can use the localized complexity measurement of LID to detect anomalous behavior.
Algorithm comparison results
We show that all IoT network datasets exhibit low complexity in Section 5. However, benign samples individually fit this same pattern, while malicious activity exhibit’s higher LID measurements when measuring it against a benign baseline. We use this finding to the task of anomaly detection, using three public IoT datasets with benign and malicious examples. Results are compared against each other in Table 3.
Table 3 reports results of our proposed Weighted Hamming LID versus other baseline models of KNN and Weighted Hamming KNN, Isolation Forest, and Autoencoder. We run experiments with four different K values of 3, 5, 10, and 20. Our algorithm outperforms the Isolation Forest in every dataset, the weighted Hamming KNN and Autoencoder in four out of five datasets, and the standard KNN in three out of five datasets. Overall, the algorithm showed the best results in three out of five datasets, which is a significant result.
Results for our model and 4 baseline models. We experiment with K values of 3,5,10, and 20 for the KNN, KNN (weighted Hamming), and weighted Hamming LID estimators, but report best results for each K in each dataset. We choose the K with the best results in the results. K = 5, 10, and 3 give best results for three datasets of NF Bot-IoT, TON_IoT, and IoT-23 respectively. The best ROC and PR for each dataset is in bold
Results for our model and 4 baseline models. We experiment with K values of 3,5,10, and 20 for the KNN, KNN (weighted Hamming), and weighted Hamming LID estimators, but report best results for each K in each dataset. We choose the K with the best results in the results. K = 5, 10, and 3 give best results for three datasets of NF Bot-IoT, TON_IoT, and IoT-23 respectively. The best ROC and PR for each dataset is in bold
The most notable result was with the TON_IoT dataset, where the algorithm outperformed other unsupervised learning algorithms by a large margin. Figure 4 shows the distinct advantage of using the weighted Hamming algorithm over both the KNN and weighted KNN algorithms, with an ROC score more than 0.08 higher than the KNN algorithm and a PR score almost 0.12 above the KNN.
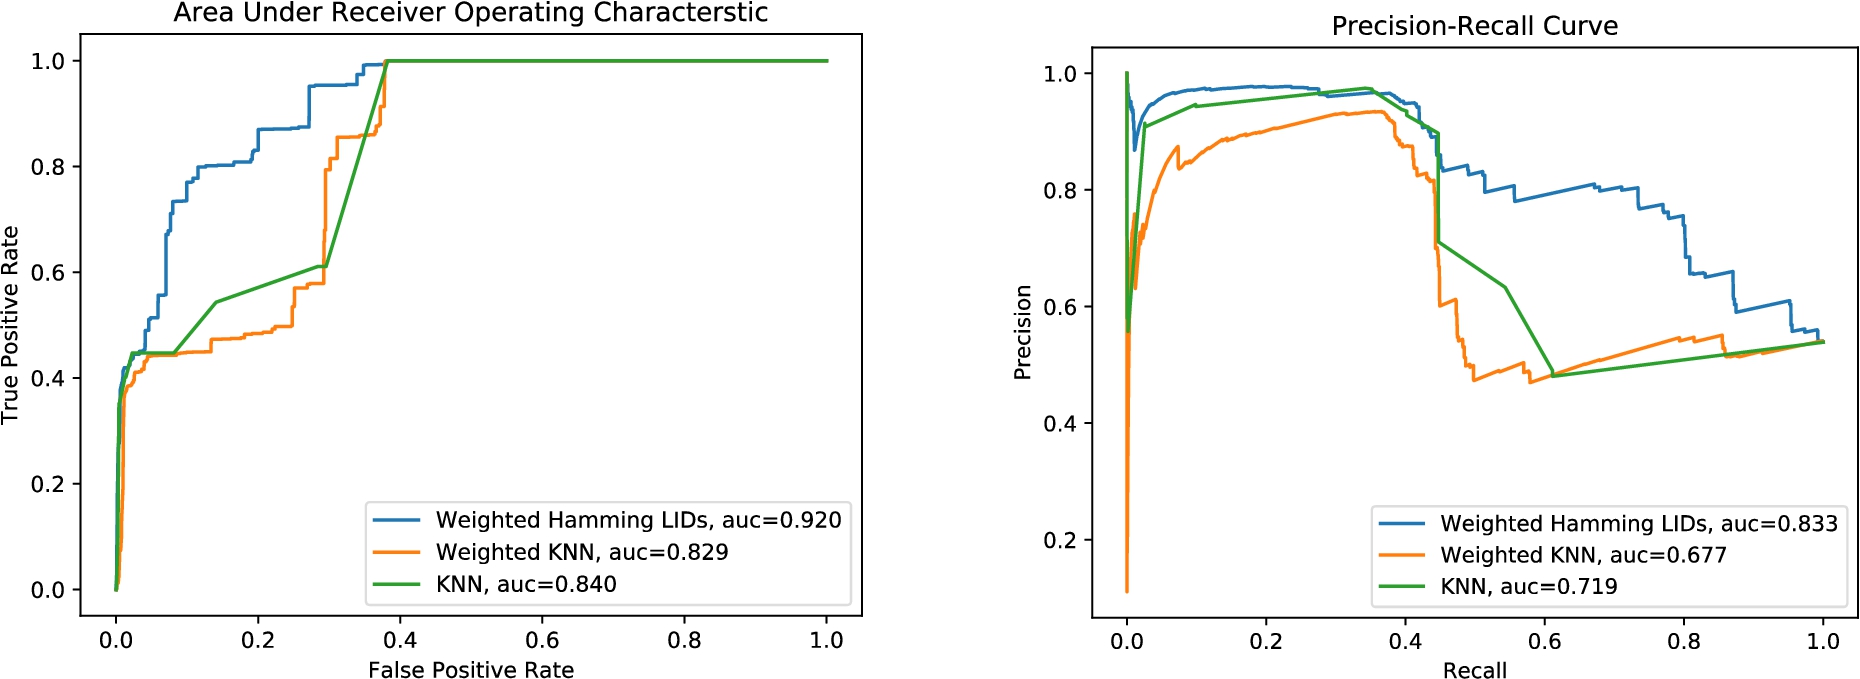
The ROC and PR curves for KNN, weighted Hamming KNN, and weighted Hamming LID on TON_IoT dataset.
Algorithms that performed distance computations to their closest neighbors exhibited the best results (KNN, weighted Hamming KNN, and LID algorithms). Isolation Forest had low results for both TON_IoT and IoT-23. The Autoencoder did well on four out of five datasets, but had nearly random results on TON_IoT.
Results of unsupervised anomaly detection algorithms on non-IoT datasets. Results indicate that the weighted Hamming LID estimator is correlated with the ID estimate of the dataset: for a higher ID, such as the UNSW-NB15, the algorithm performs poorly, while the more moderate ID of Kaggle NID performs better. These values indicate we can use ID as a gauge for how well the weighted Hamming LID anomaly detection will perform. These results also indicate that more complex datasets are better handled by deep learning methods (autoencoder)
Overall, results indicate the Weighted Hamming LID estimator is a strong alternative to classic anomaly detection algorithms such as the Autoencoder, Isolation Forest, and K-nearest neighbors for IoT datasets. The algorithm shows strong results across three different IoT datasets, indicating it generalizes well to several types of attacks and network datasets.
Table 4 shows the poor results of the Weighted Hamming LID algorithm on the non-IoT datasets. Both non-IoT datasets have a higher complexity, which is reflected in their individual samples being closer to zero. As a result, the Weighted Hamming LID algorithm has a harder time distinguishing benign examples from malicious examples. For example, it is harder to distinguish between benign and malicious examples if a device is performing many complex interactions on a network compared to a network full of devices which only do simple things.
In this experiment, we break down our results by attack in each IoT dataset using the Weighted Hamming Distance LID estimator. We group some IoT-23 attacks based on their broad category; for example, we group File Download and Heartbeat attacks as C&C, because these attacks both come from a known C&C server and they have a small overall sample size. The results of this experiment is reported in Table 5,
Results are varied for IoT-23 and TON_IoT; stronger results for NF Bot-IoT. While some attacks are easily recognizable by our algorithm, such as Distributed Denial-of-Service (DDoS) and DoS attacks, others do very poorly, such as TON_IoT’s Ransomware, Backdoor, and Man-in-the-middle attack (MITM) attacks, with Precision-Recall (PR) scores under 0.2 in each case.
The first two datasets in Table 5, IoT-23 and NF Bot-IoT, performed well on all ROC metrics for each attack. Precision-Recall metrics performed slightly worse than ROC in IoT-23, with lower values for Okiru and C&C attacks. We found that both attacks had network packets that were largely indistinguishable from benign network. For example, Okiru attacks were generally TCP protocol with packet count of 1 and low byte count, similar to many benign network packets.
While the results of attack detection using the Weighted Hamming Distance LID estimator are stronger than other algorithms, results on specific attack types show that IoT networks may still be vulnerable in certain cases. In particular, TON_IoT performed poorly on most attacks, leading us to further analyze the data. We found that of 300K benign examples, 61.8% were packets with an exact match with another benign packet, i.e., all 38 features had the same value. Further, more than 26K malicious examples had an exact match with at least one benign sample. These factors indicate that the data generated for TON_IoT has low discriminability when excluding source and destination IPs and ports, as we did. We note in Section 4.7 that the authors of the original papers [2,34] performed supervised classification on TON_IoT, yielding high accuracy using both source and destination IPs and ports. They recommended removing source and destination IPs and ports for further experimentation, however, the remaining 38 features contained identical or close to identical values for benign and malicious examples.
Anomaly detection results for specific attack types available in each dataset. Varied results in individual datasets indicate networks may be more prone to specific attacks in IoT networks
Anomaly detection results for specific attack types available in each dataset. Varied results in individual datasets indicate networks may be more prone to specific attacks in IoT networks
In this section, we provide additional analysis of ID and the Weighted Hamming LID estimator using synthesized data. We hypothesize that adding synthetic data to the benign and attack datasets can provide new insights into the quality of different metrics and algorithms used in this paper.
We use a VAE [23] to generate new synthesized data for both benign and attack sets. VAE’s are generative models with a similar structure to the autoencoder, which additionally have the ability to regularize the latent space (bottleneck) of the autoencoder in order to generate new samples. In particular, the VAE encodes a distribution of a point over the latent space, with the goal of maximizing the likelihood that data point x belongs to a Gaussian distribution –
The resulting model enables us to sample from a Gaussian distribution, which the encoder has fit our dataset to, and produce new synthetic examples produced from the decoder part of the model.
We produce synthesized data for both benign and malicious sets of each dataset independently. To ensure the synthetic data is in alignment with real data, for continuously valued features we map the synthetic feature values to the closest point-wise features in a randomly 2,500 samples from the original dataset. This additional step ensures our model is producing features which have been observed by the network.
To assess the ability of anomaly detection algorithms on synthetic data, we ask the following research questions:
How robust are the anomaly detection algorithms studied in this paper to synthetically generated attacks?
Can we create a more robust unsupervised learning algorithm by including additional synthetically-generated benign samples?
To address Q1, we assess each anomaly detection algorithm against a new synthetically generated attack dataset. Each algorithm uses the benign example set as the training set plus a new synthetically generated benign set, and we measure the ability of the anomaly detection algorithm to detect new synthetically generated attacks. To be consistent with previous sections, our synthetic datasets are the same size as the real attack data.
To address Q2, we create new benign examples using a VAE. We add these new samples to the training dataset along with the real samples, and test the models’ ability to detect attacks given the enhanced training set. We hypothesize that each algorithm will be more robust to attacks with the enhanced dataset.
Quality of synthetic data
Before addressing Q1 and Q2, we first measure the quality of the synthesized datasets. Ensuring our data fits the underlying properties of the original dataset is crucial for success in downstream tasks.
To ensure quality, we analyze two properties of the new synthetic dataset, which we denote
Additionally, we measure each synthetic datasets ROC compared to its real counterpart using the evidence lower bound (ELBO) from the VAE. For example, when generating synthetic samples from the VAE, we pass the examples through the full model to obtain the ELBO. The ELBO can be obtained through the full error function of the model:
After obtaining the ELBO for both real samples and synthetic samples from the benign dataset passed through the VAE, we pass the values through the ROC calculation, with 0’s being real values and 1’s being synthetic values. If the ROC diverges significantly from 0.5, we can consider synthesized dataset as considerably different from the real dataset.
Results for both tests are depicted in Table 6. In the first two rows, we show the ID for the real dataset (row 1) and the synthetic dataset (row 2). We find similar results between real and synthetic datasets for IoT datasets, and higher results for synthetic ID on non-IoT datasets. We conjecture that higher results on non-IoT datasets are a result of higher ID on the original data, leading to the VAE having a more difficult time learning the complexities of the data. For example, VAE’s do very well with simple image datasets such as MNIST, while struggling more on complex colored images such as ImageNet.
Our second data quality test yields affirmative results as to the quality of our synthetic data. ROC scores between X and
Data quality tests. We test our synthetic datasets by comparing ID between real data (first row) and synthetic data (second row), finding that ID estimates are similar in IoT datasets and slightly higher in non-IoT datasets. Our second test, X vs.
ROC, yields almost random results, indicating the synthetic datasets are indistinguishable from real datasets
Our first experiment involves testing various unsupervised anomaly detection algorithms on synthetically generated attacks. Our goal is to test whether new attacks can bypass the various algorithms, in particular the Weighted Hamming LID. To generate new attacks, we train malicious examples on a VAE model, sampling from the latent Gaussian distribution upon completion of training.
In Table 7, we find that the synthetic attacks are more easily detectable than the real attacks across all datasets. For the Isolation Forest, performance improvements are marginal, however for all other anomaly detection algorithms we experience a substantial improvement. In a real world context this has two implications: 1) Attacks similar to those provided in each of the five datasets (i.e. from the same distribution) will be reasonable to detect at the rates observed by each algorithm, and 2) Attackers attempting to maneuver around NIDS systems via synthetically generated attacks may have less success than by using their original approach.
Synthetic attacks. We find that each unsupervised anomaly detection algorithm is robust to new synthetically generated attacks. Performance improvements are substantial for all algorithms except for the isolation forest
Our second experiment involves testing whether unsupervised anomaly detection algorithms can be more robust given new synthetically generated benign examples. We enhance each unsupervised algorithm by appending synthetically generated benign samples onto the real benign sample set. We hypothesize that: 1) A more robust training set will provide better coverage of benign samples compared to the baseline training set, and 2) The enhanced training set will better distinguish benign samples from malicious samples because of this enhanced coverage. For this experiment, our test set consists of the real set of benign samples and the real set of malicious samples.
Results in Tables 8 and 9 show the increased performance of using the enhanced training set across each algorithm. For example, in Table 8, the Weighted Hamming LID estimator improves by 0.026 ROC and 0.034 PR for the TON_IoT dataset. Despite this, the KNN improves even more, with performance improvements of 0.111 ROC and 0.185 PR. In Table 9, we find that the non-IoT datasets achieve even greater performance improvements using the enhanced datasets, with improvements up to 0.469 (Weighted Hamming LID, UNSW NB15) ROC and 0.420 (KNN, UNSW NB15) PR, respectively.
The second part of each Table denotes the performance improvements for each algorithm compared to only using the real data as the training set. While some datasets and algorithms performance dropped marginally, we found that most algorithms achieved improved performance with the synthetic additions to the training set.
Non-IoT datasets enhanced with synthesized samples. Non-IoT datasets see a more substantial improvement compared to IoT datasets. We conjecture that this is because the datasets have more potential for improvement because of increased ID values
In this work, we view several network datasets through the lens of complexity and show that IoT datasets exhibit a lower ID complexity estimate than standard network collections. This finding extends to the point-wise estimation of complexity, where individual samples in (benign) IoT datasets contain low LID measures. We show that benign examples can be identified by either 1) exactly matching the features of a training set sample or 2) by a low LID estimate. We propose a novel algorithm for detecting malicious actors in an unsupervised manner, providing the ability to deploy a model into production with only two hyperparameters needed (k value for distance measurements, and threshold value t). The algorithm is based on the theoretical LID estimation using the Hill MLE estimator, using an entropy weighted Hamming distance for measuring distances between points and features. In addition, we show the benefits of using synthetically generated data to enhance our training set, reporting increased performance across by IoT and non-IoT datasets. Finally, we find that synthetically-generated attacks are easily detectable by various unsupervised learning algorithms.
One potential pitfall of the Weighted Hamming LID algorithm is that it is an expensive computation, requiring distance calculations between a reference point and each point of the training set. Similar to KNN, this calculation can be computationally expensive, and further experimentation is required to measure the performance of such a system in practice. However, state-of-the-art models such as deep networks share this same deficiency: large and typically expensive to run. Further experimentation could provide a thorough comparison of the two.
Another caveat to the algorithm is obtaining a clean dataset. While the unsupervised learning assumption holds when the model is trained with a training set of benign examples, obtaining a reliable benign dataset in an arbitrary IoT network may be problematic in practice since it can be hard to ascertain whether a collection of network packets contains 100% clean data. However, we show the potential to circumvent this issue by creating synthetic examples.
Despite these potential downfalls, our complexity analysis and algorithmic approach provide a novel mathematical look into the details surrounding several IoT network datasets. We show the relative simplicity of these network collections through ID estimates. Additionally, we make connections between complexity in IoT security and open problems in deep learning, such as the difficulty in modeling increasingly complex data such as large images. Connecting the dots between security and anomaly detection in machine learning remains an essential facet of developing secure systems, and we hope this paper can provide researchers with a unique perspective towards building more robust and secure frameworks.
Footnotes
Acknowledgments
This work was supported in part by grants from NSF under award numbers DMS 2123761, CNS 1715458, CNS 1822118 and from grants from ARL, NIST, NewPush LLC, Cyber Risk Research, AMI, and from NIST under award number 60NANB23D152.