
Abstract
Background:
Huntington’s disease (HD) is a neurodegenerative disease with cognitive, motor and psychiatric symptoms. A toxic accumulation of misfolded mutant huntingtin protein (Htt) induces mitochondrial dysfunction, leading to a bioenergetic insufficiency in neuronal and muscle cells. Improving mitochondrial function has been proposed as an opportunity to treat HD, but it is not known how mitochondrial function in different tissues relates.
Objective:
We explored associations between central and peripheral mitochondrial function in a group of mild to moderate staged HD patients.
Methods:
We used phosphorous magnetic resonance spectroscopy (31P-MRS) to measure mitochondrial function in vivo in the calf muscle (peripheral) and the bio-energetic state in the visual cortex (central). Mitochondrial function was also assessed ex vivo in circulating peripheral blood mononuclear cells (PBMCs). Clinical function was determined by the Unified Huntington’s Disease Rating Scale (UHDRS) total motor score. Pearson correlation coefficients were computed to assess the correlation between the different variables.
Results:
We included 23 manifest HD patients for analysis. There was no significant correlation between central bio-energetics and peripheral mitochondrial function. Central mitochondrial function at rest correlated significantly to the UHDRS total motor score (R = –0.45 and –0.48), which increased in a subgroup with the largest number of CAG repeats.
Discussion:
We did not observe a correlation between peripheral and central mitochondrial function. Central, but not peripheral, mitochondrial function correlated to clinical function. Muscle mitochondrial function is a promising biomarker to evaluate disease-modifying compounds that improve mitochondrial function, but Huntington researchers should use central mitochondrial function to demonstrate proof-of-pharmacology of disease-modifying compounds.
Keywords
INTRODUCTION
Huntington’s disease (HD) is a progressive neurodegenerative disease, characterized by motor, cognitive and psychiatric signs and symptoms, caused by an inherited CAG-repeat (glutamine) expansion in the gene coding for the huntingtin (Htt) protein, which leads to misfolding [1]. Accumulation of misfolded Htt is toxic for cells and results in the characteristic neuronal loss of the striatal region in the brain [1]. The exact mechanism for this degeneration is not fully understood, but evidence from HD mouse models points towards changes in metabolism and/or bioenergetics (reviewed by Polyzos et al. in [2]). Mitochondria supply over 90% of cells’ energy needs, are especially sensitive to accumulation of mHtt and disturbances of mitochondrial function are suspected to play an important role in the pathogenesis of the disease [3]. Observed in HD mouse models, mitochondrial dysfunction occurs during the later stages of the disease [4–6]. Striatal cells have a very high energy demand and heavily rely on well-functioning mitochondria [7]. Therefore, it is likely that a disturbance in mitochondrial bio-energetics within striatal cells can lead to neuronal loss. A similar mechanism of mitochondrial dysfunction is thought to be involved in Parkinson’s disease (PD), another neurodegenerative disease, which results from neuronal loss of the also high energy demanding cells that form the substantia nigra. In animals, HD and PD phenotypes, including pathology in the brain and disease specific symptoms, can be induced by administrating mitochondrial toxins [8–11]. Mutant Htt has indeed been shown to localize to mitochondria [12–14] and to interact with the mitochondrial protein import machinery in striatal cells in a mutant Htt knock-in mouse model and in postmortem brain sections of patients with grade 2 HD [15]. Furthermore, mutant Htt directly inhibits mitochondrial protein import in vitro, triggering mutant Htt induced cell death of primary neurons [15]. In patients with HD, several studies have observed a decreased mitochondrial function when compared to healthy volunteers: mitochondrial function in the calf muscle and circulating lymphoblasts and the bio-energetic state of the visual cortex [16–18]. Accumulation of mutant Htt is not specific for the striatum, but also occurs in cells outside the brain, such as muscle cells. Using immunohistology, myofibers of HD patients were found to stain intensely for granules of Htt, whereas myofibers of healthy controls only contained a few granules, which correlated to mitochondrial function [16]. This suggests mitochondria as a pharmacological target to treat HD. Indeed, several clinical trials have targeted mitochondrial dysfunction in an attempt to treat HD [19–21].
In order to prove pharmacology of new compounds in development for the treatment of mitochondrial dysfunction, in vivo biomarkers, that reflect mitochondrial function, are necessary. Ideally, mitochondrial function of the affected part of the brain is measured, which is currently technically not yet possible. The best in vivo alternative available, measuring the bio-energetic state of the visual cortex, indirectly measures mitochondrial function and has not yet been correlated to robust in vitro or ex vivo methods, unlike muscle mitochondrial function, for which these correlations were previously described [22]. However, it is not known how central and peripheral mitochondrial function relate to each other. In this study we explore the relationship between peripheral mitochondrial function in the calf muscle (in vivo) and circulating lymphocytes (ex vivo), central bio-energetics in the visual cortex (in vivo) and clinical function in a cohort of manifest HD patients.
MATERIALS AND METHODS
Participants
All patients were participants in a randomized, double blind, placebo-controlled study with the small peptide SBT-020 from Stealth Biotherapeutics (https://www.clinicaltrialsregister.eu/ctr-search/trial/2016-003730-25/NL). The results of this study have not yet been accepted for publication. The interventional study consisted two parts: Part 1, which was a 7-days multiple, ascending dose study and Part 2, which was a 28-days multiple dose study with the highest tolerable dose from Part 1. There was a washout period of at least 1 month between both parts. Patients were re-randomized before entering Part 2. The data used in this manuscript were from the baseline measurement before dose administration in Part 2. Data from all patients were used in this comparative study. The main inclusion criteria were: DNA confirmed diagnosis of HD with a CAG-repeat expansion of 36 or more; Total Motor Score (TMS) of 5 or more and Total Functional Capacity Score (TFC) of 6 or more on the Unified Huntington Disease Rating Scale (UHDRS); absence of any significant comorbidity.
Medication with an effect on cognitive functioning (e.g., antidepressants) needed to be stable for at least 30 days before study enrollment. Medication with known mitochondrial toxicity (e.g., statins and metformin) were not allowed within 21 days before study enrollment until the end of the study period.
The study was approved by the independent ethics committee Stichting BEBO (Assen, the Netherlands) according to the principles of the Helsinki Declaration under registration number NL59198.056.16, and informed consent was obtained from all subjects prior to study enrollment.
Mitochondrial function
Peripheral mitochondrial function (calf muscle)
Dynamic 31P-MRS in skeletal muscle (i.e., the gastrocnemius muscle of the right leg) was performed at a field strength of 7 Tesla using a surface coil on a custom-built MRI-compatible pedal ergometer (made by the technical instrumentation division of the LUMC, Leiden, The Netherlands). The exercise ergometer was designed to allow the patients to perform isometric plantar flexion exercise by pressing against a foot pedal while lying in the supine position. The foot was strapped firmly to the exercise device using non-elastic Velcro straps proximal to the base of the fifth digit, and the knee was supported. The subject’s lower extremity was secured to the MRI table with straps across the mid-thigh and mid–lower leg in order to isolate usage of the posterior calf muscles. The scanning protocol consisted of localizer sequences and the acquisition of a field map for shimming purposes. Thereafter, 31P-MRS data was acquired before, during and after exercise with a time resolution of 2 s Peak integrals of the inorganic phosphate (Pi), phosphocreatine (PCr) and adenine triphosphate (ATP) signals were obtained using the jMRUI software package. The frequency difference between PCr and Pi was used to calculate tissue pH. A pH of at least 6.8 was required for a reliable τPCr [23].
Peripheral mitochondrial function (circulating lymphocytes)
The mitochondrial membrane potential (ΔΨm) is the major force driving protons across the inner membrane [24, 25], which is in turn the central intermediate of aerobic energy production, and driving force of other physiological processes in mitochondria, such as Ca2 + uptake, antioxidant defence (NADPH generation at the transhydrogenase) or heat production of brown fat. The ΔΨm of a lymphocyte subset of live peripheral blood mononuclear cells (PBMCs) was assessed with flow cytometry as the ratio of fluorescent signals after treatment of the cells with the fluorescent dye JC-1 [26]. Attracted by the positive charge of the inner mitochondrial space, accumulation of the dye leads to a change in fluorescence (“green” to “red”) and a higher ratio of red to green corresponds to a higher ΔΨm. Additionally, we determined the stressability of the mitochondria by treating the PBMCs ex vivo with two medications with mitotoxic properties (carvedilol and verapamil). The technical aspects of the methods can be found in the Supplementary Material.
Central bio-energetic state (visual cortex)
31P-MRS of the brain was performed on a 3 Tesla whole-body MRI scanner (Philips Achieva, Best, The Netherlands). A custom-made 6 cm 31P transmit/receive surface coil was used to detect signals from the visual cortex while limiting muscle contamination. Technical details of the method are described in the Supplementary Material. Using a checkerboard animation (a projection of alternating black and red lights), neurons in the visual cortex are being activated and this activity is measured by Pi/PCr and Pi/ATP ratios [17]. The ratios are a direct marker for the bio-energetic state within the mitochondria [27–33]. In healthy controls, the ratios increase during visual stimulation, whereas in HD patients the ratios stay the same, which reflects the difference in bio-energetics between the two groups [17].
Unified Huntington’s Disease Rating Scale (UHDRS)
The UHDRS is a clinical assessment scale, which is used as the gold standard for motor, cognitive, behavioural capacity and function of HD patients. The method is described in detail elsewhere [34]. The UHDRS was performed by one of three certified physicians to assess the sub-scores total motor functioning (TMS) and the total functional capacity (TFC) [34, 35]. A higher TMS indicates increased motor symptoms and a lower TFC indicates increased functional disability. Apart from assessing drug efficacy, the scores were used as inclusion criteria to ensure that patients were symptomatic, but could still function well enough to participate.
Statistical methods
The statistical analysis was performed using SPSS v25. All missing or incomplete data were treated as such. Pearson correlation coefficients were used to assess correlation between parameters. The threshold for statistical significance was set at p-value < 0.05.
RESULTS
Demographics
A total of 23 patients (10 females and 13 males, Table 1) with manifest HD (TMS ranged 5–53; TFC ranged 6–11) were enrolled in the study, with a mean age of 47.6 years (range 20 to 64 years) and on average HD-related complaints for 7.7 years (ranged 1 to 27 years).
Demographics and baseline values for the UHDRS sub-scores and the PCr recovery time of 31P-MRS of the calf muscle. UHDRS, Unified Huntington’s Disease Rating Scale; TMS, Total Motor Score; TFC, Total Functional Capacity; τPCr, PCr recovery time
Mitochondrial function
In vivo mitochondrial function was assessed in the calf muscles (peripheral) and bio-energetics in the visual cortex (central) using 31P-MRS. A detailed overview of the results is displayed in Supplementary Table 1.
Mitochondrial function in skeletal muscle
The mean τPCr in calf muscle was 39.5 seconds (SD 8.8, min 26.3, max 55.4 seconds). A longer duration for the PCr signal to return to baseline after exercise reflects a lower mitochondrial function [36].
Ex vivo mitochondrial health of lymphocytes
Lymphocytes were assessed for mitochondrial health by measuring the percentage of dysfunctional cells, the absolute membrane potential ΔΨm and the membrane potential collapse induced by carvedilol and verapamil. The average percentage of dysfunctional lymphocytes was 3.6% (range 0.3–23.5%) and the average ΔΨm was 3,518 (range 802–6,082). The average IC50 for induced membrane potential collapse was 0.27 mmol for carvedilol (range 0.13–0.48 mmol), and 0.54 mmol for verapamil (range 0.34–0.78 mmol).
Bio-energetic state in the visual cortex
The bio-energetics in the visual cortex was assessed by determining different ratios in energy metabolism in rest, during and after visual stimulation (see Fig. 1). The ratios are listed in Supplementary Table 1. During rest, the mean Pi/PCr ratio was 0.21 (SD 0.03, min 0.16, max 0.28) and the mean Pi/ATP ratio was 0.19 (SD 0.03, min 0.12, max 0.23). The ratios did not significantly differ when measured before, during or after the visual stimulation, which is in line with literature. Importantly, in healthy volunteers, the ratios would increase during visualization and decrease again during recovery [17].
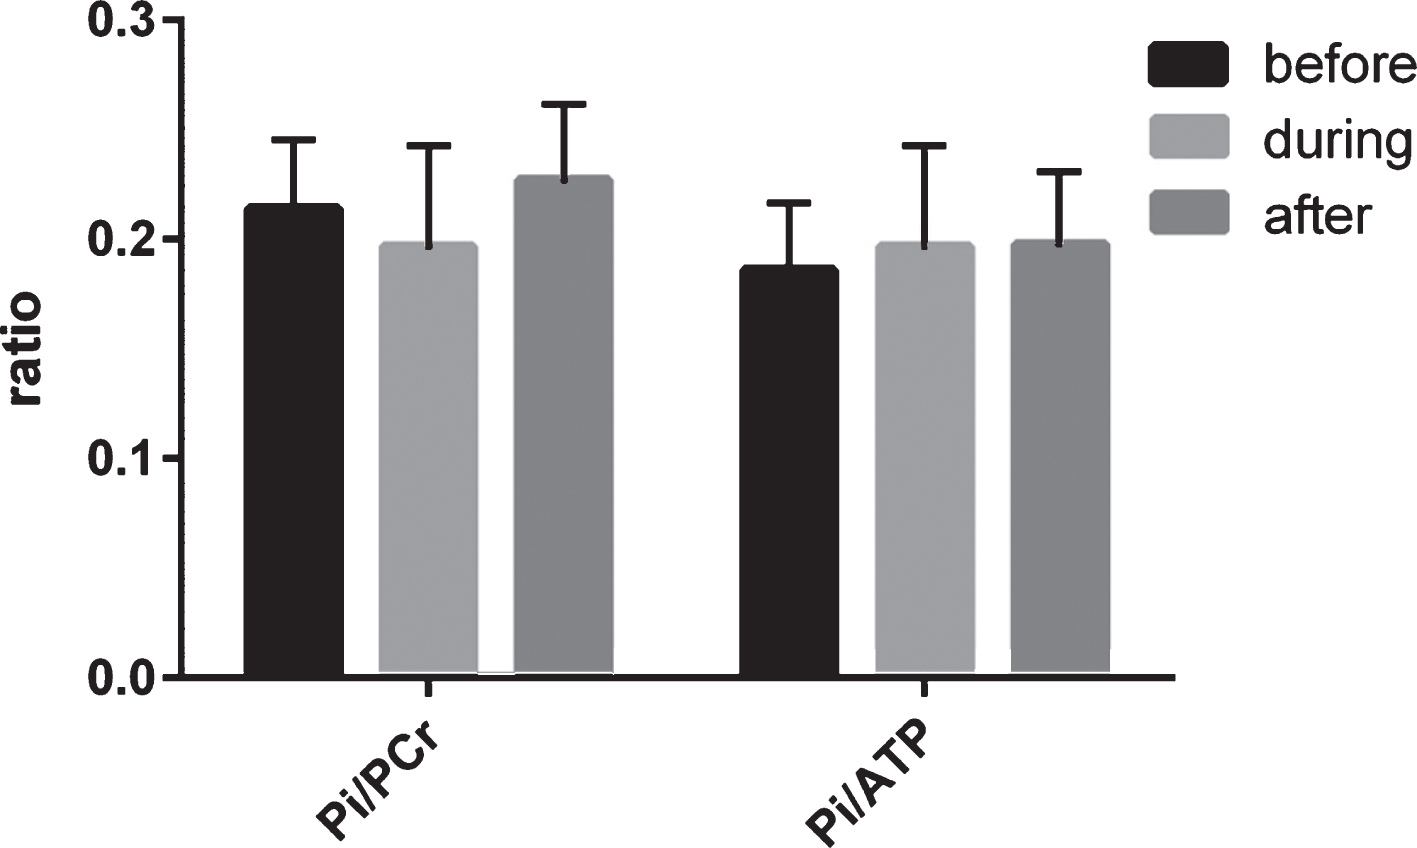
Central mitochondrial function, assessed by phosphorous MRS of the visual cortex before, during and after visual stimulation. Bio-energetics was expressed as the ratio between phosphate energy metabolites. As expected in HD patients, no significant change was observed between the before and during and during and after ratios. Pi, inorganic phosphate; PCr, phosphocreatine; ATP, adenosine triphosphate.
Correlation peripheral versus central mitochondrial bio-energetics
None of the variables for peripheral mitochondrial capacity or health (31P-MRS of skeletal muscle and collapse of ΔΨm in lymphocytes after titration with carvedilol or verapamil) showed correlation with central bio-energetics or clinical function. Pi/PCr and Pi/ATP ratios before visual stimulation showed a significant correlation to clinical function (TMS only), with an r of –0.45 (p = 0.02) to –0.48 (p = 0.03), respectively. The ratios during and after visual stimulation did not correlate to clinical function (TMS or TFC). Pearson correlation coefficients and p-values are shown in Table 2 and Fig. 2.
Pearson correlations between mitochondrial and clinical function in all patients
**Correlation is significant at the 0.01 level (2-tailed). *Correlation is significant at the 0.05 level (2-tailed).
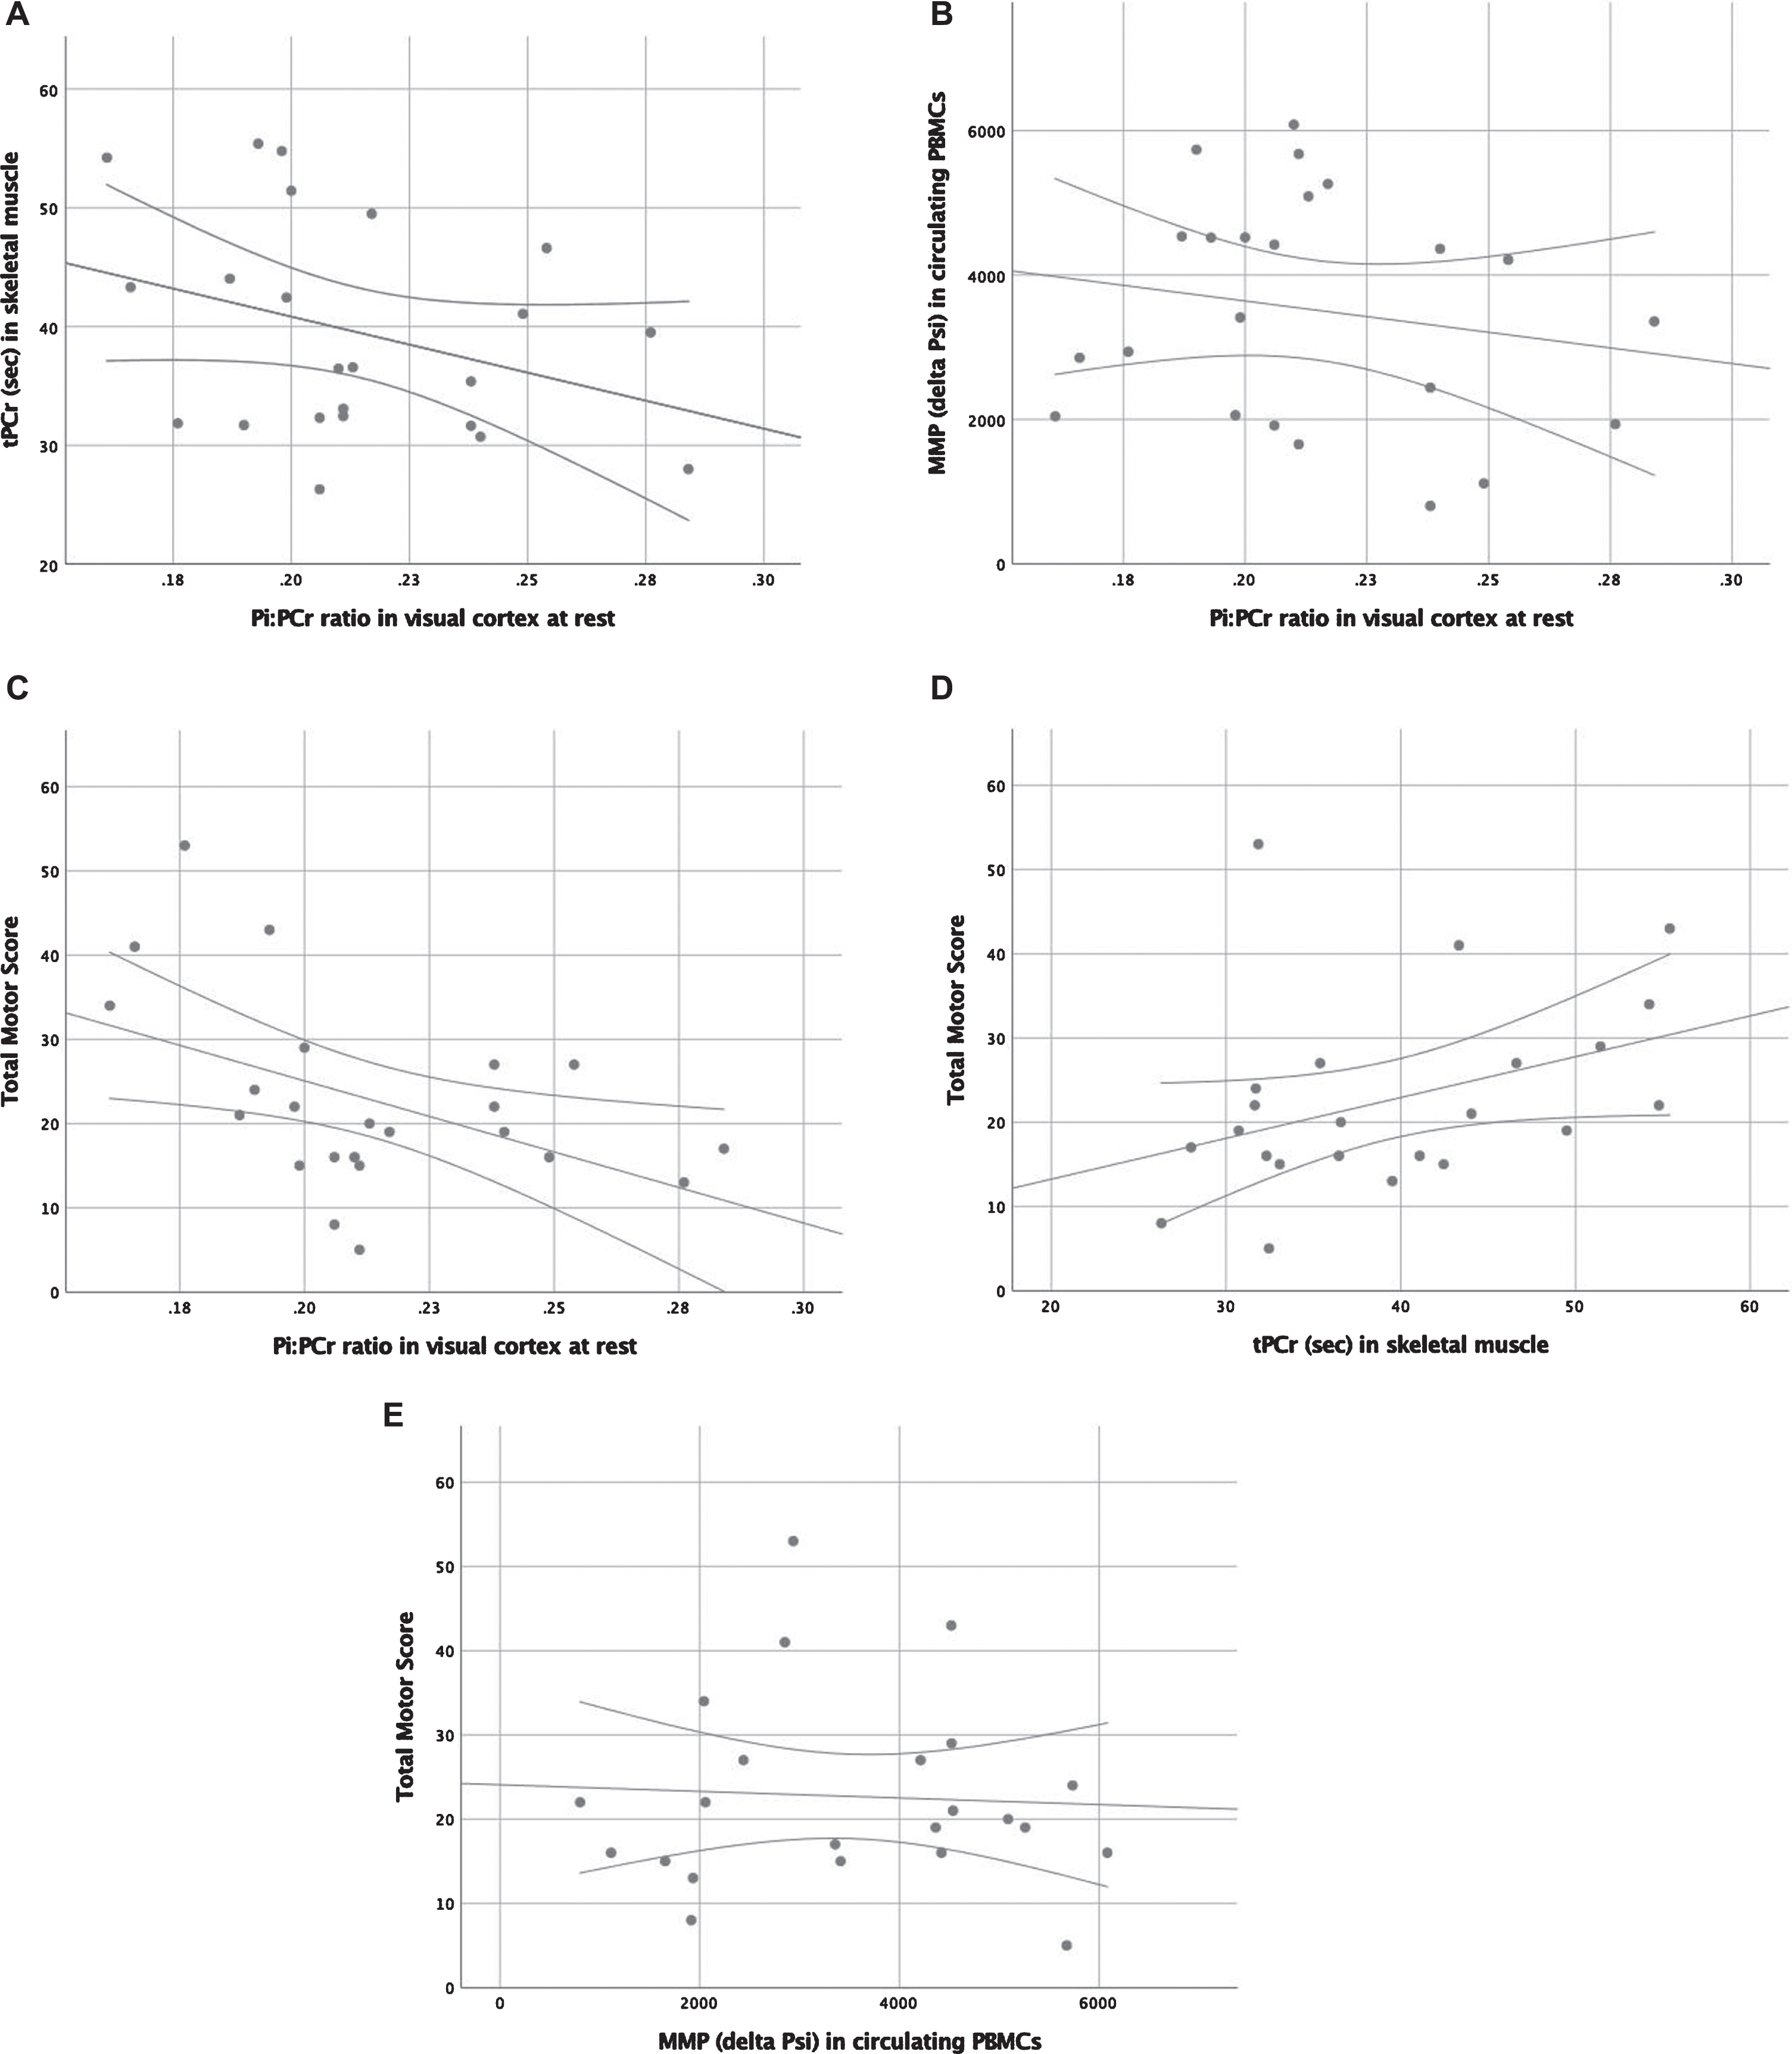
Scatter plots with regression line and 95% confidence interval limits displaying correlations between (A) mitochondrial function in calf muscle and mitochondrial bio-energetics in the visual cortex, (B) mitochondrial health in lymphocytes and mitochondrial bio-energetics in the visual cortex, (C) Total Motor Score and mitochondrial bio-energetics in the visual cortex, (D) Total Motor Score and mitochondrial capacity in calf muscle, and (E) Total Motor Score and mitochondrial health in lymphocytes. * p < 0.05.
Post hoc subgroup analysis
A post hoc analysis was performed in patients (n = 11) with the highest CAG repeat number to investigate if mitochondrial dysfunction would be worse with higher disease load (Table 3). The subgroup consisted of the 11 patients with the highest CAG repeat number (range 43–60). TMS strongly correlated to Pi/ATP ratio at rest (r = –0.76, p = 0.006) and Pi/PCr ratio at rest (r = –0.66, p = 0.03). TFC correlated to Pi/ATP ratio at rest (r = 0.63, p = 0.04) and Pi/PCr ratio at rest (r = 0.68, p = 0.02). TFC also correlated to the difference in Pi/PCr before and during activation (r = 0.67, p = 0.03). Mitochondrial function in muscle did not correlate to bio-energetic state in the visual cortex.
Pearson correlations between mitochondrial and clinical function in the 11 patients with highest CAG repeat number
*Correlation is significant at the 0.05 level (2-tailed). **Correlation is significant at the 0.01 level (2-tailed).
DISCUSSION
Central mitochondrial function based on the bio-energetic state in the visual cortex was not correlated to peripheral mitochondrial function in calf muscle. There was a moderate correlation between central mitochondrial bio-energetics and Total Motor Score within the full patient cohort. The data imply that a larger HD-related disability (higher TMS) correlated to a worse bioenergetic profile (lower Pi/PCr and Pi/ATP ratios) in the visual cortex. When selecting patients with the highest CAG repeat number, the correlation between central mitochondrial capacity and Total Motor Score was strong, with a moderate correlation between central mitochondrial bio-energetics and Total Functional Capacity.
To our knowledge this is the first study, comparing in vivo central to peripheral mitochondrial function in HD patients. Apart from the striatal area, mitochondrial dysfunction in HD patients has been reported in both calf muscle (Saft et al.) as well as in the visual cortex (Mochel et al.) [16, 17]. However, we did not observe a correlation between the mitochondrial function in skeletal muscle and circulating lymphocytes and bioenergetics in the visual cortex. When comparing mitochondrial function to clinical function, we also observed a difference between peripheral and central function. We observed a significant negative correlation between TMS vs Pi/PCr ratio (r = –0.45) and vs Pi/ATP ratio (r = –0.48). In the patients with a higher CAG repeat number than the median, the correlation between TMS vs Pi/PCr ratio (r = –0.66) and vs Pi/ATP ratio (r = –0.76) was stronger, in addition to a significant positive correlation between TFC vs Pi/PCr ratio (r = 0.68) and vs Pi/ATP ratio (r = 0.63). These data show that patients with a higher degree of HD-related pathology have a lower mitochondrial function in the visual cortex. No correlations between clinical function and peripheral mitochondrial function were observed.
We expected a correlation between central and peripheral mitochondrial function, because mHtt is ubiquitously present in mitochondria of HD patients. However, it is known that mitochondrial function is affected differently in different tissues (reviewed by Polyzos et al. in [2]). In postmortem brain samples, complex II, III and IV deficiencies have been observed, whereas in skeletal muscle and platelets complex I is more affected. Even within the brain, there are differences between more and less affected regions: using spectrophotometric assays, ETC enzymes were impaired in the basal ganglia of HD brains, while enzyme activities were unaltered in three regions relatively spared by HD pathology (frontal cortex, parietal cortex, and cerebellum) [37]. In the most affected region of the HD brain, the striatum, complex II–III activity were markedly reduced in both caudate (–29%), while complex II–III (–67%), and IV (–62%) are altered in the putamen [37]. When combined with the fact that mitochondrial disturbances are only universally observed late in the disease progression of mouse models [38], it is plausible that mitochondrial dysfunction is a consequence of a metabolic disturbance, rather than the cause. Additionally, the regional specificity implies that mitochondrial dysfunction develops in response to its changing environment. It is unfortunately not known what this might be. However, suppleting essential substrates to the Krebs cycle through administration of triheptanoin, a long fatty acid which is metabolized into acetyl-CoA and propionyl-CoA, in a pilot study led to the normalization of bioenergetics in the brain of HD patients [19]. A phase 2 study with triheptanoin for efficacy on clinical function measured by the UHDRS is currently running. Mitochondrial dysfunction might not be the direct cause of HD, but could potentially be used to alleviate symptoms.
In other neurodegenerative disorders, mitochondrial dysfunction also plays a role in the pathophysiology via a toxic accumulation of misfolded proteins (hyperphosphorylated tau and Aβ plaques in Alzheimer’s disease, alpha-synuclein in PD, and mSOD1 in amyotrophic lateral sclerosis). The same pattern between central and peripheral mitochondrial function has been observed. In a study comparing mitochondrial function in brain, skeletal muscle and platelet homogenates from idiopathic PD patients [39], mitochondrial dysfunction was found to be part of the pathophysiology of PD (complex 1 deficiency), but limited to the substantia nigra, with normal mitochondrial function in skeletal muscle and platelets. In a study on mitochondrial dysfunction in postmortem brains of Alzheimer’s disease, complex II, III and IV were reduced in activity in the temporal, parietal, entorhinal cortex and hippocampus, but succinate cytochrome c reductase was significantly reduced only in the parietal and temporal cortex. [40]. Although mitochondrial dysfunction is a common phenomenon in neurodegenerative disorders, it is expressed differently. Inside the brain, the most affected areas differ between diseases, as well as the impairment of the mitochondrial respiratory chain complexes activity (complex I, III, and IV in Alzheimer’s disease; complex I and IV deficiency in PD; complex II, III, and IV deficiency in HD; and complex I, II, III, and IV deficiency in amyotrophic lateral sclerosis). Although mitochondrial dysfunction plays an important role, the pathology of neurodegenerative disorders is likely multifactorial.
A reason for the discrepancy between peripheral mitochondrial function and clinical function may be that mitochondrial function in muscle tissue is more influenced by physical activity. It is known that a sedentary lifestyle is associated to a lower mitochondrial function in skeletal muscle in otherwise healthy elderly, which can be improved by increased physical activity [41, 42]. Exercise has also been shown to increase mitochondrial function in the muscle of HD patients [43, 44]. Given that patients with a higher disease severity are more prone to have a sedentary lifestyle due to physical disability, it is difficult to know how much muscle mitochondrial dysfunction is directly disease related and how much is physical activity dependent. Being physically active could boost mitochondrial function in skeletal muscle, but not influence mitochondrial bio-energetics in the striatum, resulting in a lack of correlation.
Improving clinical function in patients with HD and other neurodegenerative diseases, such as PD, has proven difficult due to the progressive nature of neurological pathology, but improving mitochondrial function can be used to show proof-of-pharmacology in an early stage of compound development. Both peripheral and central mitochondrial function measurements could be used, but for different reasons. Peripheral mitochondrial function (31P-MRS of skeletal muscle) has the advantage of being better accessible than the brain and can be combined with other types of measurements (e.g., respirometry on muscle biopsy) and the mitochondrial membrane potential in lymphocytes has been explored as a systemic biomarker for diseases with mitochondrial dysfunction such as Alzheimer’s disease, rheumatoid arthritis and diabetes type 2 [45–47], and as a tool to monitor mitotoxic drug effects, for example of anti-cancer drugs and volatile anesthetics [48, 49]. However, any pharmacodynamic effect in skeletal muscle or circulating lymphocytes might not correlate to the central nervous system and thus not informative when disease modifying is the primary aim of the study. On the other hand, central mitochondrial function (31P-MRS of visual cortex) correlates to clinical function in HD patients and should therefore be used to evaluate pharmacology of compounds being developed for the disease modifying treatment of HD.
This study contains three limitations. First, the number of patients was relatively small, which needs to be considered when interpreting the results. Studies with larger cohorts are therefore needed to confirm the results. Second, caution is advised when comparing different aspects of mitochondrial function in different tissues. Earlier studies have separately investigated different aspects of mitochondrial function and have shown deficits. In this study we have combined these measurements within the same patients for the first time. Although we did not show any correlations between central and peripheral mitochondrial function, the complexity of mitochondrial dysfunction within the pathophysiology of HD warrants further research. Third, our 31P-MRS setup included a phosphorous surface coil, which limited the measurements to the visual cortex. Currently, in vivo 31P-MRS of the brain is an important way to gain insight into bioenergetics in HD patients. While measuring bioenergetics within the striatal area would in theory yield more relevant results to HD pathology, disturbances within the visual cortex have been described before [17]. However, the results from this study should be interpreted with this caution in mind. Additionally, future studies should try to include the striatal area, if technologically possible.
In conclusion, we did not observe a correlation between peripheral and central mitochondrial function in a group of mild to moderate HD patients. Central, but not peripheral, mitochondrial function correlated to clinical function. Mitochondrial function is a promising biomarker to evaluate disease-modifying compounds that improve mitochondrial function, but researchers should use central mitochondrial function instead of peripheral mitochondrial function to demonstrate proof-of-pharmacology of compounds intended as disease modifying.
CONFLICT OF INTEREST
The authors have no conflict of interest to report.
Footnotes
ACKNOWLEDGMENTS
We would like to thank the HD patients for their participation in the study, The Dutch Huntington’s Disease patient organization for their help with recruitment and the clinical staff of CHDR and the LUMC for facilitating this trial.