
Abstract
With the development of society and the Internet and the advent of the cloud era, people began to pay attention to big data. The background of big data brings opportunities and challenges to the research of urban intelligent transportation networks. Urban transportation system is one of the important foundations for maintaining urban operation. The rapid development of the city has brought tremendous pressure on the traffic, and the congestion of urban traffic has restricted the healthy development of the city. Therefore, how to improve the urban transportation network model and improve transportation and transportation has become an urgent problem to be solved in urban development. Specific patterns hidden in large-scale crowd movements can be studied through transportation networks such as subway networks to explore urban subway transportation modes to support corresponding decisions in urban planning, transportation planning, public health, social networks, and so on. Research on urban subway traffic patterns is crucial. At the same time, a correct understanding of the behavior patterns and laws of residents’ travel is a key factor in solving urban traffic problems. Therefore, this paper takes the metro operation big data as the background, takes the passenger travel behavior in the urban subway transportation system as the research object, uses the behavior entropy to measure the human behavior, and actively explores the urban subway traffic mode based on the metro passenger behavior entropy in the context of big data. At the same time, the congestion degree of the subway station is analyzed, and the redundancy time optimization model of the subway train stop is established to improve the efficiency of the subway operation, so as to provide important and objective data and theoretical support for the traveler, planner and decision maker. Compared to the operation graph without redundant time, the total travel time optimization effect of passengers is 7.74%, and the waiting time optimization effect of passengers is 6.583%.
Introduction
The city is a complex and complex system. The population, resources, environment, economy, and society all influence each other and promote each other. With the rapid development of the economy and the increasing population of the city, the city is also expanding. Especially in large cities the metro network plays an increasingly important role as a means of urban transportation. According to the data, as of the end of 2017, 33 cities in mainland China have opened subways, with a total operating mileage of 3881 kilometers. Metros in the first and second tier cities have entered the stage of network operation. With the rapid expansion of the subway network, the passenger traffic of the subway has risen sharply, and the contradiction between transportation capacity and large passenger traffic has also intensified. The subway accounts for nearly 80% of the urban rail transit and has become the most important public transport in the city. The normal passenger transportation facilities used by the station to carry out passenger transportation can be a certain amount of passenger traffic. Once there is a large passenger flow, it is likely to cause congestion. When the disorder is out of control, even a stampede may occur, which poses a major safety hazard to the people and property safety. In the daily life, it is necessary to ensure the safe, stable, fast and orderly operation of the subway and the safe passage of subway passengers. Therefore, the study of urban subway transportation mode is of great significance.
At present, scholars at home and abroad have conducted research on the congestion mechanism and propagation model of passenger traffic in urban rail transit networks. Yanfang et al. [30] first defined the concept of peak traffic propagation in urban rail transit, and explored the mechanism of peak propagation and its impact. Subsequently, some scholars modeled the crowded propagation of orbital passenger flow. Literature [4,8,23,25] focuses on the effects and dynamic processes of crowded propagation. In terms of passenger flow inflow control, the literature [6,10,12,27,28] is a numerical calculation method of current limiting with the main purpose of reasonable distribution of line capacity and station passenger flow balance. Chen et al. [13] used the theory of disease transmission based on the network congestion model to establish a large-scale passenger flow congestion network disease propagation model. The research indicates that the pathological transmission of super-large passenger flow in rail transit is affected by the probability of infection, the probability of recovery, and the number of initial congestion stations. This connection provides a new research idea for the crowded propagation of large passenger flow networks. Pu [7] established the urban rail transit operation network station topology model and the passenger flow congestion propagation SIR model, and simulated the passenger flow congestion behavior, and obtained the passenger flow congestion propagation law. The results show that the congestion and convergence of passenger traffic congestion in urban rail transit operation network has volatility and convergence. Zhichao [1] proposed an unconstrained burst large passenger flow evolution model, simulating its evolution process in the network, revealing the evolution mechanism of urban rail transit sudden large passenger flow and expounding the theoretical basis of emergency strategy. Xiaoxia [11] abstracted the propagation path of sudden large passenger flow in urban rail transit network into a tree structure, qualitatively analyzed the diffusion characteristics, and discussed the propagation law of sudden large passenger flow under different parameters according to the model. Yunqin [19] used network efficiency as an indicator to evaluate network reliability, and compared the network reliability of Beijing rail transit network under the assumption of random attack and selective attack. Yinan [18] studied the calculation method of urban rail transit passenger flow under the condition of sudden large passenger flow, and calculated the occurrence of passenger flow forecast of urban rail transit network by superimposing daily passenger flow and sudden large passenger flow results. Zhiqiang [20] applied the two evaluation indexes of “global connectivity efficiency” and “local connectivity efficiency” of urban rail transit network, and qualitatively analyzed the characteristics of passenger flow in the case of sudden large passenger flow interruption, and formulated emergency response assistance according to network characteristics decision making and related evaluation indicators. Jingjing [2] proposed the network relationship network model of Shanghai rail transit, analyzed the network reliability of different lines under two kinds of attacks, and proposed countermeasures to ensure the reliability of urban rail transit operation from space and time. Fanyu [5] applied the user equilibrium distribution principle to the urban rail transit network, and compared the passenger flow distribution characteristics under different road network structures such as single line, parallel line and ring line. The urban rail transit travel impedance function under crowded conditions is also proposed, and the distribution model is constructed. Liwei et al. [3] proposed the passenger density impact model and the train running delay model in the waiting area of the station, and analyzed the effect of train running delay caused by the sudden large passenger flow. In addition, many research scholars have gradually focused on the forecast of urban rail transit passenger flow in the short term. Sugiyama [15] proposed a real-time passenger flow forecasting method for urban rail transit; Yu [21] proposed a hybrid EMD-BPN prediction method to solve short-term passenger flow forecasting problems; Ozerova [14] used inter-city commuter passenger flow as the research object. The influencing factors of commuter passenger flow are analyzed, and the linear regression method is used to predict the commuter passenger flow. In addition, Jun et al. [22] also established a dynamic feedback neural network model to predict the short-distance passenger flow of urban rail transit. However, their research has obvious flaws in the actual application process, and the related models cannot be reasonably applied.
Most of the existing researches are on the study of highway transportation networks, but there are only a handful of studies on urban subway transportation. At the same time, for the main body of the traffic – pedestrians, but did not fully study their behavior. The behavioral trends of target individuals are extremely important for predicting the degree of congestion in traffic. The current era is the era of big data. If the data obtained is not fully excavated, the problems encountered in transportation will not be properly handled. The same is true for the study of urban subway transportation modes.
In the context of big data, this paper studies urban subway traffic patterns based on human behavioral entropy. Behavior is an external activity that people show under the control of autonomy. People’s behavior is the result of a variety of external and internal factors, and always has a certain purpose. Therefore, analyzing the psychological motives helps to understand the statistical laws of behavior. Zhongke [26] constructed an individual behavior prediction model through behavioral entropy. Suicidal behavior as a predictive target behavior, to a certain extent portrayed the behavior trend of the target individual. Jing [9] studied the behavior of Sina Weibo user behavior and the dynamic change pattern of user interaction with time by using behavior entropy, and found that the direct interaction relationship of users is relatively stable and does not change due to time changes. Shunlin et al. [17] optimized the user behavior path of “Internet +” logistics information security management, and abstracted the information security problem of the network into the shortest path that does not repeatedly connect the user entropy values of all nodes, through explicit eigenvalues to reveal the degree of risk of logistics information security management. Behavioral entropy has many applications in the field of behavioral science and can describe human behavior very well. Therefore, combining big data with behavioral entropy can be applied to the study of urban subway transportation mode. The innovation of this paper is that most of the existing researches are on the highway transportation network, while the research on the urban subway traffic is very few. And this article combines big data and behavior entropy in the study of urban subway transportation, which can describe human behavior well and provide a constructive reference for subway operation and passenger travel.
In order to explore the urban subway transportation mode under the background of big data, it provides a constructive reference basis for subway operation and passenger travel. This paper takes passenger travel behavior in urban subway transportation system as the research object. Based on the integration of a large number of existing research results, based on historical travel data, the behavioral entropy related theory and method are used to study the diversity of passenger travel behavior. At the same time, from the perspective of pedestrian speed-density relationship, pedestrian flow–density relationship, the congestion degree of subway stations is analyzed. When the peak passenger traffic increases and the order is disordered in the morning and evening, big data information can be used to realize the peak passenger flow forecast and burst. Finally, considering the operation status of urban subway traffic, the optimization model of subway train stopover redundancy time is established to improve the efficiency of subway train operation, reduce the waiting time of personnel in the subway station and the safety hazard caused by the number of people in the station exceeding the number of qualified personnel. The application of the Internet of Things has brought a stable operation effect to urban subway transportation. The Internet of Things can calculate the passenger flow of urban rail transit under the condition of sudden large passenger flow, and superimpose the results of daily passenger flow and sudden large passenger flow to calculate the city. The predicted incidence of passenger flows in the rail transit network.
Method
Logistic regression analysis
One of the key steps in calculating behavioral entropy is the determination of the associated attributes of the target behavior. There are two kinds of behaviors due to the target behavior: either happen or not. This is a two-category type variable, so you can use unconditional Logistic regression analysis to do the job. As an effective analytical method, Logistic regression analysis has been widely used in many research fields, especially in information processing, biology, medicine and other applications [16]. It is commonly used to screen out variables with significant impacts from multiple suspicious influencing factors. It also includes examining whether a single factor is a factor affecting the occurrence or not of an event.
The principle of the Logistic regression model is that the value relationship between the dependent variable Y (target behavior) and the independent variable
It may be assumed that the probability that the dependent variable Y occurs is π, and the probability that the opposite side Y does not occur is
Thus, the value range of
The constant term
Behavioral entropy
Meaning
The German physicist Clausius proposed the entropy concept and the entropy law in thermodynamics in 1865 [29]. Entropy is a description of the disordered state of thermodynamic systems. The increase of entropy means the increase of system disorder and the decrease of order. The decrease of entropy indicates the increase of system order and the decrease of disorder. The law of entropy describes the law of the evolution of isolated systems, that is, the isolated system always spontaneously evolves toward the direction of entropy increase, which degenerate the system from ordered to disorder.
Thermodynamic entropy characterizes the complexity of the state of motion at the microscopic scale [24]. Information entropy characterizes the degree of uncertainty in the appearance of signals during communication. Behavioral entropy draws on the definition of both: the individual’s behavioral entropy represents the degree of certainty of individual behavioral attributes. The more individual the behavioral entropy is, the easier it is to produce behavior. The smaller the behavioral entropy, the less likely it is that individuals will behave.
Behavioral entropy has its own characteristics: 1) Behavioral entropy is a means of quantifying individual behavioral trends. The magnitude of the behavioral entropy indicates how likely the individual is to behave. 2) Behavioral entropy does not always increase. When the behavioral entropy value reaches the peak value, the behavior of the associated attribute is reduced and the behavior entropy value is also reduced due to behavioral release or behavioral inhibition. 3) Behavioral entropy is also an effective method to measure the degree of change in the state of an individual’s attributes. The smaller the individual attribute changes (large), the smaller the individual’s behavioral entropy (large).
Behavior entropy calculation
(1) The influence of attributes. A single behavior attribute has a certain influence weight when determining the target behavior. This weight determines the amount of influence an attribute has on behavior. In fact, the influence of behavioral attributes on behavior still has a certain time effect. The typical performance is that as time t increases, the property influence force F also increases. Therefore, the influence of behavioral attributes on behavioral behavior changes over time. Such a time-dependent functional relationship is called the influence aging function
According to the aging function
Where
The formula for behavioral entropy:
The formula shows that behavioral entropy is a function of time and is a dynamically changing value. The value of behavioral entropy also represents the trend of behavior.
(2) Behavior entropy calculation algorithm. Input: initial behavior feature set
Output: Behavior Entropy H
Algorithm steps:
Step 1: Perform preprocessing for different types of attributes. After the initial set C is processed,
Step 2: Using the two-category Logistic regression analysis combined with expert experience, select the feature attribute subset
Step 3: Analyze the influence weight of the attribute
Step 4: Determine the aging function. According to the failure function
Step 5: Calculate the behavior entropy of the predicted target according to the calculation formula of the behavior entropy
Station congestion
Congestion is a gathering characteristic of pedestrians that reflects the comfort of pedestrians during exercise. When the platform density is large, the pedestrians are greatly affected by the interaction force of the surrounding people, and the walking speed of pedestrian decreases with the increase of density. When the platform density is small, the pedestrians are less affected by the interaction force of the surrounding people, and the walking speed of pedestrian increases with the decrease of density. In this section, based on the actual survey data, the pedestrian behavior is modeled, the station congestion degree is analyzed, and the station congestion degree index is established. The definition of the congestion degree
In the above,
When the value is greater than 1, it indicates that the demand space during the pedestrian movement will inevitably be occupied by other pedestrians, and the pedestrian speed will be affected by the mind. During peak periods, if the congestion level of an area exceeds the value set in the severely crowded state, the pedestrian speed will decrease, affecting the movement of getting on and off. As the pedestrian density increases, the pedestrians are more and more obstructed by the surrounding people during the walking process. When the density increases to a certain extent, pedestrians will be congested.
Congestion indicators are established for key information such as pedestrian speed, density, and flow, which reflect the passenger flow status of the station. Its relational expression is as follows:
Where Q is the pedestrian flow,
Subway stop station redundancy time optimization model
Mathematical model of subway train stop time
A mathematical model of the stop time is established for the passenger getting on and off the process, assuming that there is a linear relationship between the stop time and the number of people on and off the doors. Under the ideal assumption, the linear model of the train stop time and the number of passengers getting on and off is simplified.
Wherein,
Different stations have the corresponding ability to attract passengers due to factors such as their business environment, geographical location and whether they can transfer. Therefore, the distribution pattern of the number of passengers arriving at each station is similar, but the parameters of the specific distribution function are not consistent with the expected variance and other parameters. The required stop time corresponding to the number of passengers expected to arrive at each subway station is
In the above formula,
City subway traffic map.
Using the above-mentioned mathematical model of stop time, the random arrival law of passenger flow is transformed into the stop disturbance law, which is loaded into the running line generated under any redundant time allocation scheme as a random disturbance scenario to simulate the disturbance and stop redundancy time. The total travel time of the passenger is calculated by loading the actual running condition of the simulated train under disturbance, and the anti-interference performance reflected in the operation plan is evaluated to obtain the optimal result.
Before building a model, first make the following assumptions: a. the background of the experimental study is a parallel equidistant operation diagram. If the line is not considered, the tracking train interval buffer time is set to a fixed value; b. A virtual train is operated before and after the study period; c. The random disturbance scenario only considers the stop work disturbance; d. Random disturbance scenarios do not consider unconventional passenger flow increments, such as various large events, like concerts; e. When the random disturbance scenario is loaded, the passenger arrives evenly and the rate at which the passenger arrives at each station in any random situation is fixed, and the proportion of the number of passengers arriving at the subsequent stations remains unchanged; f. Temporarily not taking the passenger occupancy situation into consideration, it is considered that the passengers arriving before the current train arrival time can take the current train.
Known conditions: a total of J stations, numbered
Based on the above assumptions and known conditions, the optimization model is established with the minimum passenger travel time as the minimum:
The total travel time in the above objective function consists of two parts, passenger waiting time and passenger time, where
The purpose of establishing the constraints and restrictions is as follows:
In order to fix the research period determined by each departure line departure time and the final arrival time, the train operation start time and the final arrival time constraint are set:
In order to describe the train interval operation activities, set the interval running time constraint:
Describe the train stop activity and stop redundancy time
In order to ensure the allocation of the stop redundancy time, it is also necessary to meet the basic requirements of the system for the stop time, and set the minimum stop operation time constraint:
In order to ensure that the sum of the redundancy times of the stop lines on a single operation line in the operation diagram preparation cannot be greater than the upper limit value, the upper limit constraint of the total stop time of the stop station is set:
Experiment
Data source
The experiment in this paper is based on a certain line of Shenzhen Metro. The data is mainly from the statistics of the subway stations and passengers on the line.
Experimental environment
The application research of urban subway traffic mode based on behavioral entropy in the context of big data proposed in this paper is designed and implemented on ordinary PC.
Hardware configuration:
CPU: Pentium(R) Dual-Core CPU E5800 @ 3.20 GHz
Memory: 4G
Software configuration:
System: 64 bit win10
Development environment: MATLAB 2014B
Results
Result 1: Calculate the target behavior entropy. The influence of attributes on behavior is divided into two parts: attribute weights and time-effect functions. The aging function is a function of time that reflects the nature of the property change. However, due to the existence of individual differences, μ and σ in the aging function need to be determined on a case-by-case basis. For users who often use the subway as a means of transportation and use the subway card to pay, through the analysis of the user’s riding behavior through big data, it can provide reference for the urban subway traffic mode. The user’s gender age, travel time, upper and lower subway train stations, and subway train transfer are all attribute characteristics of the user. These attributes also reflect the user’s habitual behavior. Through the behavior entropy calculation method mentioned above, the predicted values of the behavior entropy of the target individuals T1, T2, T3, and T4 are as shown in Fig. 2. In the figure, the abscissa number indicates Monday to Sunday of the week, and the ordinate indicates the calculated target behavior entropy value.
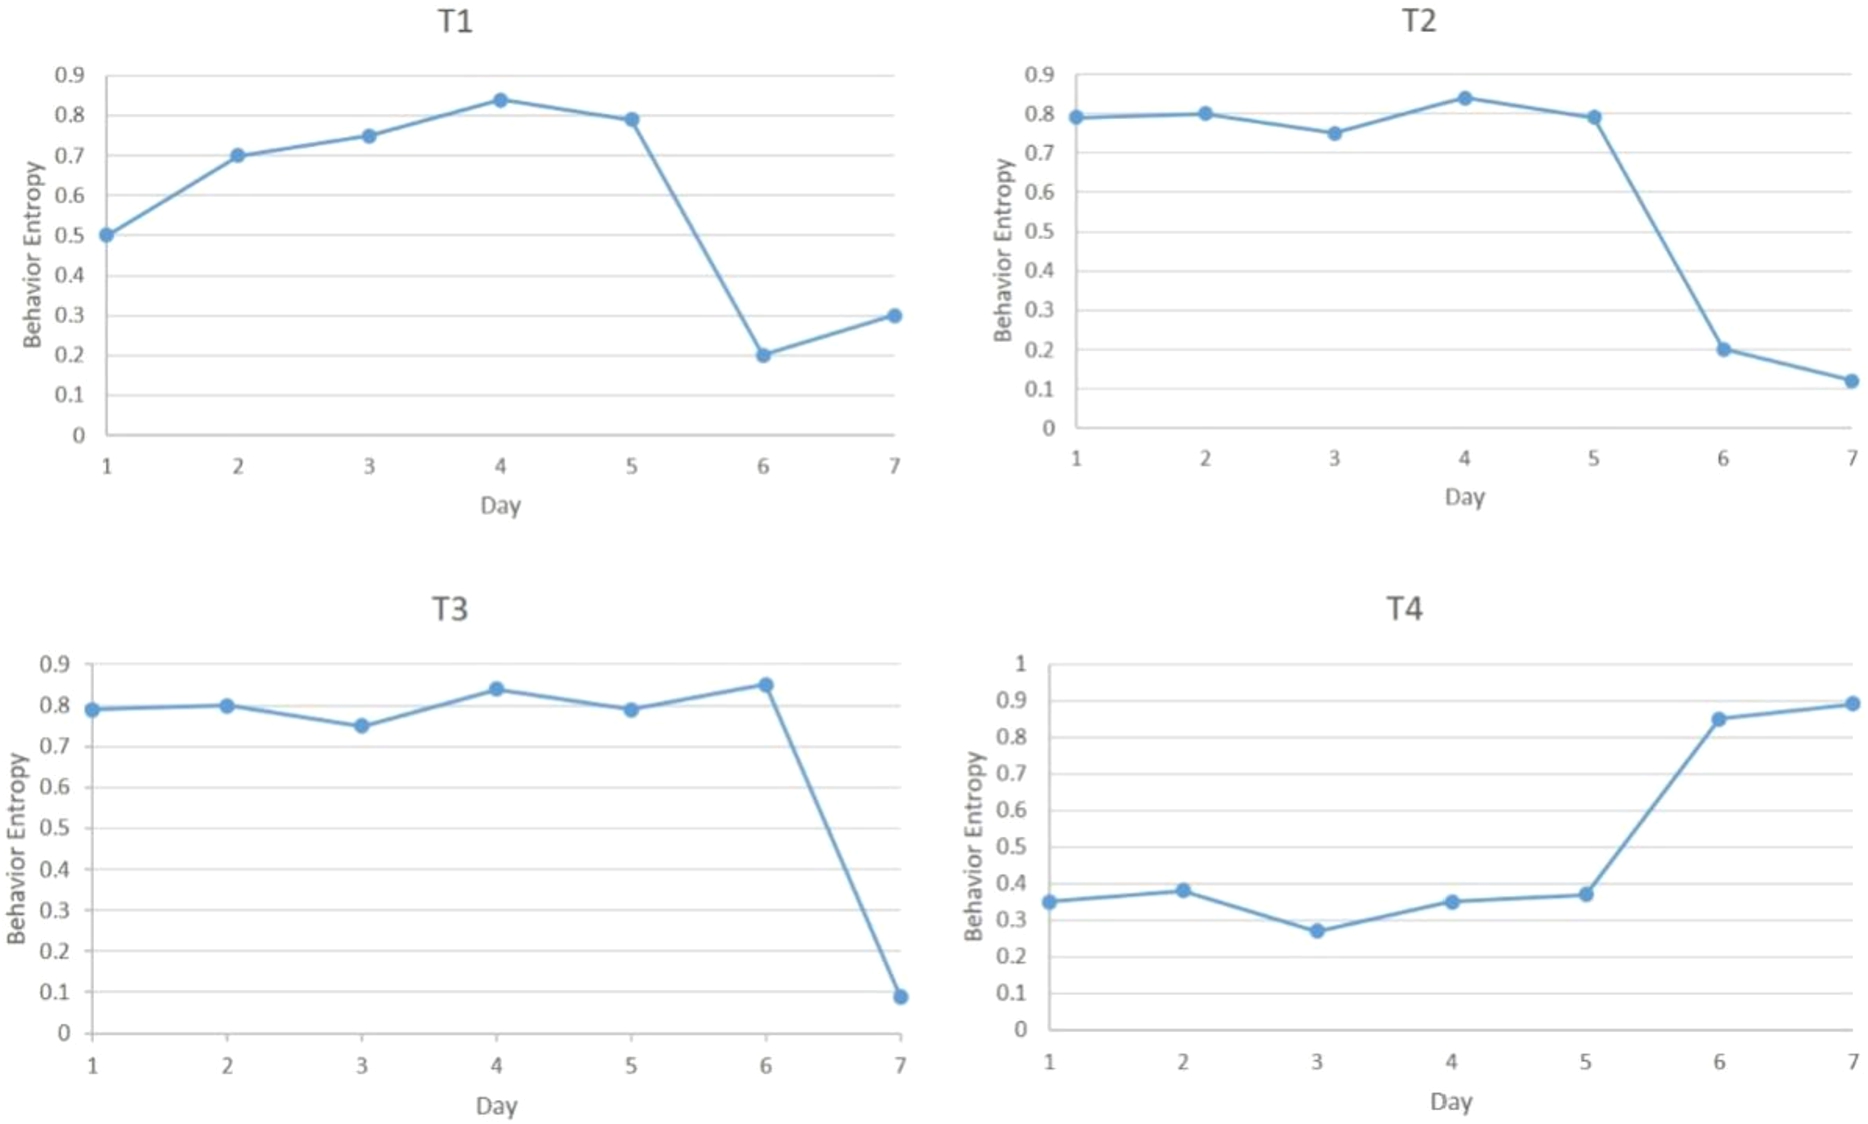
Predicted behavioral entropy of target individuals T1, T2, T3, T4.
Result 2: Station congestion. After the on-the-spot investigation, an example simulation of the relationship between pedestrians getting on and off the platform and the platform density during the peak period was carried out. The station congestion degree is divided into three levels: when the station density is higher than
After statistical station pedestrian speed, density, and flow rate, the data is analyzed and processed, and the average values of velocity and flow rate under the same density condition are calculated. Then, the sample data is fitted based on the least squares method, and finally the pedestrian movement speed and density are obtained. The relationship between the flow rate and the flow rate is shown in Fig. 3. The flow–density relationship is shown in Fig. 4. Pedestrian speed–the density fitting relationship is linear, the fitness is 0.835, and the flow–density fitting relationship is a quadratic polynomial relationship with a fitness of 0.887.
Average station density
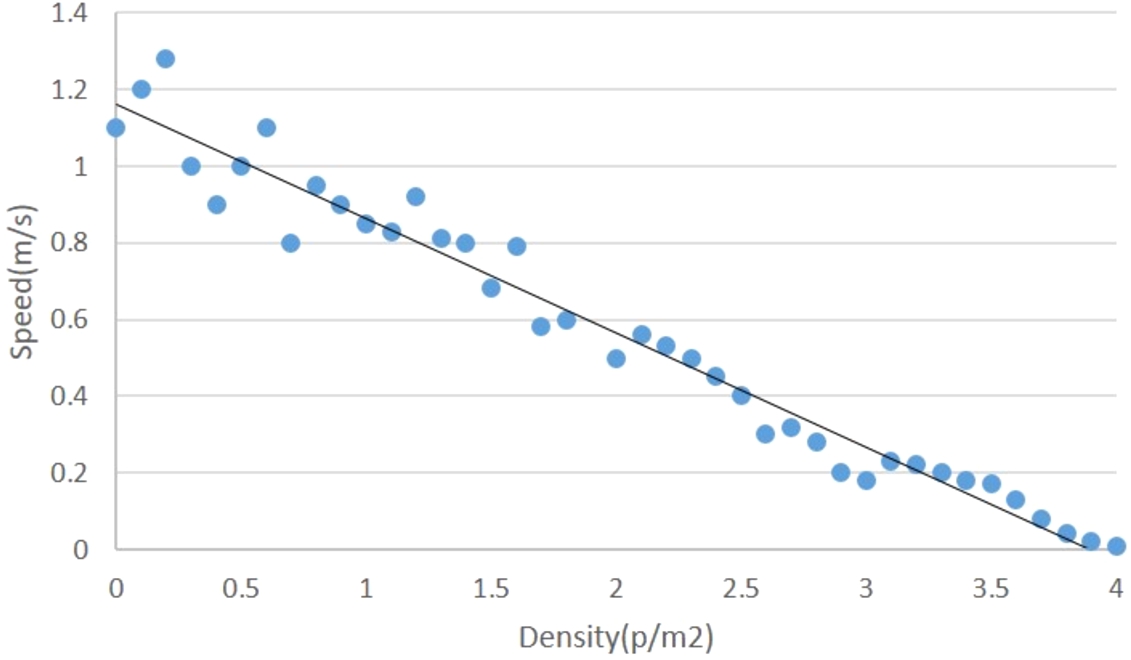
Speed–density relationship.
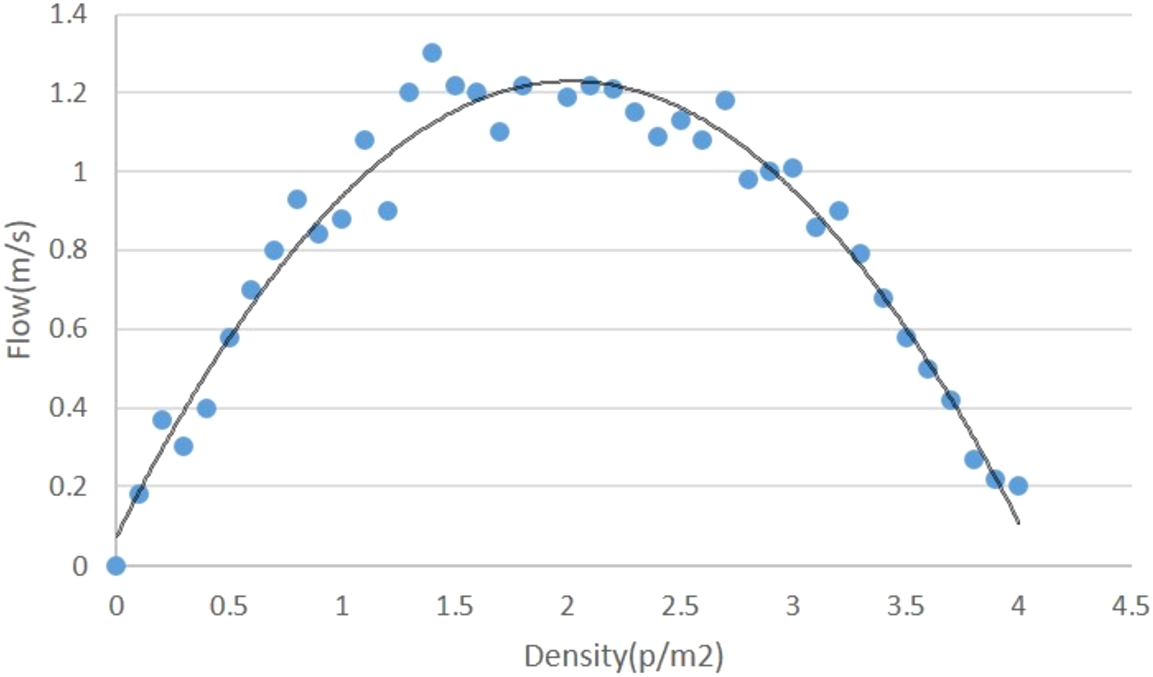
Flow–density relationships.
Result 3: Redundancy optimization of subway train stops time. The total length of the selected subway line is 20.3 kilometers, the number of stations is 11 and it is recorded as S1∼S11, and the 10 sections are recorded as B1∼B10 respectively. The train operation adopts the station stop principle. The travel time from the first station to the last station is 1850s. The operation time of each interval is shown in Table 2.
According to the upward trend of the train in the uplink direction of the train to the information and passenger flow data for statistical induction, the distribution law of passenger arrival rate of each station is obtained. According to the stop time model, the expected stop time of each station is obtained, which is recorded as
The objective function is solved, and the layout scheme of the stop redundancy time according to the uneven distribution of the passenger flow is obtained as shown in Table 4. The total travel time of this model optimization time and the average allocation scheme is shown in Table 5.
The results show that the proposed redundancy time allocation model of the stop station allocates more stop redundancy time to stations with relatively larger passenger traffic, so that the layout of the stop redundancy time is more suitable for the stoppage caused by passenger flow. Compared with the operation chart without redundant time, the total travel time optimization effect for passengers is 7.74%, and the waiting time optimization effect for passengers is also 6.583%.
Interval running time
Station expected stop time
Optimized stop station redundancy time layout scheme
Comparison of optimization effects
It can be seen from the results in Fig. 2. When different individual behaviors occur, their behavioral entropy values are at a high level, but the specific entropy values are different. On the one hand, there is a large difference between individuals, and there is no clear boundary between behaviors; on the other hand, the difference coefficient used in the calculation will also lead to different behavior entropy values. After a background check on the target, I learned that the target has some identity information. The target individuals T1, T2, and T3 are all office workers. T1 and T2 go to work from Monday to Saturday, and rest on Sunday. T3 only rests on Sunday, and other times are working hours. These targets choose to use the subway as a means of transportation during commuting hours, so the predicted values of behavioral entropy are at a higher level in the corresponding time. The target individual T4 is a student family who basically rides on the school bus during school hours. Therefore, the behavioral entropy of taking the subway between Monday and Friday is predicted to be at a low level, and on the weekends, the student union and parents often take the subway to go shopping. Different individuals have different behavior entropy prediction values, and their behavior entropy worthy differences can provide constructive reference factors for urban subway traffic operation management.
Figure 3 shows that the pedestrian travel speed is linearly negatively correlated with the pedestrian flow density. This is because as the density increases, the pedestrian demand space gradually decreases, and the pedestrian conflict gradually increases, thus causing the pedestrian flow speed to decrease. From the relationship between the pedestrian flow–density in Fig. 4, when the pedestrian flow density is less than a certain value, the pedestrian flow gradually increases as the density increases. When the density reaches a threshold, it will cause different degrees of congestion, which will cause the pedestrian traffic to no longer increase, but decrease. When the flow rate is low, the pedestrian has enough space for the demand, so there is no conflict. At this time, the walking speed is high, and as the interaction between the pedestrians is large, the pedestrian flow speed is lowered. The study of station congestion can improve the operation and management of subway traffic. When the peak passenger traffic in the morning and evening increases sharply and the order is chaotic, big data information can be used to realize the peak passenger flow forecast and the emergency evacuation of the emergency. This is of great significance for reducing pedestrian casualties, improving travel efficiency, and ensuring safe operation of stations.
In the result 3, based on the statistical data of the passenger data of each station, this paper summarizes the law of the random fluctuation of the passenger flow in the subway train running system and causes the fluctuation of the stop operation time, and constructs the optimization model of the stop time redundancy allocation. The case results show that, taking the actual urban subway line as an example, the optimized redundant time layout of the stop can effectively shorten the passenger’s travel time and waiting time. This is an important measure to optimize subway congestion and improve the efficiency of urban subway operations.
Conclusion
With the rapid increase in the mileage of subway operations in China’s large and medium-sized cities, the subway has become the preferred means of transportation for passengers. As an important part of urban public transportation, urban rail transit serves passengers. Therefore, by studying the complexity of passenger travel behavior and excavating the general law of travel behavior, it is not only the reference basis for the urban rail transit operation management department to give full play to its own advantages and improve the quality of transport services, but also an important theoretical basis for the relevant departments to formulate transportation planning and traffic management policies.
In the context of big data, this paper studies the travel behavior of subway passengers and calculates the behavior entropy of users to predict the passenger behavior of subway passengers. After analyzing the crowding degree problem of the station, the redundant train redundancy time model of the subway train was established. It is proved that the model proposed in this paper can effectively suppress the influence of passenger flow arrival uncertainty, ensure the higher quality of service to passengers, and further improve the urban subway traffic mode. It should be pointed out that the analysis of the volatility of the historical stop time of each station has certain assumptions. The next research direction can be considered to conduct deep-seed mining analysis with actual statistical data. In the calculation of user behavior entropy, combined with the analysis of various attributes of subway passengers, it will more accurately understand the characteristics of passenger travel behavior of different attributes.
Footnotes
Acknowledgements
This work was supported by the Natural Science Foundation of South-Central University for Nationalities (YZZ18013).
Conflict of interest
The authors have no conflict of interest to report.