
Abstract
Unlike conventional electrical networks, Microgrids are modern and flexible networks with specific parameters that can work in two modes, connected to general network and island mode. Distributed generations are one of the most important parts of Microgrids, so optimal placement of them requires special analysis because of the impact of placement in different electrical indexes, on the other hand on multi objective optimization a collection of answers will get that is called Pareto front and system operator couldn’t choose one of them. This paper presents a novel mixture of non-dominated sorting genetic algorithm and fuzzy method to minimize four objective functions such as cost, emission, power losses, and voltage deviation on a typical 34-bus test Microgrid to sizing six distributed generations and system operator can choose the best point between all of the points on Pareto front based on different conditions of operation of the system.
Introduction
In recent years using modern electrical networks is very important for scientists and modern countries, so a lot of researches have been done about Microgrids and smart grids by researchers; In addition using distributed generation resources impose a different set of operating factors on distribution network such as reverse power flow, voltage rise, decreasing fault level and reduction of power losses. Thus using new methods of optimizing is one of the most important parts of design of these networks. Optimizing different parts of a modern network makes a network more flexible and more reliable. In [1] the impact assessment of optimally placed different types of distributed generations with different load models (DMLs) by using genetic algorithm in distribution power systems from minimum total mega volt ampere (MVA) in take view point of main substation is presented. In [2] an application of non-dominated sorting genetic algorithm to the multi-objective optimal placement of distributed generation in distribution system with special requirements for power quality and power supply is presented. Ref [3] is proposed a novel Microgrid (MG) planning methodology to decide optimal locations, sizes and mix of dispatch able and intermittent distributed generators, also long-term costs in the proposed planning model include investment, operation and maintenance (O&M), fuel and emission costs of DGs while the revenue includes payment by MG loads and utility grid. Ref [4] a heuristic method based on “uniform voltage distribution based constructive reconfiguration algorithm” (UVDA) is proposed for the simultaneous reconfiguration and DG siting and sizing. In [5] by using non-dominated sorting genetic algorithm, multi-objective functions have been formulated with the consideration of minimum investment and operational cost of DG, minimum purchasing electricity cost from main grid and minimum voltage deviation. In [6] have developed a method for generating combination of several construction plans of distribution systems, considering the yearly increase of network loads, but they do not consider the installation of DGs, The optimal siting and sizing of DGs on the distribution system has been continuously studied in order to achieve different goals. In [7, 8] the optimization problem objective can be the minimization of the active losses of the feeder; or the minimization of the total network supply costs, which includes generators operation and losses compensation [9, 10]. In [11, 12] the objective function is optimization of voltage profile. All the mentioned objective functions are single objective and in this paper all of them are considered with together as the multi objective optimization algorithm. Various methods are used for solving the optimization problem. In [13, 14] genetic algorithm and in [15] dynamic ant colony search algorithms are used to cope with the optimization problem, In [16, 17] present power flow algorithms to find the optimal size of DG at each load bus in a network assuming that every load bus can have a DG source. Placement and penetration of distributed generation with the objective of generation cost minimization is proposed in [18]. It should be mentioned in most cases of multi objective optimization, classical methods are used for changing a single objective algorithm to multi objective, but mostly classical methods are slow, non-flexible and couldn’t find an individual answer between final answer groups [19–24]. In this paper with a new perspective for operating of a microgrid, four objective functions such as cost function, emission, power losses and voltage deviation have been optimized in a standard Microgrid network by using a new mixture of NGSA-II algorithm and Fuzzy method.
Microgrids
Microgrids are modern and flexible networks that are used in low voltage with some specific parameters such as distributed generators, storage devices and controllable loads that can operate either interconnected or isolated from the main distribution grid as a controlled entity. Central controller and location controller are two main parts of Microgrid control especially in island mode. In addition Microgrids can provide both kinds of energy such as electrical energy and heat in their area. Because of using distributed generation resources and storage devices and control loads with smart controllers, some features like reliability, power quality, and efficiency are increased [25, 26]. A schematic figure of Microgrid is shown in Fig. 1.
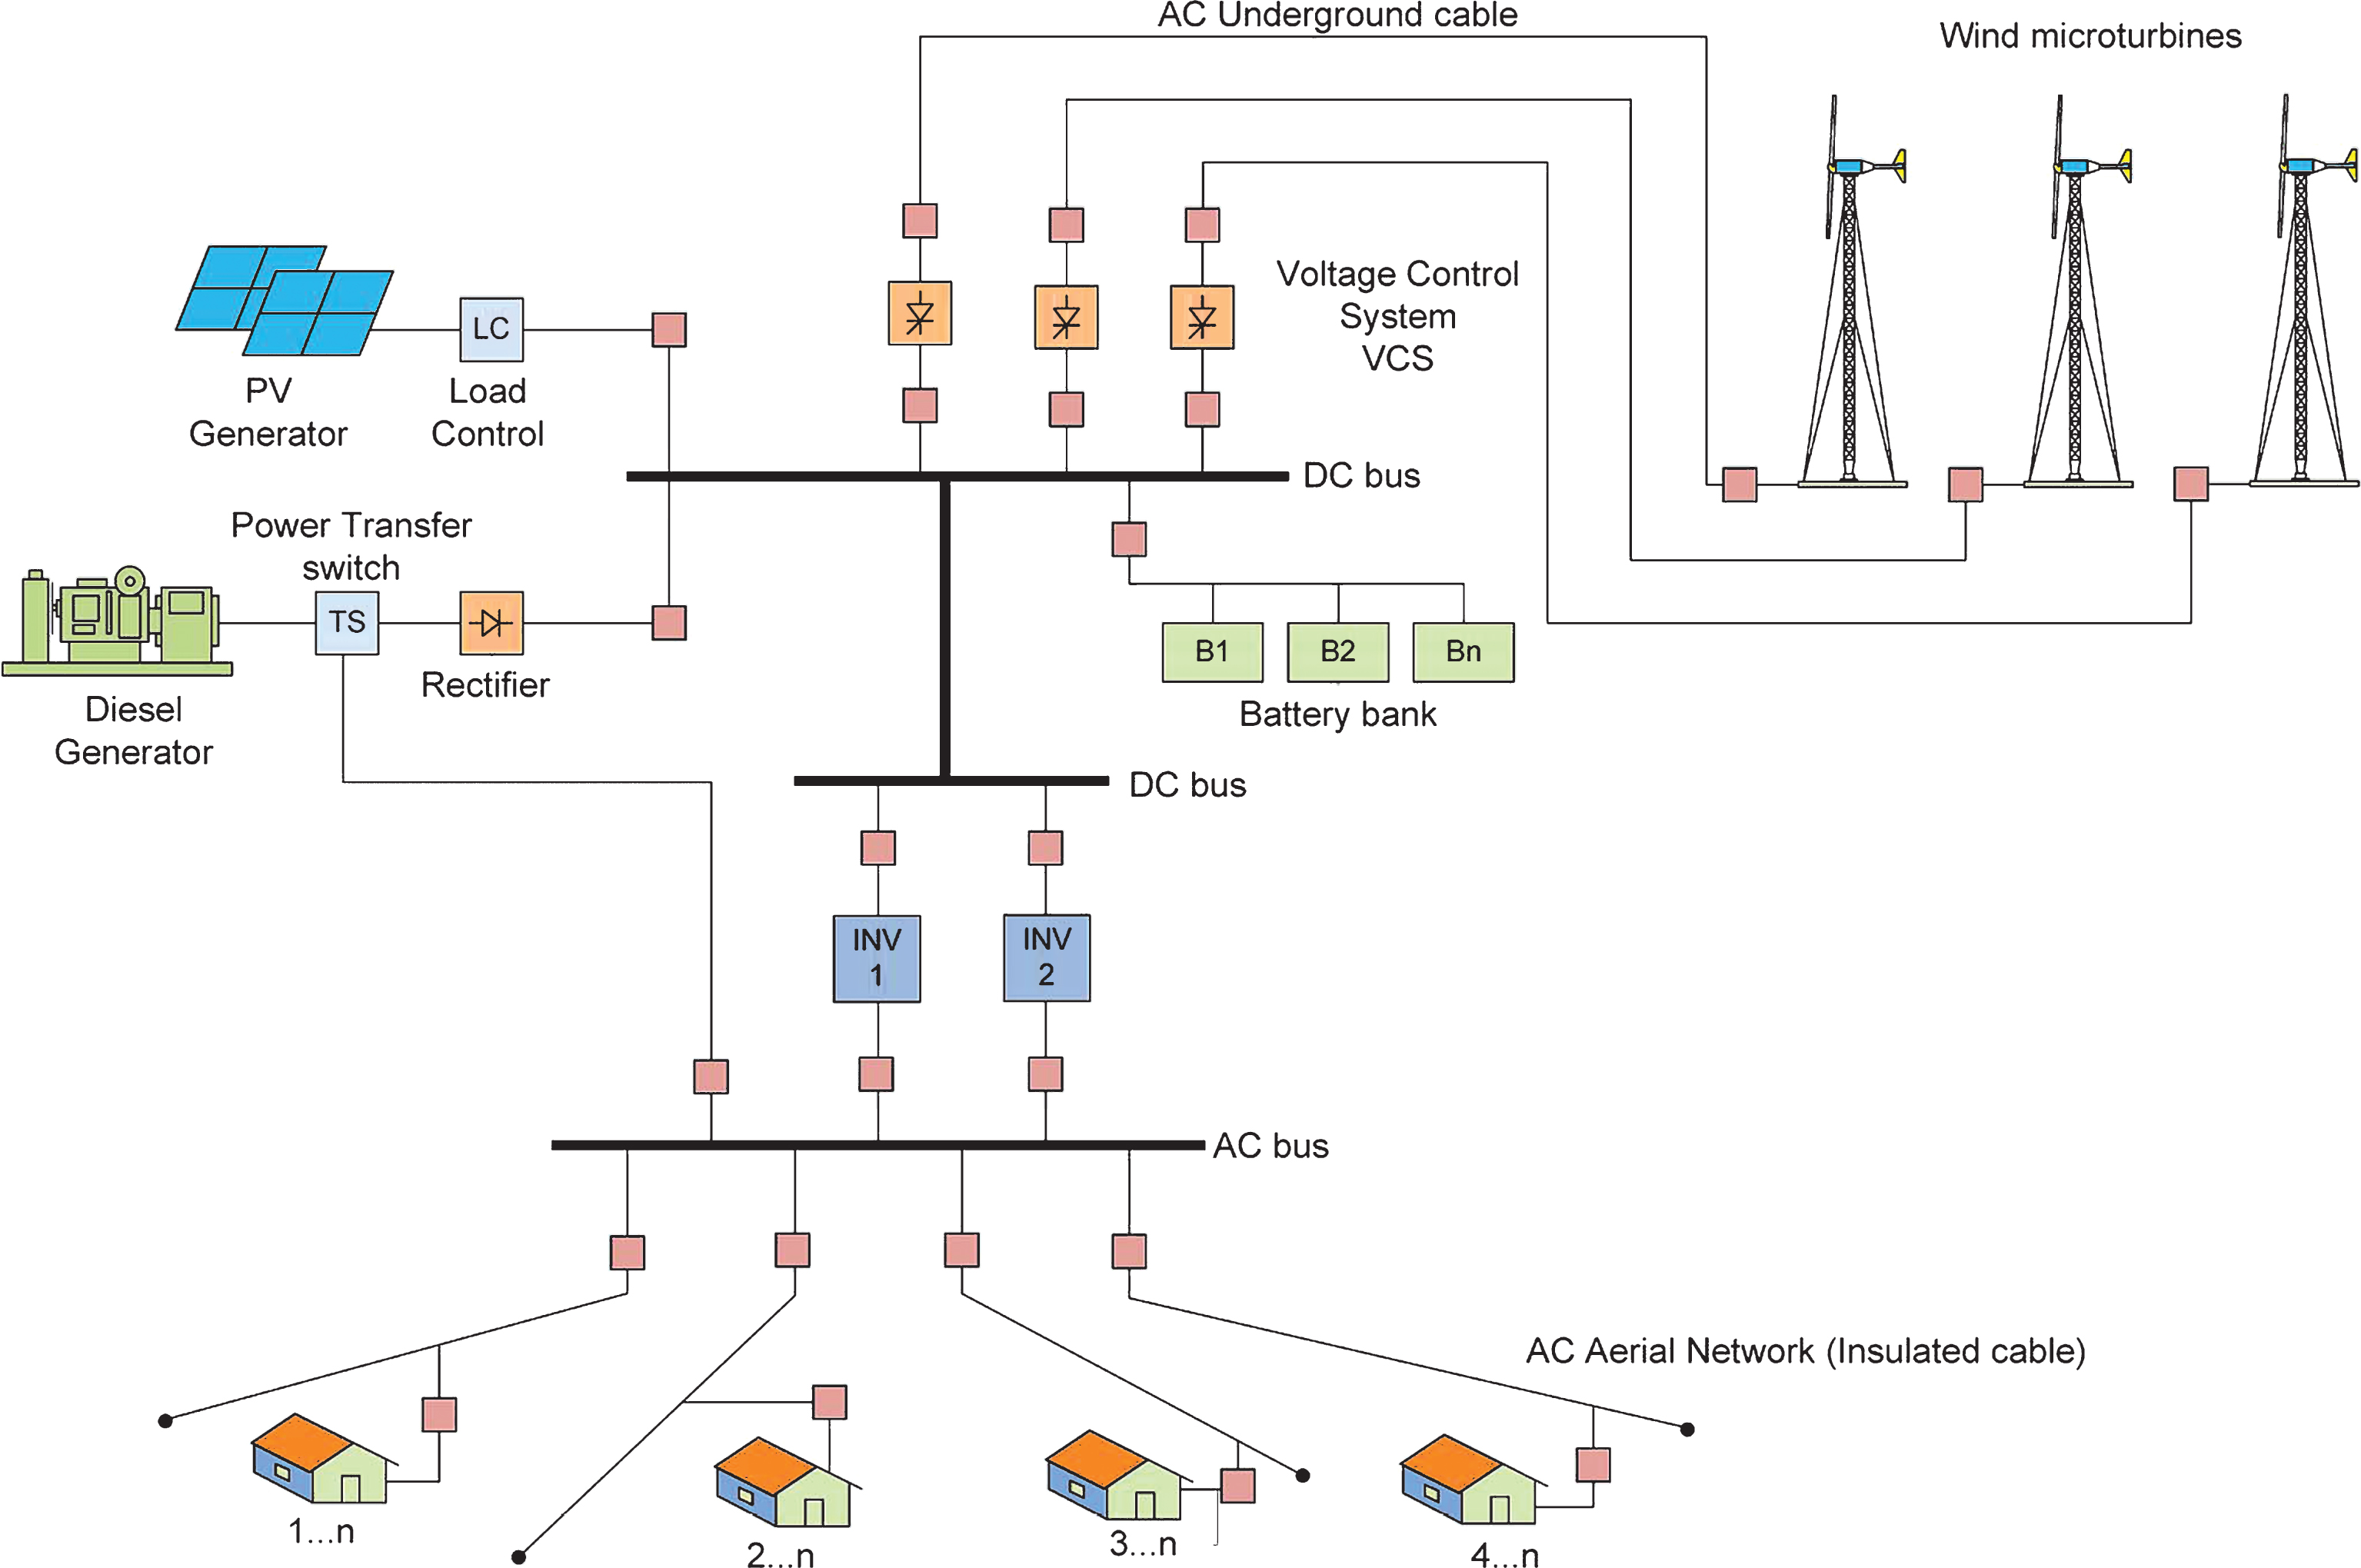
A schematic figure of Microgrid.
Unlike single objective optimization that has a specific answer when optimization process is finished, in multi objective optimization a group of answers are known as a final answer that are called Pareto set or Pareto-optimal front. For optimizing complex mathematical functions, use of optimization techniques is usual but the main structure of the most of them are based on single objective optimization and that’s why when most of them are changed into multi objective algorithm doesn’t have proper outcomes. Thus NSGA-II algorithm has been created based on multi objective optimization, so this algorithm has better exploration and exploitation.
NSGA-II algorithm is the second version of non-dominated sorting genetic algorithm that use crowding distance instead of fitness sharing that had been used in the initial version [27, 28]. The basic concept of multi objective optimization (for example for two objective functions) could be shown as follow:
As mentioned the output of multi objective optimization is a group of possible answers that is called Pareto set, but in operation of power systems choosing one of them is very important especially for system operator, so by using fuzzy method and mix it by NSGA-II algorithm, system operator could find the best answer by determination the importance of each of the objective functions.
To approach this goal membership function must be established as follow:
In fuzzy membership function, continues value between 0 and 1 for lower and upper boundaries is calculated. But before that for calculating
After formation of pay-off table, the best and the worst answer of each objective function is known as a utopia point (f
U
) and nadir point (f
N
) as follows:
So to minimize objective functions:
Where Ω shows feasible region of cost functions to minimize them, but for solving this kind of functions and to have better answers pseudo nadir point (f
SN
) is used as follow:
Utopia point, nadir point, and pseudo nadir point are shown in Fig. 3 for two objective functions.
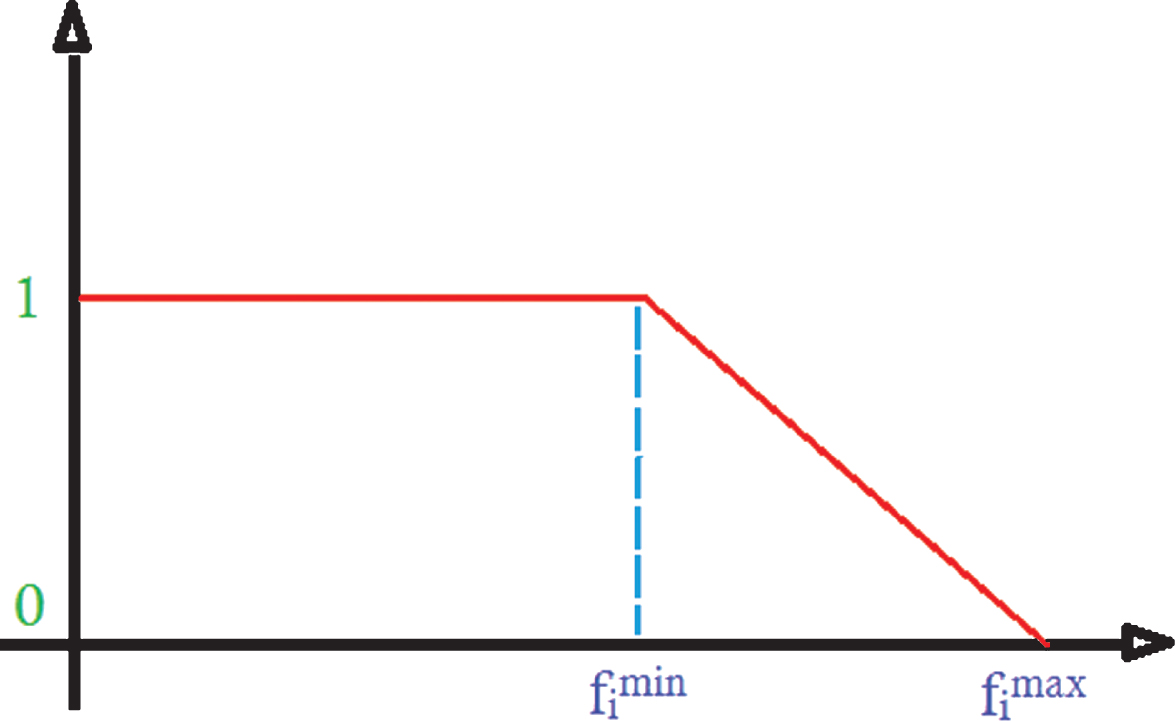
A membership functions for objective function.
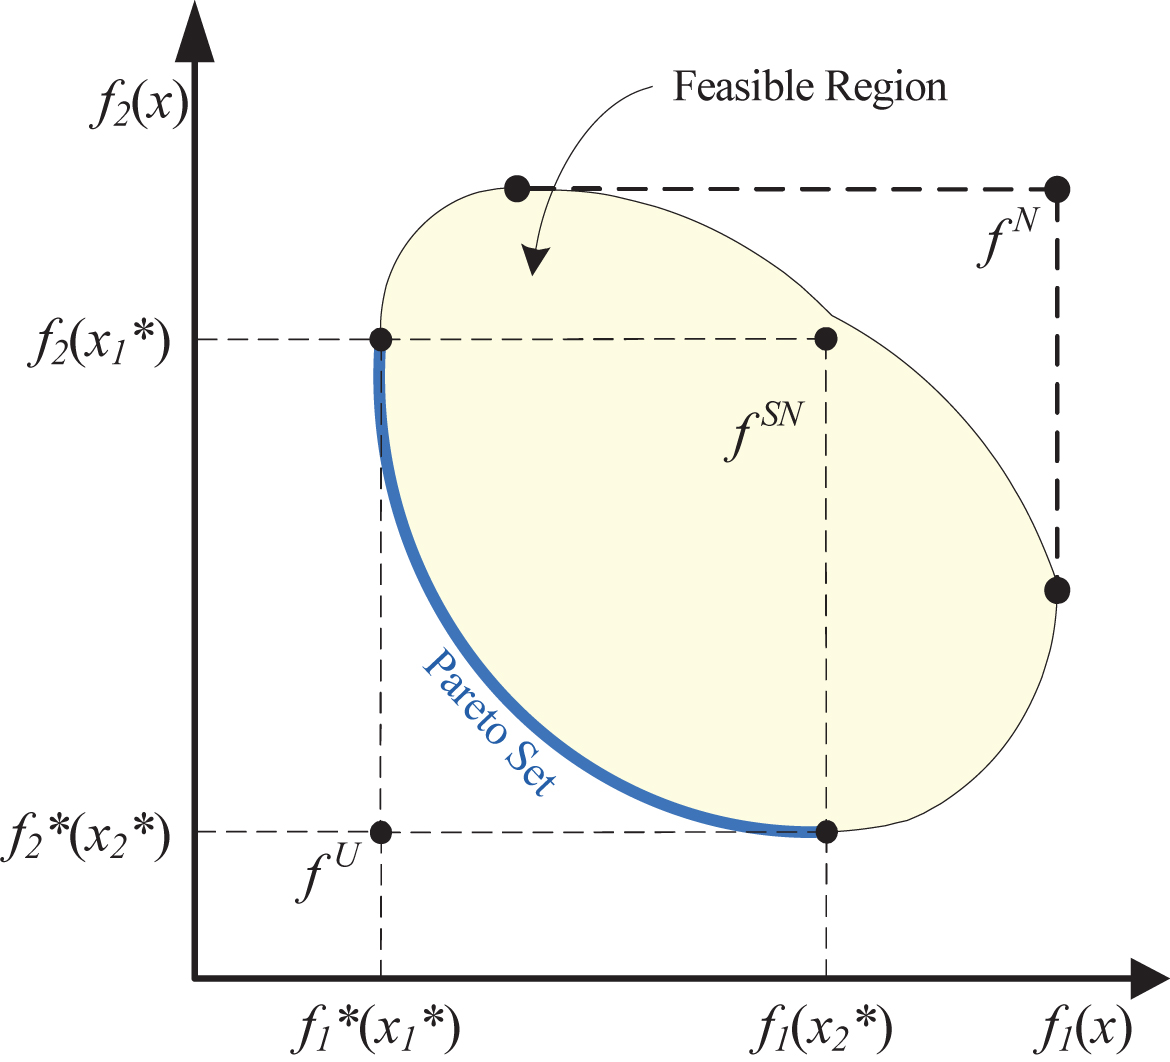
Utopia point, nadir point, and pseudo nadir point.
Finally, when utopia points and pseudo nadir points have been calculated, total membership function is calculated as follow:
Where w n is weight coefficient of nth objective function and M is the total number of answers on Pareto set. Thus system operator could choose the best mode in different circumstances for power system by changing w n . For example if in some circumstances security is the most important item for operator, weight coefficient of it could be increased in comparison with other items.
According to structure of non-dominated sorting genetic algorithm and fuzzy method, combination steps of them presented as follow: Setting initial parameters (Include network data, data of constant and initial coefficient of algorithm, and data of fuzzy section, cost functions, constraints and the other parameters). Generate initial population. Extract non-dominated solutions from initial population. Run cross over function for present population. Run mutation function for present population. Merging current population and the population of cross over and the population of mutation. Calculating non-dominated sorting solution. Calculating crowding distance solution. Sorting population. Truncate of sorted population based on size of population. Calculating non-dominated sorting, crowding distance and sorting function for population of Step 10. Checking stop criteria (If it is ok go to the next step, Else go to step 4). Calculating single objective optimization and making pay-off table based on cost functions to extract utopia point and pseudo nadir point. Specify weight coefficient (w
i
). Calculating membership function. Calculating total membership function. Specifies the best point between all of points in Pareto front based on w
i
.
Problem formulation
For optimizing placement of DGs in a standard microgrid four objective functions are considered, such as cost function, emission, voltage deviation, and power losses [30].
Cost function
Where LF is load factor, Gr is the annual interest rate, and the O & M cost shows operation and maintaining cost. Consequently model of cost function to minimize is:
Where P sub is substations power rating, Q sub shows the cost of substation installation.
Bus voltage is one of the most important indication in security and power equality, which can be described as follows:
Where N bus shows the number of buses, V i is the real voltage of the ith bus, and V r is the nominal voltage.
For minimizing real power losses the follows formulation is presented:
Where R i is resistance, I i is actual current of the ith branch, and N br is the number of the branches.
E
t
shows the total emission and its calculated as follows:
Where a i , b i , c i , d i , and e i are coefficients of emission characteristics and P i is the electrical output of ith generator, and m is the number of generators (in this paper a i = 4.285 kg/hMW2, b i =5.094 kg/hMW, c i = 4.586 kg/h, d i = 1.0* 106 Kg/h, and e i = 8.00 MW–1).
Voltage limits
The standard range of bus voltage is:
Where Vmin and Vmax are minimum and maximum of permissible voltage respectively and V k is calculated voltage at bus k.
In order to keep stability of network total generations should be equal to total loads as follows:
At first, to display convergence of algorithm a single objective optimization has been done for 100 iterations that is shown in Figs. 4 to 7. It should also be noted the test microgrid network is a standard 34 buses [31].

Convergence of cost.
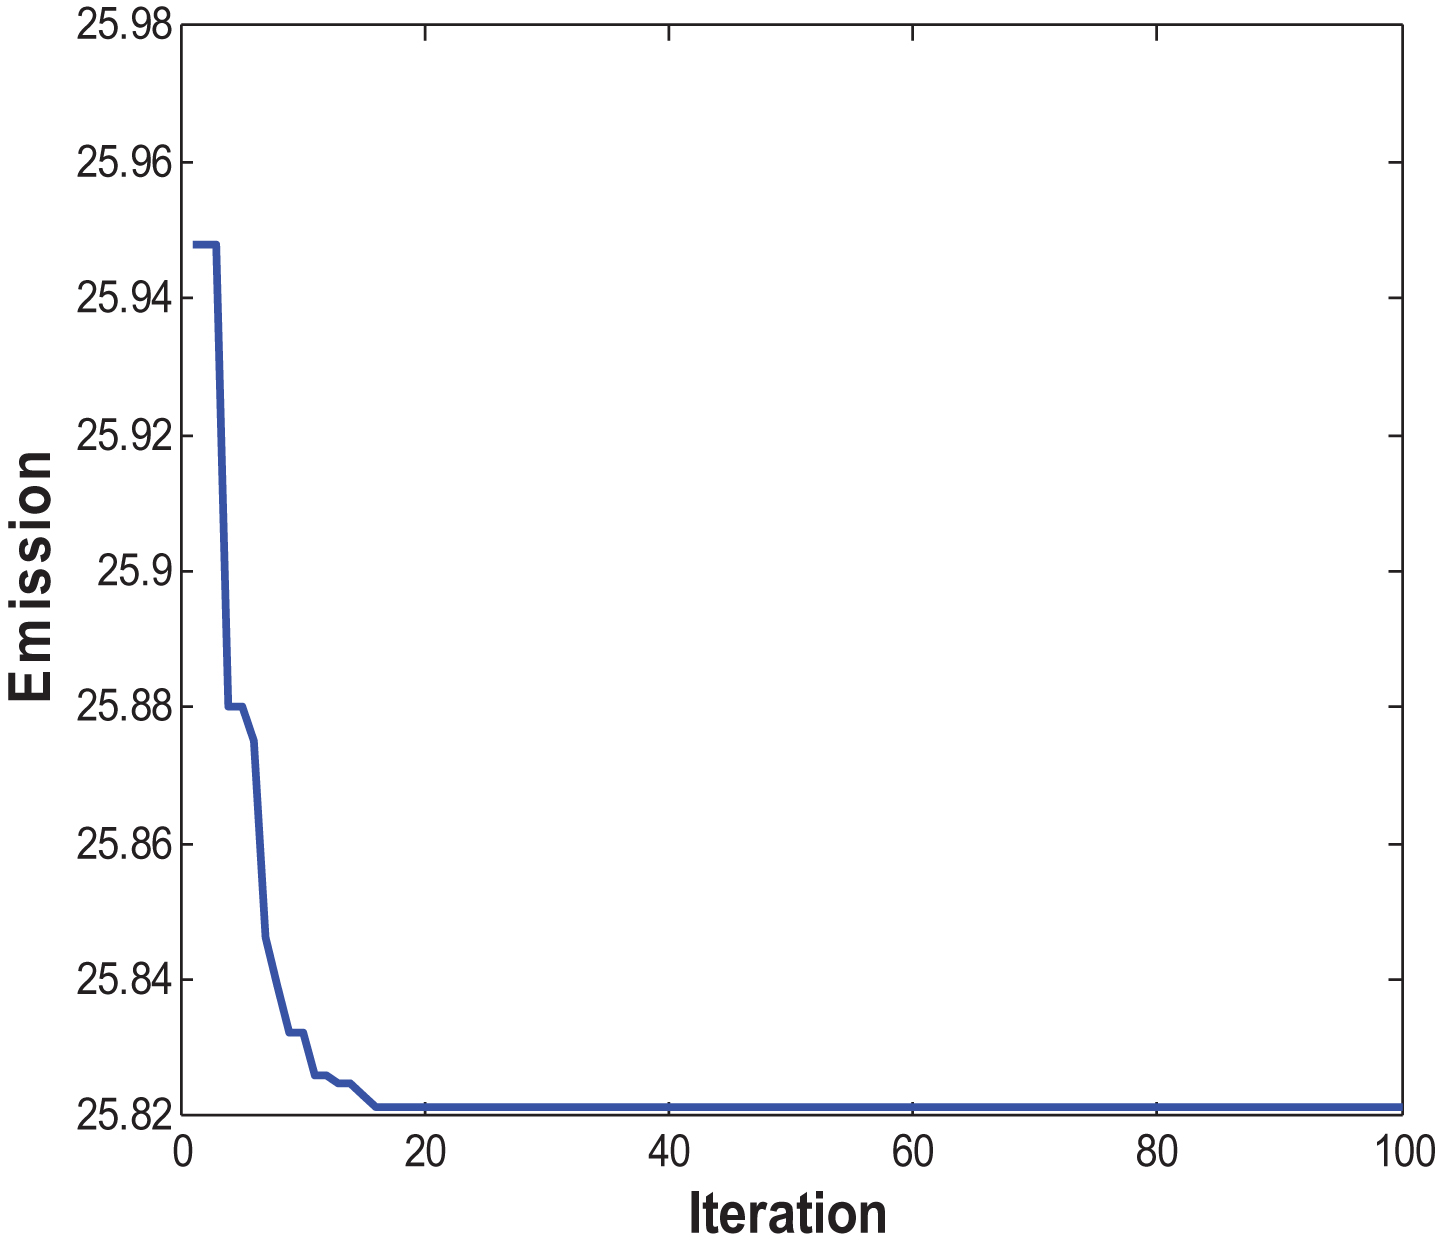
Convergence of Emission.

Convergence of Voltage deviation.
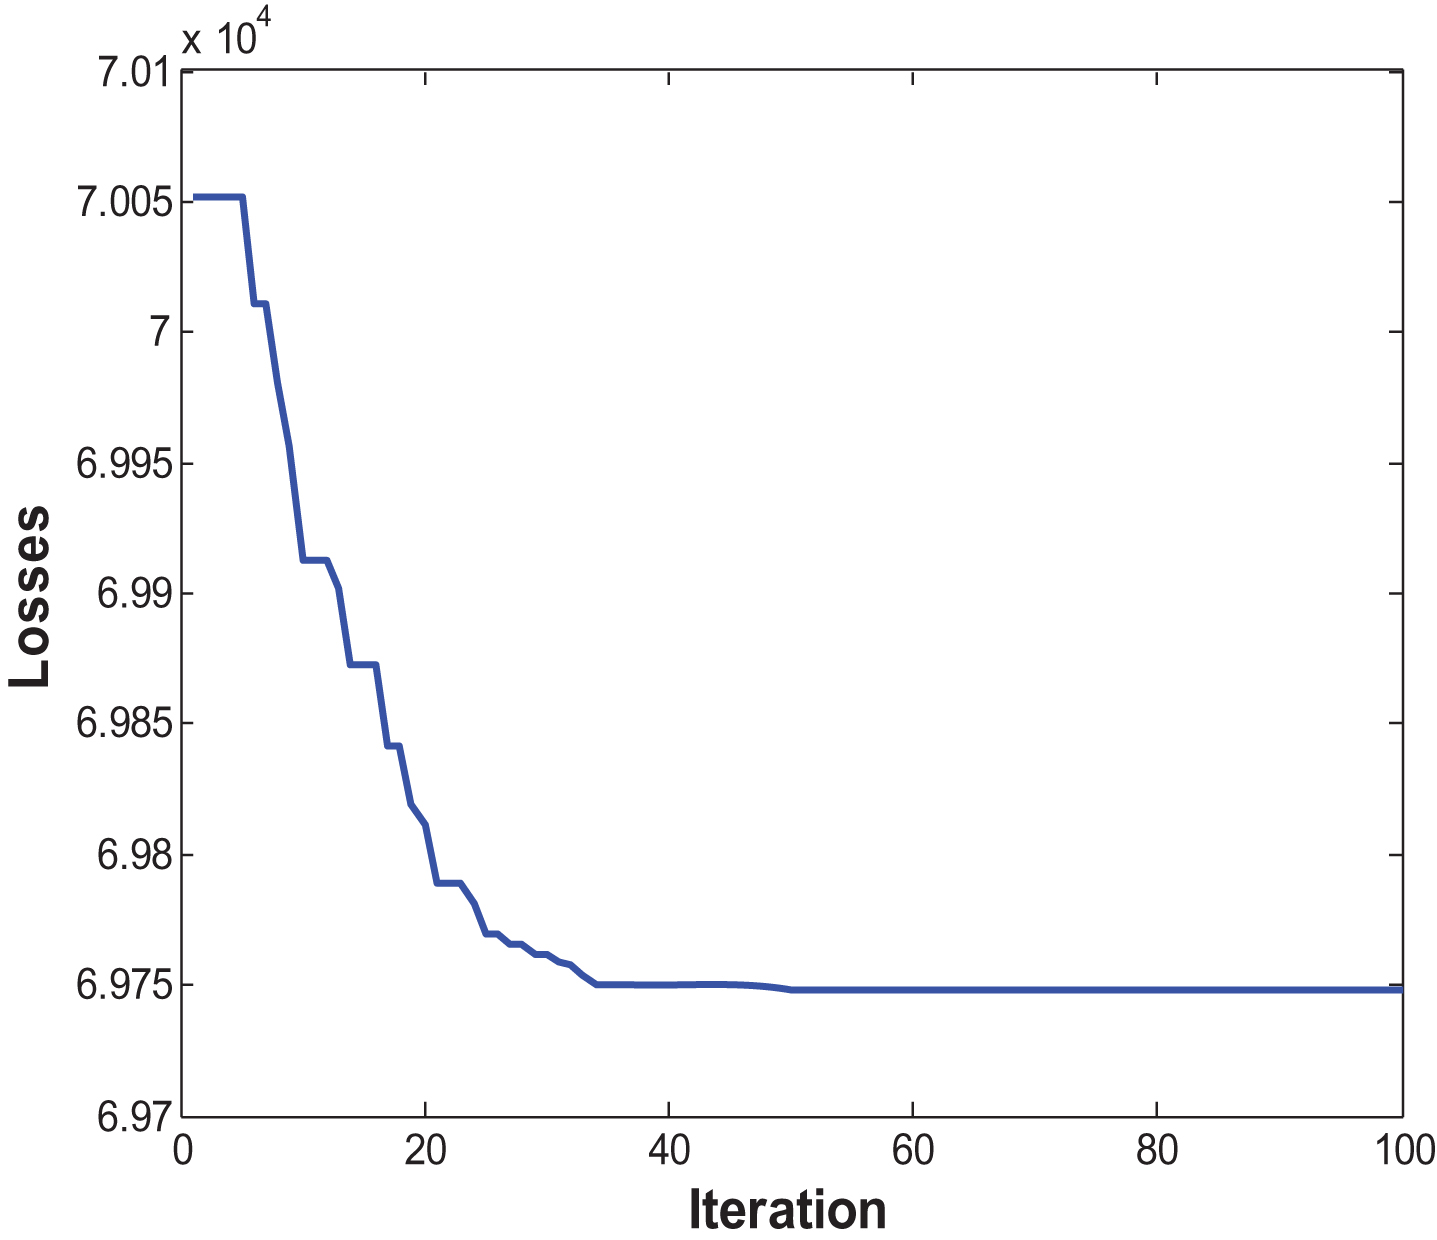
Convergence of power losses.
To comparison between proposed method and similar algorithms Tables 1 to 4 are provided.
Results of optimizing cost function
Results of optimizing emission
Results of optimizing power losses
Results of optimizing voltage deviation
Since there are four objective functions to optimize, thus it is impossible to plot them, but plots of two dimensions proposed method for some of objective functions are shown in Figs. 8 to 11 for illustrating.

Cost and emission optimization.
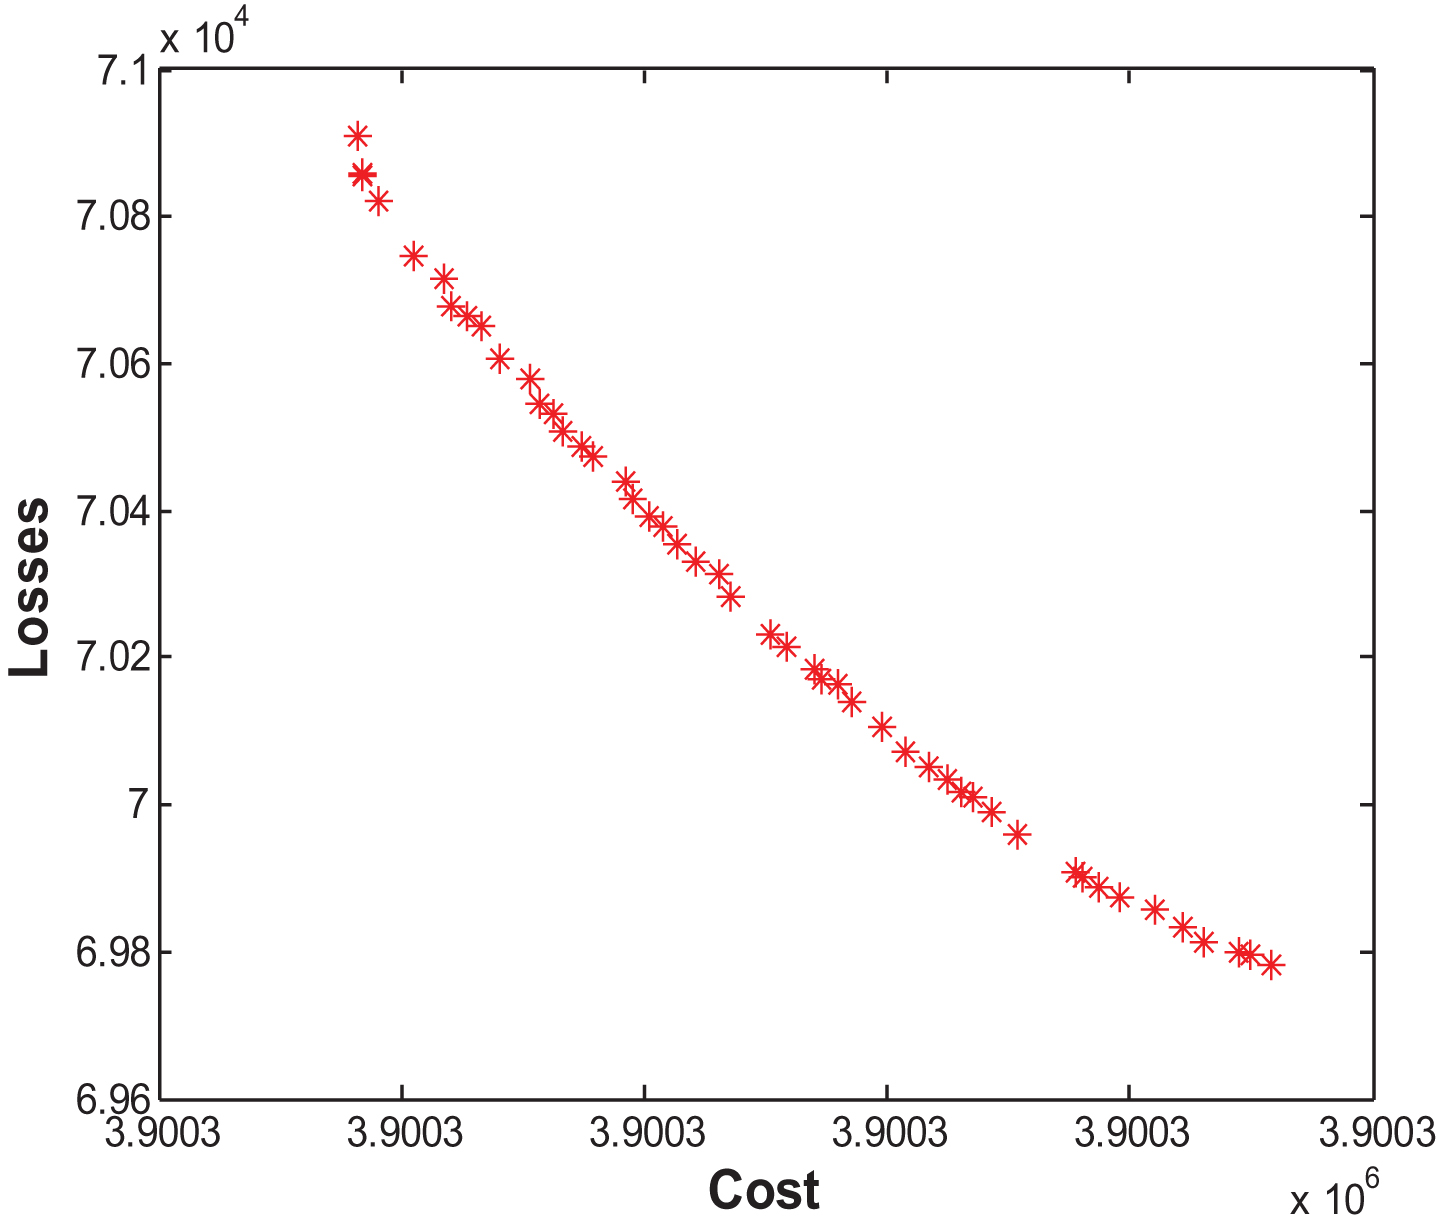
Cost and power losses optimization.
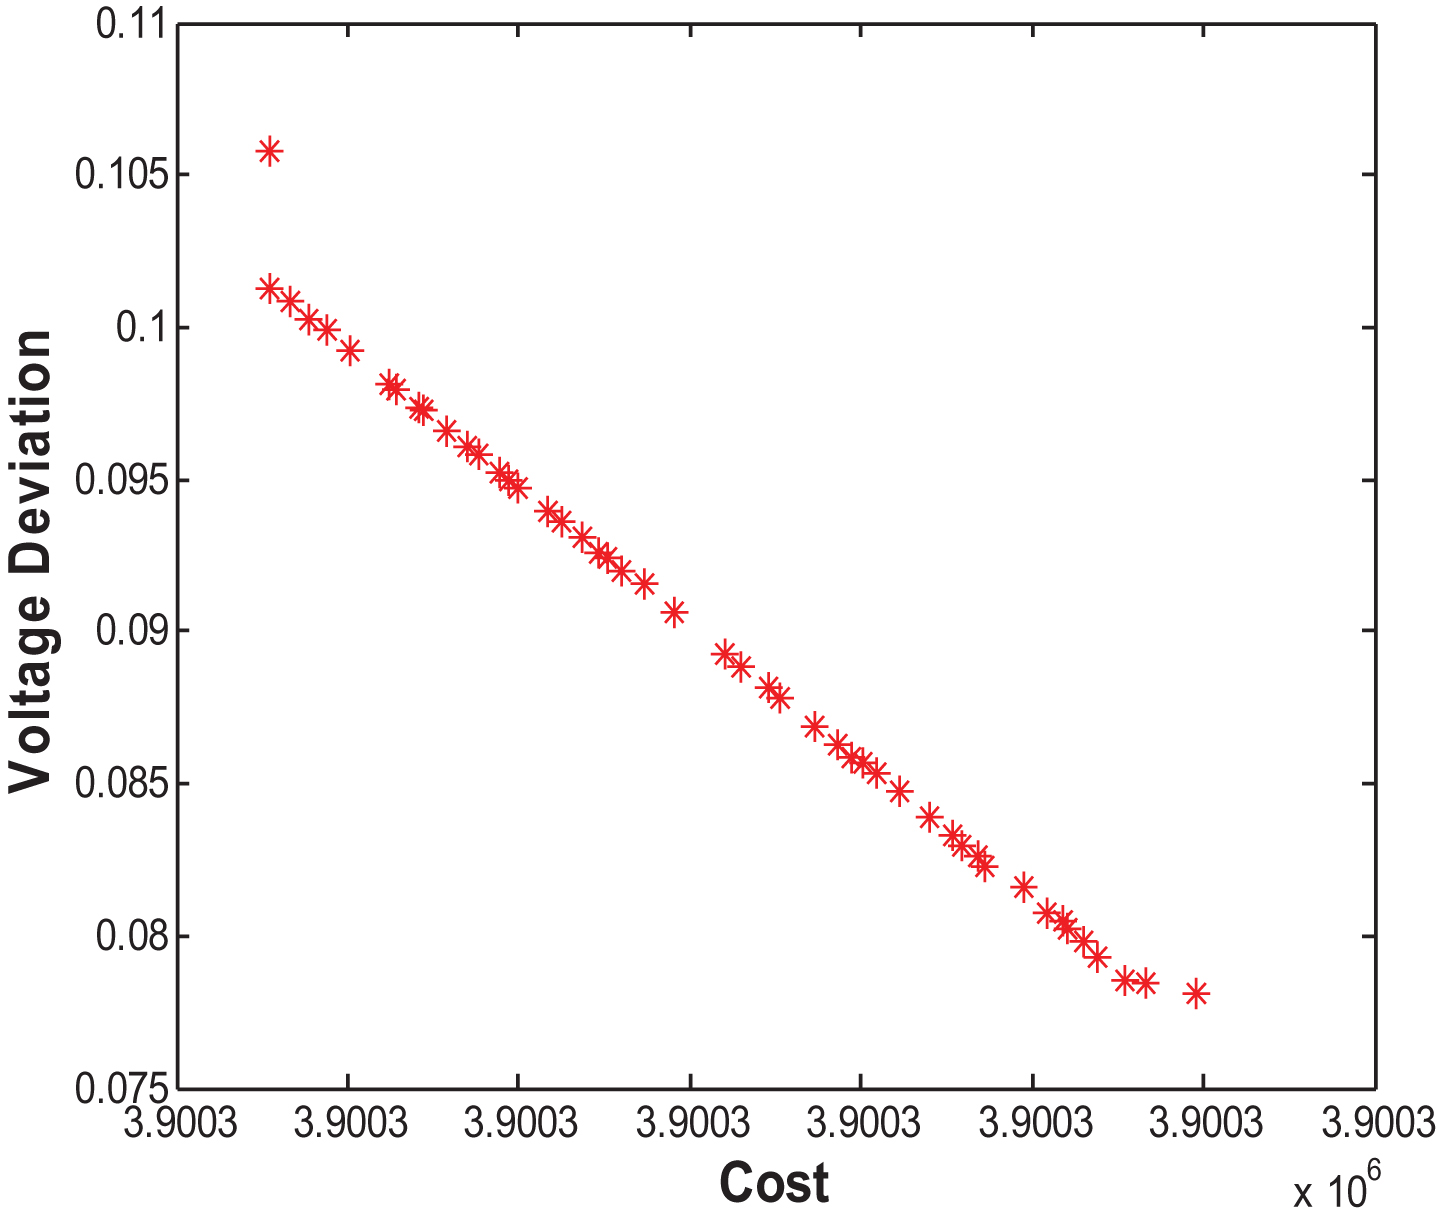
Cost and voltage deviation optimization.
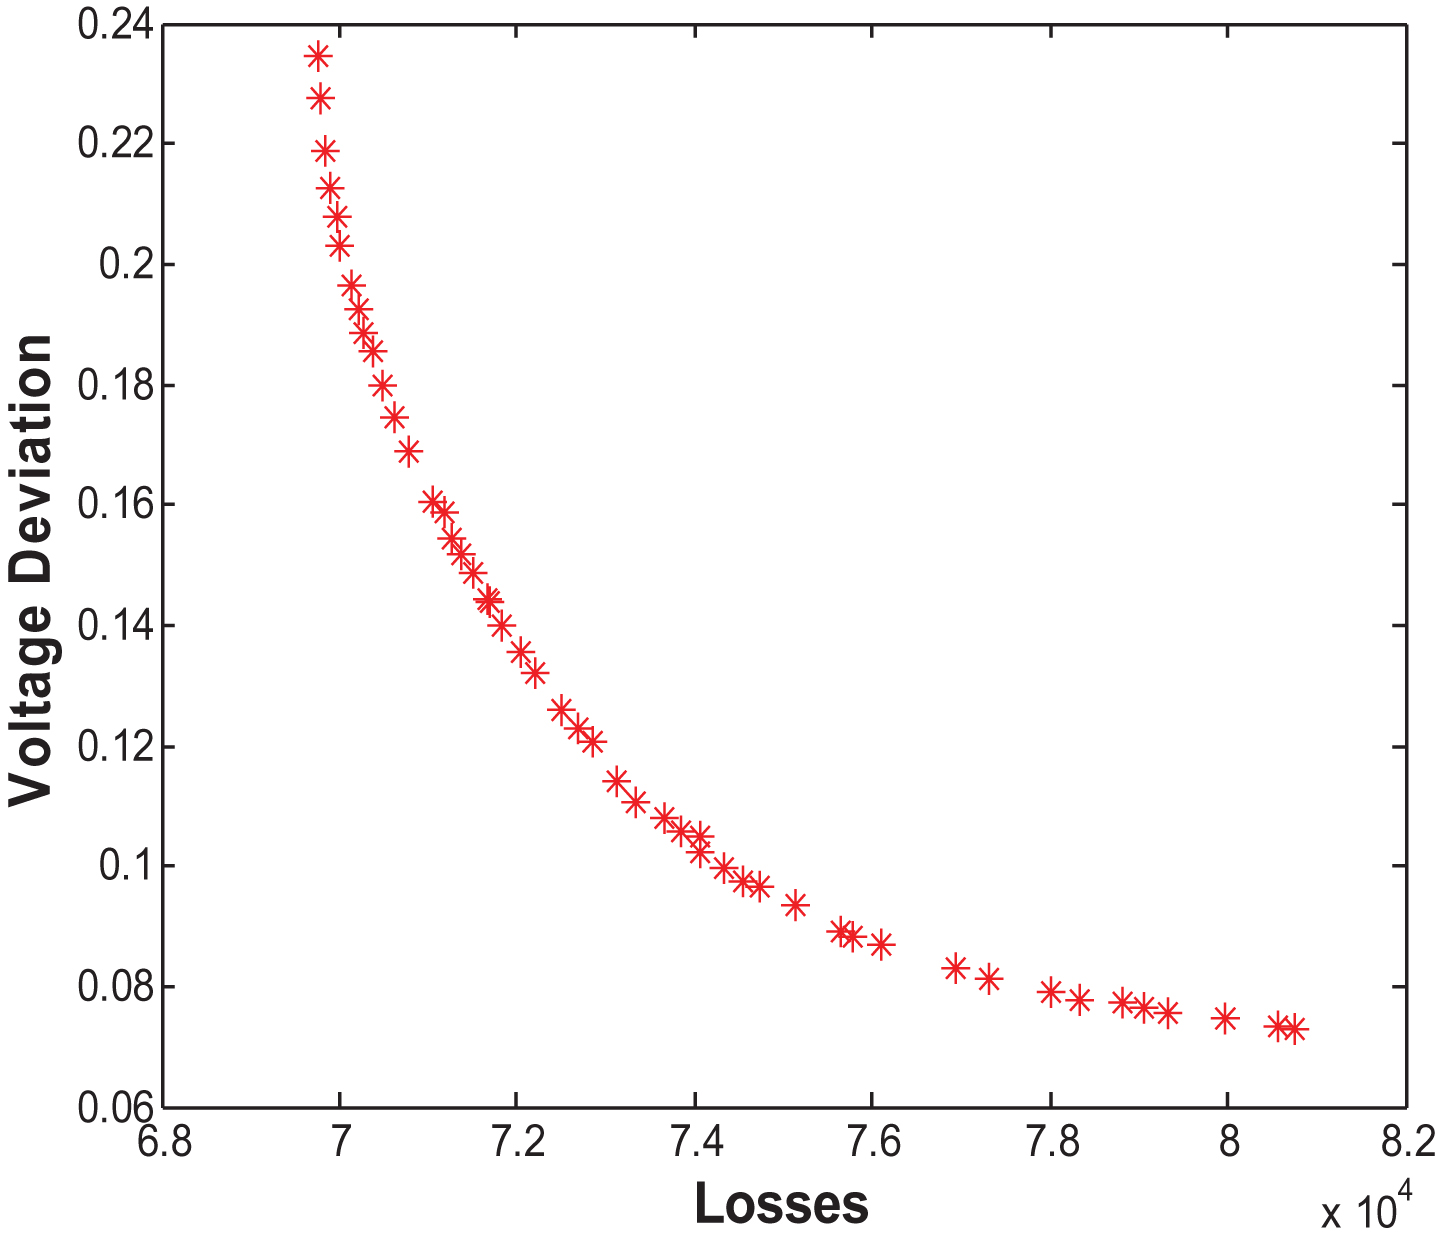
Power losses and voltage deviation optimization.
To implement of proposed method a radial standard network with 34 busses has been used as a Microgrid to placement of 6 DGs such as 2 CHPs, 2 Wind Turbines, and 2 Fuel Cells to optimize four objective functions such as cost, emission, power losses and voltage deviation. For optimizing objective functions a pre-allocation have been used and generators have been installed on 2,13,14,17, and 34. After that by using proposed algorithm, the best size of each DGs is calculated.
The number of iterations is 100, the number of population is 50, and the number of DGs is 6.
Finally, optimization has been done for four objective functions and the answers are shown in Table 5. In this table different cases have been evaluated as follow: Cases I–IV are shown results of single objective optimization. Case V: Considering functions f1, f2 and f3. Case VI: Considering functions f1, f3 and f4. Case VII: Considering functions f2, f3 and f4. Case VIII: Considering functions f1, f2 and f4. Case IX: Considering functions f1, f2, f3 and f4.
Objective function values in different cases
The operator of the system could choose the best point between all of the answers in Pareto front by changing w i based on different conditions like system security, environmental conditions,etc.
According to the importance of placement of distributed generations on Microgrids that are flexible and modern networks, finding the best point between all of the points of Pareto front is very important for system operator in different conditions of the system, thus by using fuzzy method the system operator can determine the importance of each of the objective functions in different conditions. So in this paper results of proposed method and test it on a 34-buses Microgrid show the superiority of the method in the viewpoint of the accuracy.