
Abstract
To evaluate auto-mobility systems and find out which one can provide better environmental, social, economic benefits and better system performance, we improve a rough set approach proposed by [1] with the combination of Rough Analytic Hierarchy Process (R-AHP) and Rough Technique for Order Preference by Similarity to Ideal Solution (R-TOPSIS). There are three steps in the improved approach. In the first step, proper indicators are identified by means of literature review and expert interviews, and they are divided into two categories, benefit and cost. In the second step, weight for each indicator is determined by R-AHP. In the third step, different alternatives are compared and ranked by R-TOPSIS. A case study is provided to show the detailed procedure of the improved approach by comparing car-sharing, ride-sharing and car-owning. And sensitivity analysis experiments are conducted to figure out the effect of indicators on decision making process. We arrive at the conclusion that ride-sharing is the best auto-mobility option in most cases and indicators play a significant role in the evaluation of auto-mobility options.
Keywords
Introduction
Most urban areas are suffering from terrible air pollution and congestion because of the ever-increasing traffic on road. Governments and administrative branches are trying their best to change this kind of condition by various kinds of means. For example, Beijing, capital of China, restricts new purchase of private vehicles and charges more for parking lots and invests more money in public transportation construction such as subway, which turns to be the most crowded yet efficient means of transportation especially during rush hours. Public transportation definitely has its advantage over private cars in terms of energy efficiency and transporting capacity. However, people still need private transportation due to its flexibility and convenience.
With the growing purchasing power of general public, owning a private car is no longer a dream to the majority of Chinese citizens. Registered motor vehicles in China have reached 290 million by the end of 2016, among which 194 million are private cars [2]. However, most of the private cars are not used efficiently. McKinsey Center for Business and Environment [3] reports that a typical European car is parked during 92% of its lifetime, 1% sitting in congestion, 1.6% looking for parking, 5% driving. Moreover, a typical private car has 5 seats but carries 1.5 people per trip on average. This results in serious congestion and great waste of energy.
Car-sharing systems (CSS) advocate the idea of sharing cars with others, which provide a flexible alternative that meets diverse transportation needs across the globe and reduces the negative impacts of private vehicle ownership [4]. A car-sharing system has a relatively small fleet of vehicles available for a relatively larger group of members [5]. Car-Sharing systems, are a complementary to private vehicle ownership. As application of product service system in the field of urban mobility [6] and an alternative to public transportation, car-sharing has a positive impact on urban mobility, mainly because each vehicle is used more efficiently. Car-sharing systems have the potential to replace many private vehicles and can have further significant benefits if electric vehicles are used [7]. Ride-sharing is a system which matches up drivers and riders on very short notice or even en-route” [8], combining flexibility and speed of private cars with reduced travel cost and loss of convenience to some extent [9]. Yet it is a challenging task to match drivers and riders in a short period of time. Besides, passengers may not want to share a ride with strangers for safety or privacy reasons. Car-owning is the most conventional way of private transportation and it is the first choice of many people due to its convenience and mobility. However, many low-income families cannot afford a private car [10].
The purpose of this study is to compare three auto-mobility options, i.e., car-sharing, ride-sharing, and car-owning and find out which can provide better performances. It is no easy job due to lack of prior information and the subjectivity and vagueness existing in the evaluation process. Therefore, we improve the rough set approach proposed by [1] and apply it to evaluate auto-mobility systems (AMS) under uncertain environments.
The remainder of this paper is organized in the following way. Section 2 introduces related works as to car-sharing, ride-sharing, and application of rough set theory in decision-making. Section 3 is about fundamental notions of rough set theory. Section 4 describes the application of R-AHP in weights determination and R-TOPSIS in ranking different alternatives. Then, a framework to evaluate auto-mobility systems is proposed and analyzed in Section 5. A case study is provided in Section 6 to show the detailed procedure of the proposed framework. We conclude the paper and discuss the significance of the improved approach in the last section.
Related works
Car-sharing system
Car-sharing involves a small fleet of vehicles available at several stations to be used by a relatively large group of members [11]. It can be classified into two categories: “one-way” and “two-way”, according to different vehicle returning rules. Two-way system requires that users should return the rented vehicle at the location where they picked it up and one-way system is more flexible without restrictions as to the returning station [12]. Baptista et al. [13] conducted an in-depth analysis of a car-sharing system in Lisbon to quantify its energy and environmental impacts and comprehend the influencing factors as to its economic feasibility, which confirms that car sharing contributes to a more efficient and sustainable mobility and reduction of energy and environmental impacts.
Jorge et al. [14] developed an integer programming model to design one-way trips to supplement a car-sharing company presently operating round trips. There is a great potential to integrate round-trip and one-way car-sharing services. However, they did not consider flexibility of demand to price. And they did not take into account the problems of expanding the capacity of existing stations to deal with one-way car-sharing service and increasing the vehicle fleet as well. Fassi et al. [15] proposed a decision support approach to assist decision makers to assess different growth strategies of CSS. The proposed approach is able to maximize customer satisfaction level and minimize the number of vehicles as well.
Nair and Miller-Hooks [16] developed an equilibrium network to configure a flexible vehicle sharing program (VSP) in which users are able to check out vehicles and return them to nearby stations. Future works may focus on congestion effects on transit networks, joint optimization of prices and design, price sensitivity of users in route choice, and multiclass extensions. Wagner et al. [17] developed an innovative Business Analytics approach to support car-sharing decision making process and estimate spatially varying demand for car-sharing services, on the basis of two hypotheses.
Ride-sharing system
Ride-sharing is defined as “a system where an automated process employed by a ride-share provider matches up drivers and riders on very short notice [18]. Furuhata et al. [9] focused on the key aspects of present ride-sharing systems to develop a framework to identify key challenges in the adoption of ride-sharing. Agatz et al. [18] proposed optimization-based approaches to minimize the total system-wide vehicle distances and travel costs. They applied rolling horizon strategy to deal with uncertainty and construct computer simulations.
Agatz et al. [8] identified the objectives of a ride-sharing system: to minimize system-wide vehicle-miles, minimize the system-wide travel time, and maximize the number of participants. They listed dynamic ride-sharing problems as arrival of riders and drivers, anticipation of future requests, and deviation from planned trips. Savelsbergh [19] studied the role of dedicated drivers in a dynamic ride-sharing system and benefits, complexities, and costs of ride-sharing. The authors identified the following three factors as most influential: the number of participants in ride-sharing process; the time flexibility of participants; and the similarity between origins and destinations of the participants. And they conducted a computational study to show the benefits of dedicated drivers and identify the circumstances under which dedicated drivers are most helpful.
Application of rough set theory
Rough set theory was proposed by Pawlak [20] to deal with imprecision, vagueness and uncertainty. Different from fuzzy sets, evidence theory, and probability theory, the axiom system in rough set is definitely objective, eliminating any prior information that is not related with the data to be handled [21]. Pawlak [22] outlined basic concepts of rough set theory including indiscernibility relation, approximations, rough membership, dependency of attributes, and reduction of attributes. He proposed decision tables and decision algorithms and discussed its possible application in decision support process. Li et al. [23] integrated rough set, Kano’s model and AHP to rate the final importance of customer requirements in product planning house of quality. Aydogan [24] developed a conceptual performance evaluation framework with consideration of quantitative and qualitative factors by applying rough-AHP and fuzzy-TOPSIS.
Wenyan Song and his team from Shanghai Jiaotong University made a great contribution as to the application of rough set theory in evaluation process. Song et al. [25] proposed a rough set approach to assess customer requirements of industrial product service system with uncertainties and vagueness. Yet it is time-consuming for decision makers to adjust their judgments in order to pass the consistency test. Song et al. [26] proposed an innovative decision approach to choose the best new product options at concept design stage involving subjectivity and uncertainty. They integrated rough AHP and rough TOPSIS to improve the quality and efficiency of concept evaluation for new products development. However, they did not consider the interdependencies among all criteria. Song et al. [26] proposed an innovative approach to improve the effectiveness of failure mode and effect analysis using rough TOPSIS, demonstrating the power of rough set theory and TOPSIS to deal with vagueness. However, the proposed method also asks for additional knowledge in rough set theory, which is somewhat difficult for experts.
To sum up, we identify a research gap as to the willingness of adopting car-sharing or ride-sharing and giving up car-owning by means of a comprehensive comparison of auto-mobility systems. Besides, we simplify the computation process of relevant equations and improve the efficiency of the method proposed by [1] with application of MATLAB and extend the application of rough set theory in auto-mobility systems.
Fundamental notions of rough set theory
Rough boundary interval and rough number
Rough set theory is proved to be efficient in dealing with inconsistency problems [27]. Rough boundary interval and rough number are two important notions proposed on the basis of rough set theory, which are used to handle the subjectivity and vagueness in the decision making process [28].
Here,
The boundary region of C i is defined as
Bnd (C i ) stands for the boundary region of C i . The above definition describes the ordered classes using upper and lower approximations. In other words, for any class C i in a set of ordered classes R, the lower approximation of C i refers to all the objects whose class values equal to or less than C i ; similarly, the upper approximation of C i refers to all the objects whose class values equal to or bigger than C i ; moreover, the boundary region of C i contains all the objects whose class values are different from C i . On the basis of the above definition, rough number, its lower and upper limits and rough boundary interval can be defined as well.
Here, M
L
stands for the number of objects contained in the lower approximation of C
i
, and
Here, M U stands for the number of objects contained in the upper approximation of C i .
Therefore, the rough boundary interval refers to the interval between the lower limit
Definition 2 makes it possible to express a rough number with its lower limit and upper limit as follows:
The rough boundary interval of a class means the difference between its upper and lower limits, representing its vagueness. A class with a bigger rough boundary interval is vaguer. Compared with fuzzy numbers, rough numbers have flexible boundary intervals, representing the subjective and vague cognition of decision makers while maintaining the objectivity of original data at the same time [29].
Suppose RN
x
= [L
x
, U
x
], RN
y
= [L
y
, U
y
] are two rough numbers, where L
x
, L
y
are their lower limits while U
x
, U
y
are upper limits. Then,
R-AHP
Here
RI stands for random index and can be obtained from Table 1 [30].
Random index RI (n)
When CR ≤ 0.1, the matrix is ok with satisfying consistency. Otherwise, it should be revised.
Where
Where
Using Equations (8–11), the average rough interval is
Here,
First, we divide X into rough lower limits matrix X- and rough upper limits matrix X+.
Then we calculate their eigenvalues and eigenvectors with the aid of MATLAB software and get relative weight for each indicator.
Thirdly, we get the normalized weight by
The weight of indicator C
i
can be computed by
f* (ω i ) , f (D i ) represent the synthetic weight of indicator C i and weight of dimension D i .
Suppose there are n AMS alternatives A
j
(j = 1, 2, ⋯ , n) to be assessed against m indicators C
i
(i = 1, 2, ⋯ , m). Decision makers apply conventional crisp scores (1, 2, 3, ⋯ 9) to give their ratings of alternatives as to indicators C
i
(i = 1, 2, ⋯ , m). If there are l decision makers in an expert group, the AMS alternatives ranking can be constructed as a multi-criteria decision-making problem, being represented by the evaluation matrix D as:
Where
Where
Here k ∈ [1, l] and
Therefore, rough number
Using Equations (8–11), the average rough interval is
Then, the rough group decision matrix R is established as follows:
For benefit indicators,
For cost indicators,
S+ (i) , S- (i) are PIS and NIS values as to indicator i.
Then, closeness coefficient (CC
j
) can be computed by:
Therefore, we can rank the alternatives according to their CC j in decreasing orders.
There are three steps in the improved approach to evaluate AMS options (as Fig. 1).
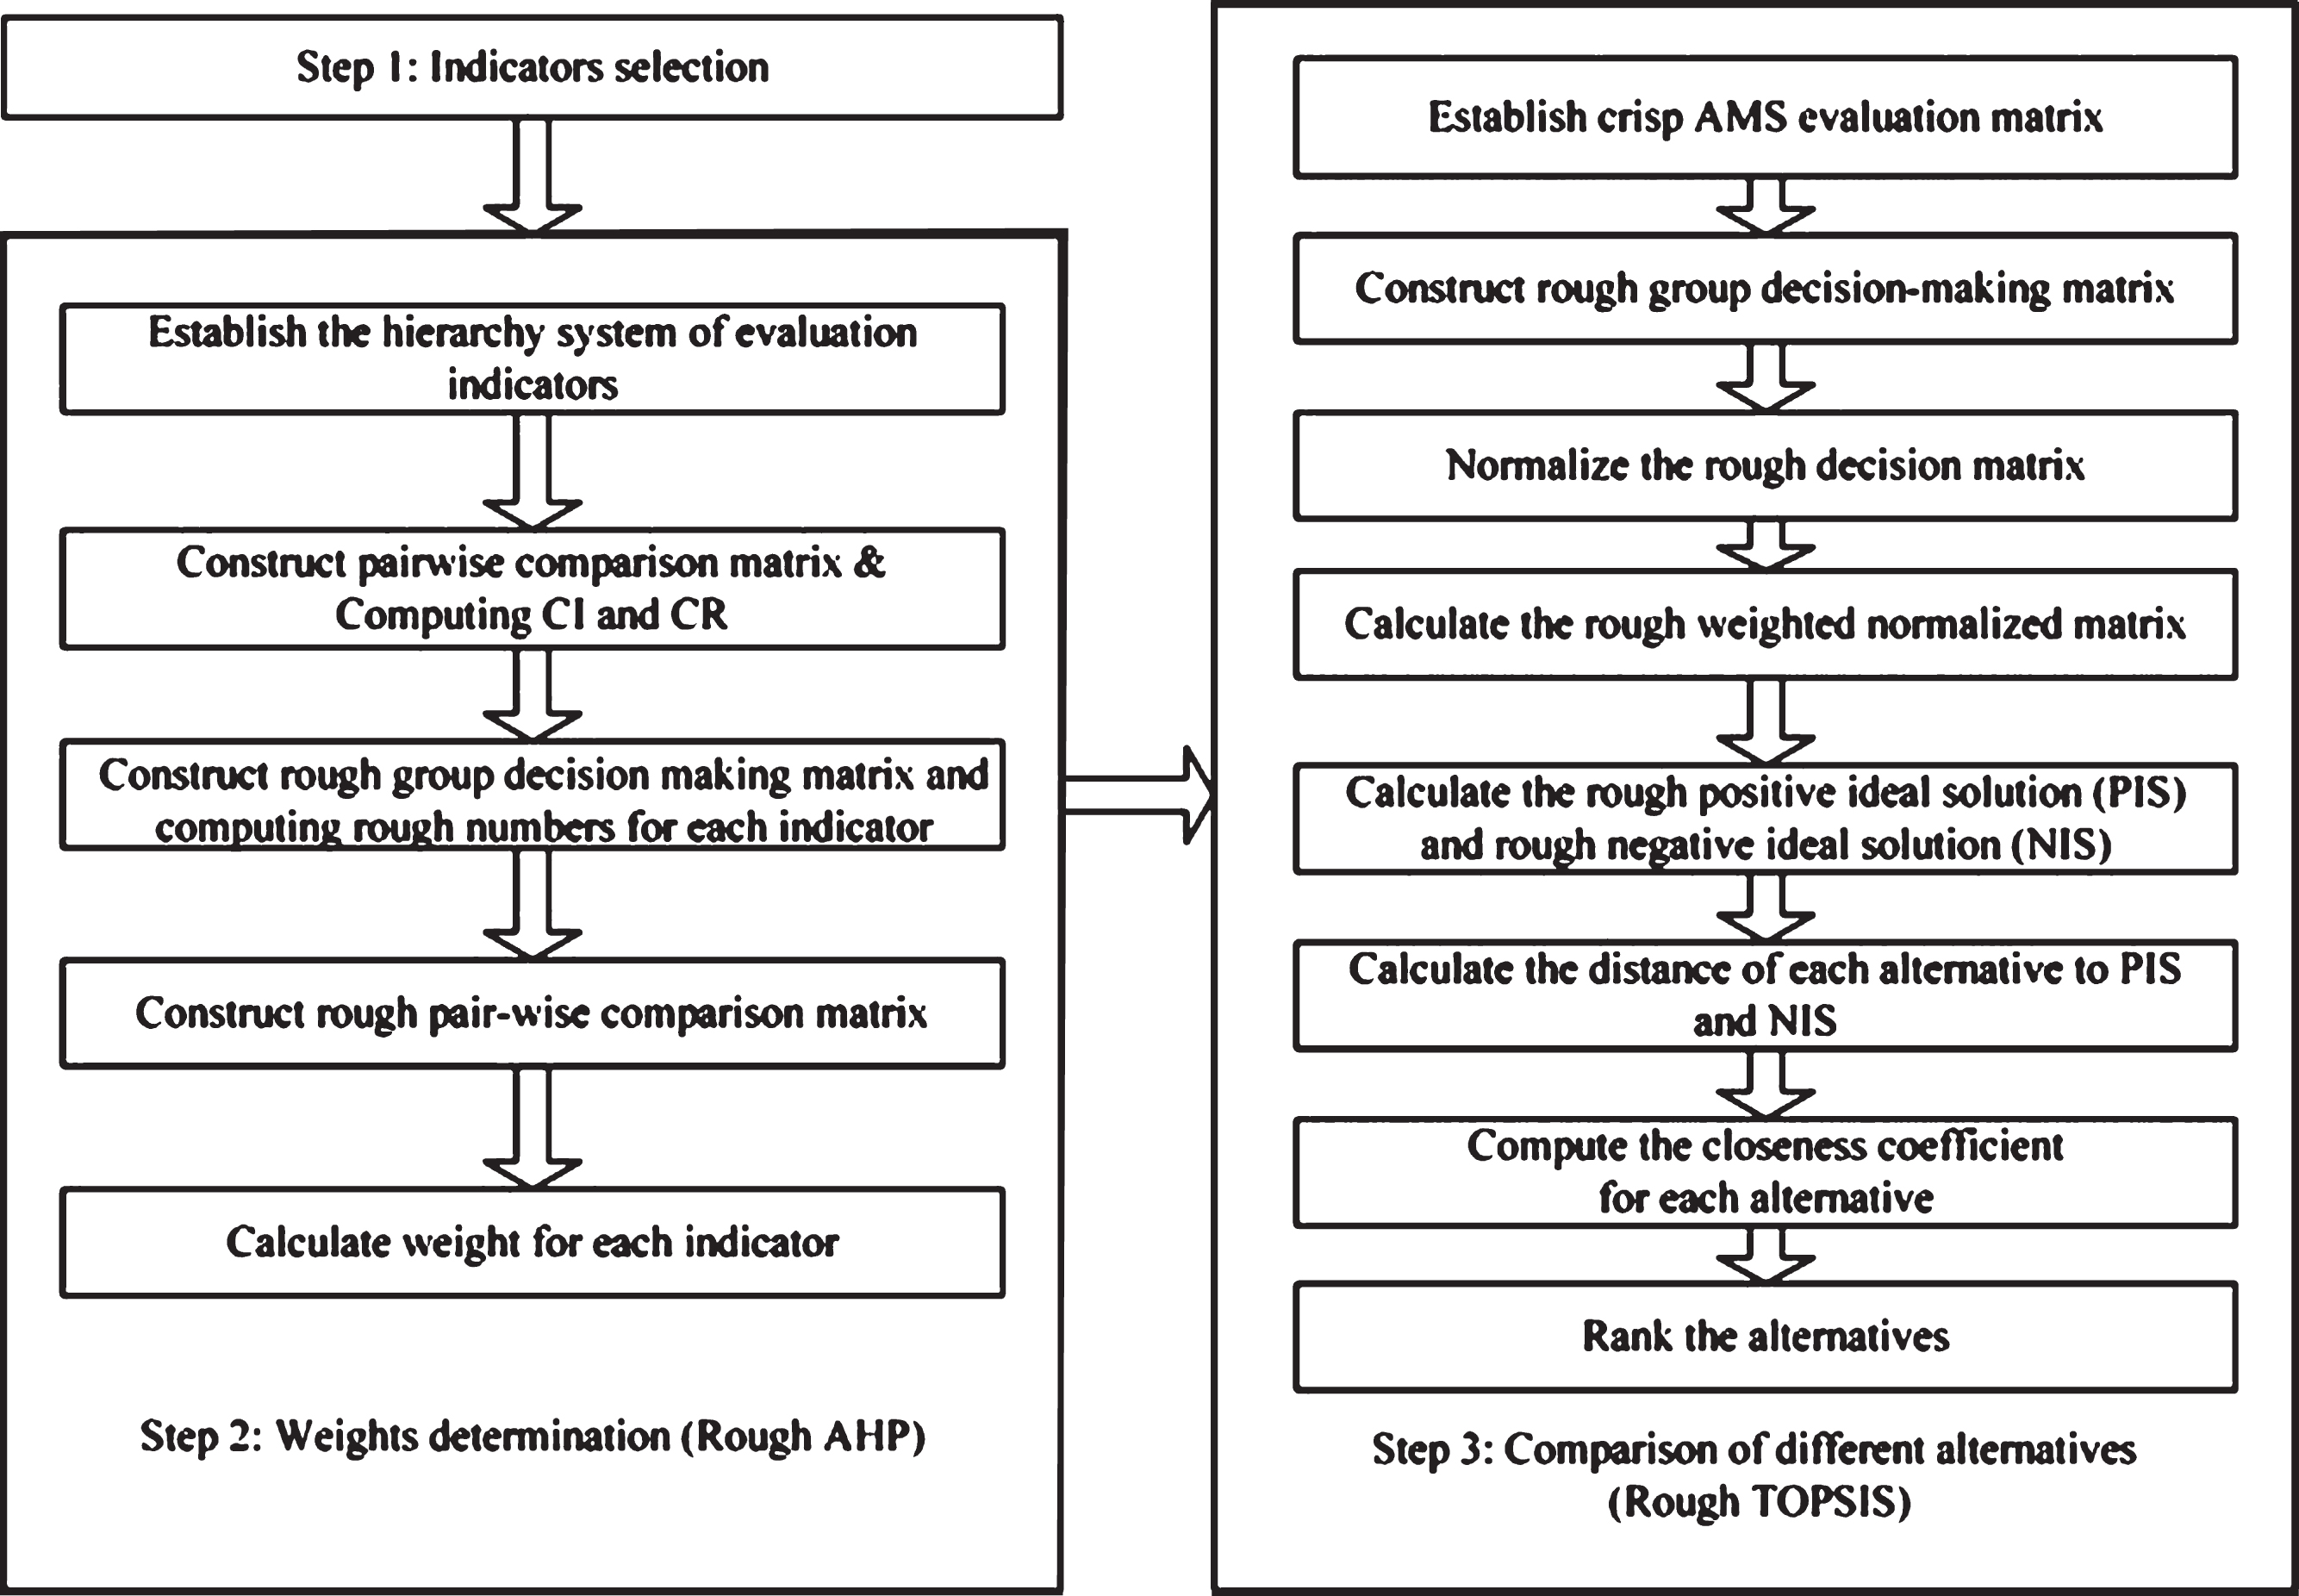
The improved rough set approach for AMS evaluation.
Selection of appropriate indicators is a crucial step to evaluate auto-mobility systems, and we categorize the selected indicators into two categories, i.e., cost category and benefit category indicators. For cost category, the higher the value, the worse the option and for benefit category, the lower the value, the worse the alternative is.
We apply the method of R-AHP described in Section 4.1 to determine the importance of weights for each selected indicator.
Firstly, decision makers including professional practitioners, experienced designers, and experts are invited to evaluate different alternatives with crisp ratings against each indicator. Secondly, rough evaluation matrix is established. Thirdly, R-TOPSIS is applied to calculate the closeness coefficient (CC j ) of each alternative. The one with the highest CC j is chosen as the best AMS option.
Indicator selection
First of all, we identify a list of 48 indicators to evaluate auto-mobility systems [31, 32]. Then we delete those repeated items and choose the most representative 24 indicators by means of expert interviews. Finally, we identify a list with 4 dimensions and 24 indicators to evaluate the performance of AMS. The four dimensions are economic, environmental, auto-mobility system, and social dimension, each with 6 indicators, as shown in Fig. 2. It is obvious that C1 to C3 and C14 to C24 belong to the benefit category, that is to say, the higher the value, the better the alternative. C4 to C13 are cost ones, which means that the lower the value, the better the alternative.
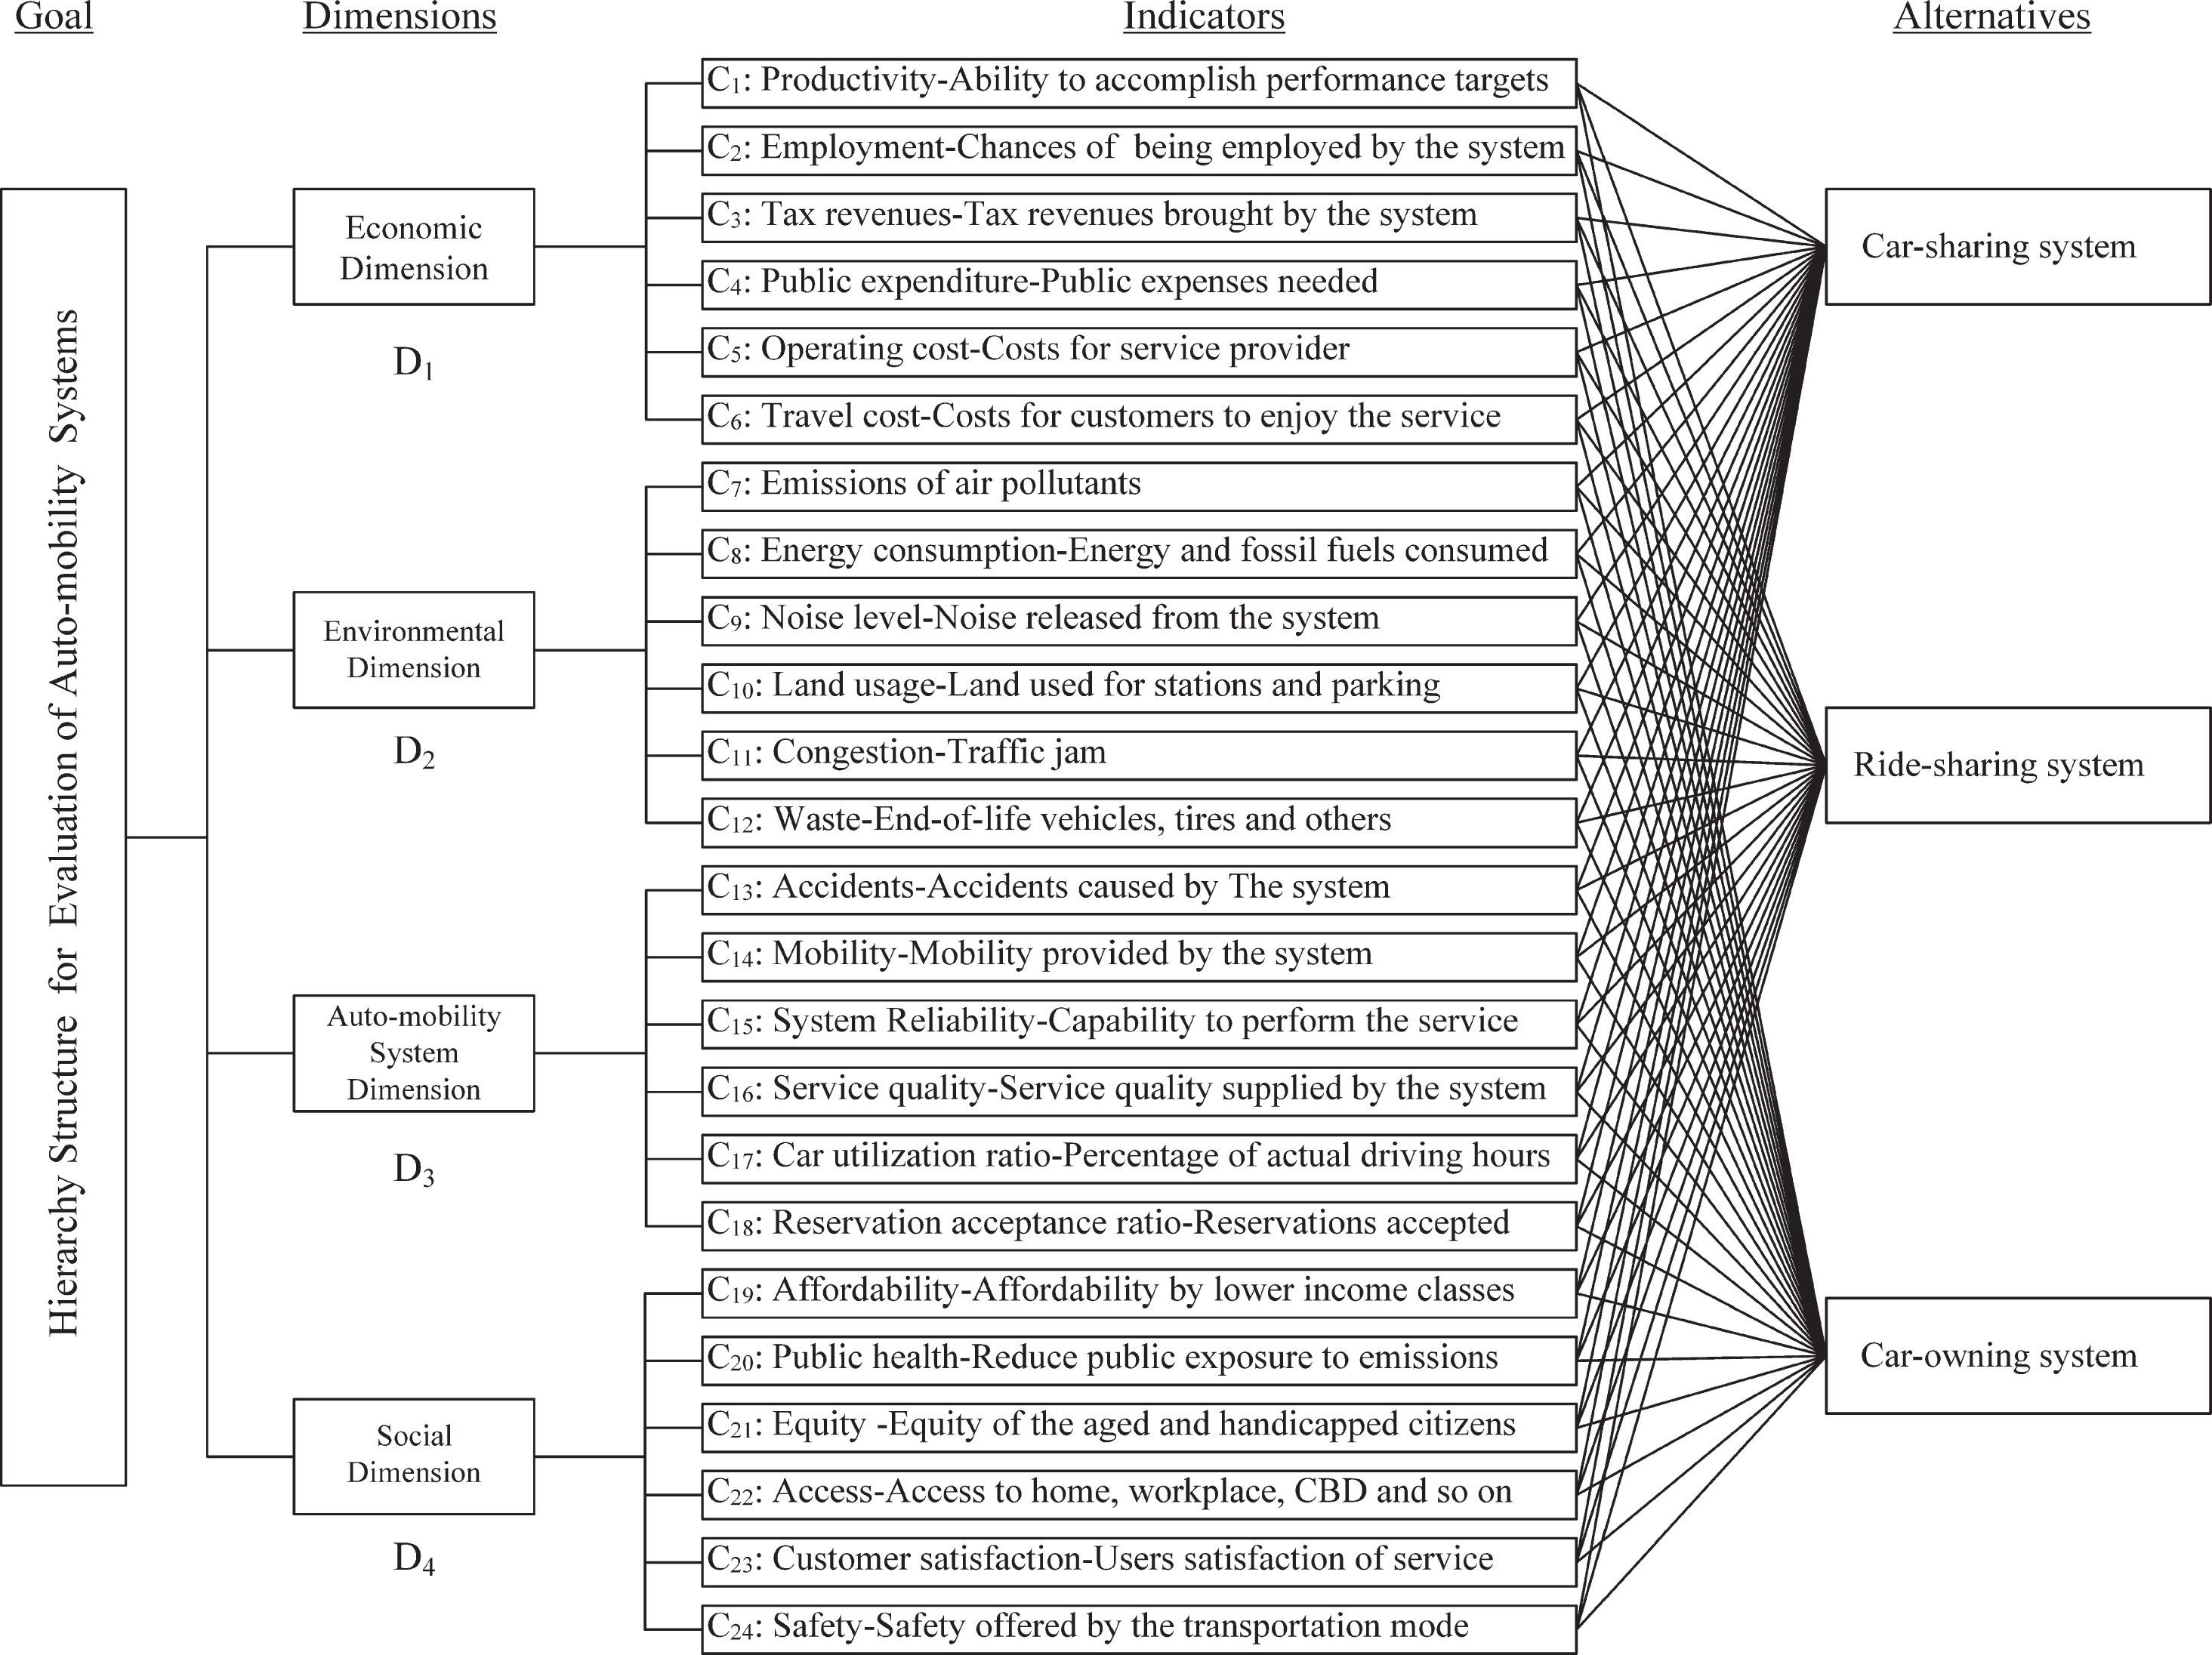
Hierarchy structure for evaluation of auto-mobility systems.
Suppose there are 5 decision makers participating in the evaluation process. For indicators C1 - 6 in economic dimension, 5 pair-wise comparison matrixes can be constructed as follows:
Consistency indexes of the five matrixes are calculated according to Equations (13 and 14).
As to
Therefore, the rough boundary interval is calculated as follows:
Rough number
Similarly, we can obtain the rough number for grades ‘6’ and ‘7’:
Then,
Using Equations (8–11) and (18, 19), the average rough interval of
With the aid of MATLAB, the above procedures can be computed as:
First, we divide X into rough lower limits matrix X- and rough upper limits matrix X+ using Equations (21 and 22).
Then we calculate the eigenvalues and eigenvectors with the aid of MATLAB.
For matrix
The weight of indicator C
i
can be computed by Equation (25). For example,
For the other three dimensions (D2-D4), the above steps are repeated and the final rough weights for all selected indicators are listed in Table 2. It is noteworthy that we assume the same weight (0.25) to the four dimensions due to their relative equal importance and the difficulty of deciding which one is more important than the other. Decision matrixes for D2-D4 are not listed here due to space limit.
Weights of indicators C1-C24
Weights of indicators C1-C24
Invite 5 decision makers to give their crisp ratings of the three alternatives as to each indicator.
Rough evaluation matrix for auto-mobility systems
Rough evaluation matrix for auto-mobility systems
The rough normalized rating for alternative A1 as to indicator C4 (public expenditure) which is a cost indicator can be given by:
Similarly, we can compute the rough normalized values of the three alternatives against all other indicators as Table 4.
Rough normalized matrix for auto-mobility systems
Likewise, we can calculate the rough weighted normalized values of the alternatives as to the selected indicators as Table 5.
Rough weighted normalized matrix for auto-mobility systems
Similarly, we can get the distances of each alternative from PIS
Distances
For example, for alternative A1 and indicators C1 to C24, the distances
Then, closeness coefficient CC j can be computed by Equation (41).
For example, the closeness coefficient of alternative A1 is given by:
Similarly, CC j for alternatives A2 and A3 are calculated as presented in Table 7.
(CC j ) of the three alternatives
Then, we can rank the alternatives according to their CC j (A2 ≻ A1 ≻ A3). Therefore, A2 (ride-sharing) is the best auto-mobility option in a comprehensive sense of meaning.
We carry out sensitivity analysis experiments to figure out how sensitive the decision process is to slight changes in individual weights. The values of the weights are changed slightly to work out their influence on the final decision. Under uncertain environments, sensitivity analysis is particularly useful in determining the indicator weights and selecting appropriate AMS options.
Thirty-one experiments are conducted to analyze sensitivity of each indicator to alternative ranking. In the first 5 experiments, we set weights of all indicators equal to one another, i.e. 1, 3, 5, 7, and 9 respectively. In experiments 6–29, the weight of one indicator is the highest (9) while the others the lowest (1), to find out the most influential indicator in decision making. Then, in experiment 30, we set the weights of benefit indicators as the highest (9) and those of cost indicators to be lowest (1). In experiments 31, we set the weights of benefit indicators as the lowest (1) and those of cost indicators to be highest (9). Figure 3 displays the results of sensitivity analysis experiments, from which we can easily find that out of 31 experiments, alternative A2 (ride-sharing) has the highest score in 21 experiments at a ratio of 67.74%. Alternative A1 (car-sharing) is better than A3 (car-owning) at a ratio of 77.42%. In experiments 10, 19, 20, and 23, alternative A3 ranks better than A2. Therefore, we can arrive at the conclusion that alternative A2 (ride-sharing) can be recommended as the best transportation mode and that indicators weights play an important role in the evaluation of auto-mobility systems.
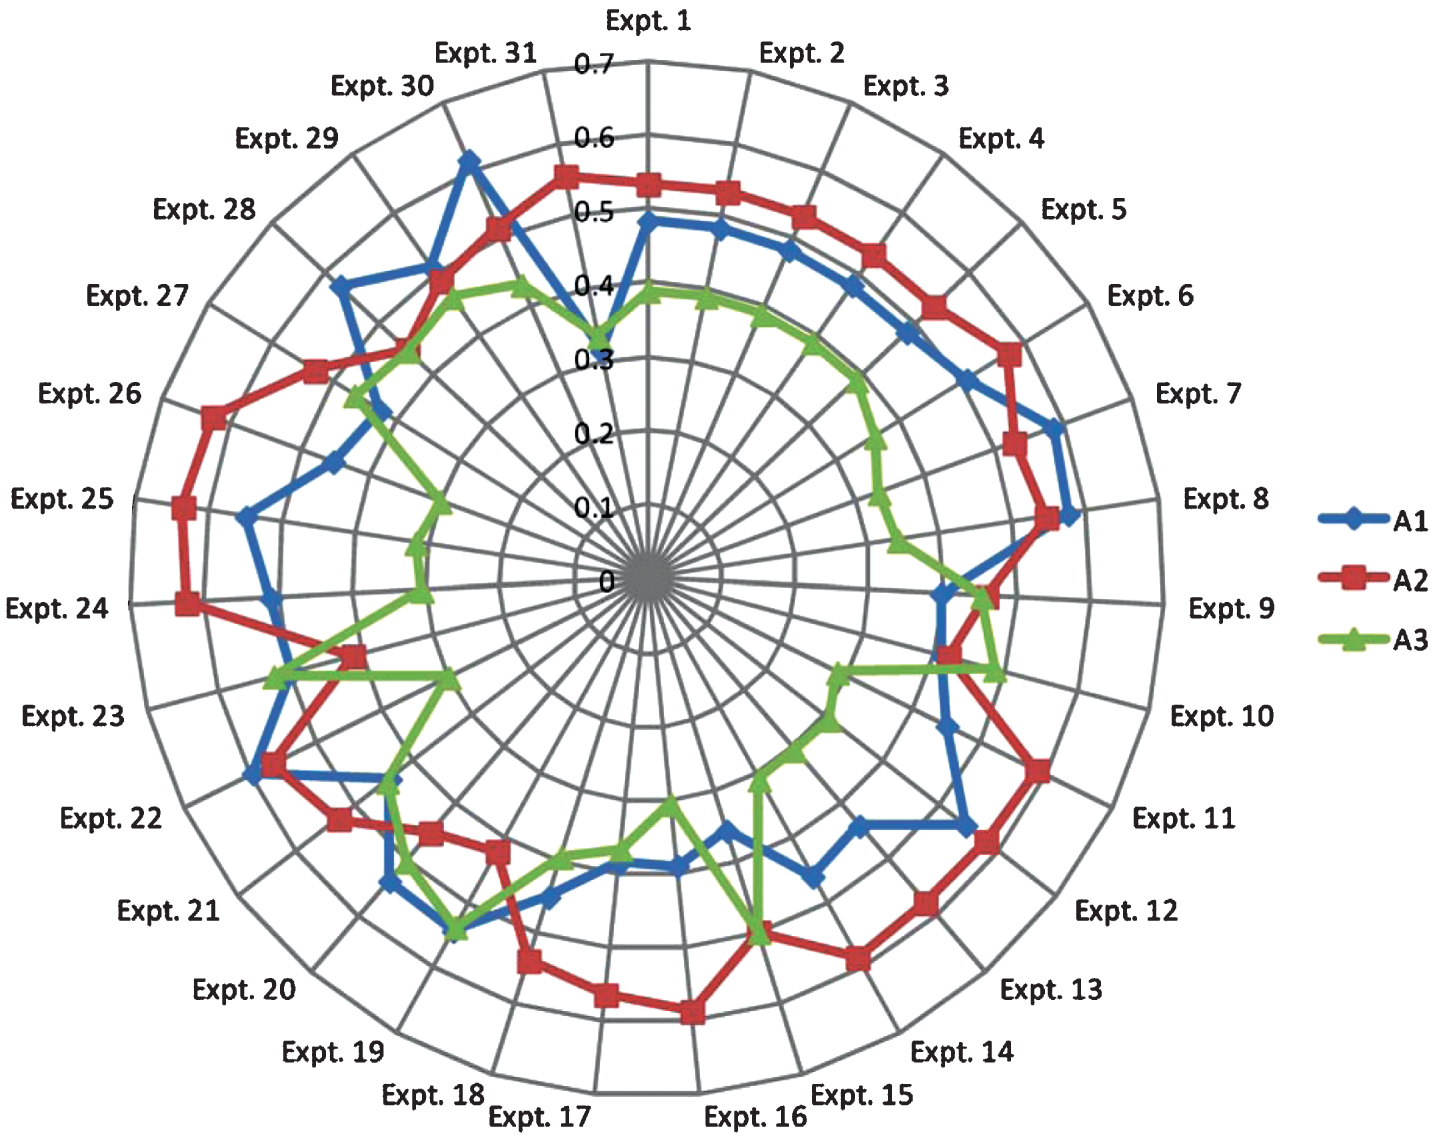
Results of sensitivity analysis experiments.
An improved rough set approach to evaluate auto-mobility systems with application of R-AHP and R-TOPSIS under uncertain environments is developed in this paper. There are three steps in the approach. In step 1, appropriate indicators of auto-mobility systems are identified. They are divided into four dimensions, economic, environmental, auto-mobility system, and social dimension. Indicators C1 - 3 and C14 - 24 belong to benefit category while the others (C4 - 13) are cost ones. In step 2, decision makers are invited to assess the weight for each indicator by means of R-AHP. In step 3, we invite decision makers to compare different alternatives and rank them with the aid of R-TOPSIS. Then we perform a case study to show the applicability of the improved approach and conduct sensitivity analysis experiments to figure out the effect of each indicator on decision making process.
The approach is capable of evaluating different auto-mobility alternatives with uncertainty and vagueness. It is flexible to reflect the subjectivity and vagueness of decision makers since the rough methodology does not need too much priori information. Moreover, the rough evaluation intervals can be modified easily according to slight changes in decision makers’ preferences. However, the proposed framework also has some limitations. Firstly, the proposed method does not take interdependencies of different indicators into account. Secondly, the 24 selected indicators may not represent the actual case comprehensively. Research can be conducted in the future to handle the above-mentioned issues.
Footnotes
Acknowledgments
This research was supported by National Key Technology R&D Program, China under Grant No. 2015BAH21F01; and the 111 Project under Grant No. B13044. We’d like to thank Conny Bakker from Delft University of Technology for her constructive advice. Many thanks also go to the anonymous reviewers for their help to improve this work.