
Abstract
Feature extraction from hyperspectral remote sensing data is an effective method for object classification, and how to classify the object information from hyperspectral remote sensing image has become one of the core technologies of the remote sensing application. Aiming at the characteristics of space modulated interference hyperspectral image (HSI) hyperspectral remote sensing image, in this article a new remote sensing clustering method is presented on the basis of analyzing the principal component analysis (PCA) and independent component analysis (ICA), which is able both to extract data’s independent features in terms on the second-order statistics and higher-order statistical information. The proposed method classifies the HSI hyperspectral remote sensing image better than the traditional methods. Firstly, the definition of the feature weighting between PCA and ICA is used in order to calculate the weighted value. Then, similarity measure contains distance similarity and cosine similarity is introduced. Finally, the recognition rule is constructed to classify the hyperspectral remote sensing image. The true HSI hyperspectral remote sensing is used to evaluate the performance of our method. Experimental results indicate that the proposed clustering method outperforms traditional classification methods, and the classification accuracy reaches to 85% under certain conditions with the suitable number of eigenvectors is 12 and weighted values is 0.8. Meanwhile, the image quality of our method is well preserved.
Keywords
Introduction
In view of the huge advantage of gathering a lot of very narrow spectral continuous image data across a wide range from visible wavelengths to thermal infrared bands [22, 23], in recent years the hyperspectral remote sensing technology has become one of the leading technologies in wide variety of applications including the resource monitoring, forestry survey and space exploitation, etc [5, 13]. Thereinto, the classification of hyperspectral remote sensing images has already be an important research content in the field of remote sensing applications with the rapid development of computer interpretation technology [7]. The traditional classification method of hyperspectral remote sensing data mainly enters on the type of object class and spectral separation model. At present the several major kinds of classification methods contains minimum distance classification (MDC), maximum likelihood classification (MLC), BP neural network (BPNN) and decision tree (DT) [9, 19]. In China the space modulated interference hyperspectral image (HSI) remote sensor is carried in the Small Satellite for Environment and Disaster Monitoring and Forecasting (HJ-1A), and its ground resolution is 100 m and has a total of 115 spectral band images (image sets) which spectral range between 450 nm and 950 nm. However, the traditional clusteringmethods and relevant application for HSI hyperspectral remote sensing data are very few, especially the clustering calculation of HSI remote sensing image are less.
The hyperspectral remote sensing image has more complex features [10, 15] compared to the traditional digital images, and they not only have a lot of spectral bands in which there is a huge data redundancy, but also there are many kinds of random-distributed earth objects in each spectral band and shows extremely complex spectral characteristics [20]. And what’s more, it has affected by the own characteristics of sensor orbit [3], for example, sunshine time [11], imaging angle [18] and slope direction [24], etc. Therefore, how to effectively cluster the hyperspectral remote sensing image has become one of the key problems of the remote sensing application studies.
Principal component analysis (PCA) [2, 4] and independent component analysis (ICA) [17] method, with the huge ability of data compression and elimination redundant and being easy to calculate and analyze, are widely used at present, this also has great application potential in the classification of HSI hyperspectral remote sensing data. In practice, none of the previously mentioned method can be considered the best way for the clustering of hyperspectral remote sensing data. Although some current works adopt the single PCA [21, 25], ICA [2, 8] and support vector machine (SVM) [10] methods, there are serious of problems in the application. For example, application scope is narrow [6], computation complexity and uncertainty of parameter selection [12, 14]. Based on this observation, the present work introduces a new clustering for HSI hyperspectral remote sensing image, a classification technique based on weighted by PCA and ICA, which can better implement both the data compression and elimination redundancy from hyperspectral remote sensing data and obtain the high precision classification image. The experimental result shows that the proposed method is correct and feasible, and improves the classification accuracy of HSI hyperspectral remote sensing data in a certain degree.
Basic theory
PCA method
PCA is one of the most common data analysis methods in statistics. The basic idea [1] is to find out a set of optimal unit orthogonal vector basis (principal component information) in terms of the linear transformation technology (see Table 1), and then to rebuild the sample data according to the linear combination of the above unit orthogonal vector basis so as to minimize the mean square error between reconstruction samples and original samples, namely dimensionality reduction [25]. Through the projection of the data from the original R-dimension space to M-dimension space, R > M, the new data after dimension reduction can maximally retain most of the information of the original data. In essence, the hyperspectral remote sensing image can be seen as that linear superposition by a set of independent image basis [21]. Aiming at the HSI hyperspectral remote sensing image, the k-th band image can be seen as a one-dimension vector x
k
, and then the covariance matrix of the vector is given by Equation (1).
The comparison between PCA and ICA
PCA method is to find some mutually orthogonal axis along with the maximum variance of data sets. The ICA is really an extension of a well-known statistical method with the PCA. The comparison between PCA and ICA are presented on Table 1. This table presents the detailed differences from the view point of signal type, statistical properties, treatment effect and components correlation.
The assumptions ICA [6, 8] are the source variable s is statistical independent, and the essence of ICA [12] is to establish the objective function according to the statistical independence principle from the multi-dimensional observation signals, and to separate the independent components from the observation signals using the optimization algorithm. Meanwhile, the source variable is also a non-Gaussian distribution. Obviously, the distribution in the basic model is unknown [3, 24]. The mixed matrix A is calculated and can further calculate the inverse matrix of A. That is to say to separation the matrix W = A-1, thus has gotten the estimate y of dependent component s. The ICA model is given by Equation (3).
The ICA is a statistical method that deals with observations vector (multivariate) to extract linear components as independent as possible. This simple idea has proved very fruitful for signal processing and HSI hyperspectral images in many fields, such as interference from radio waves, biomedical imaging, and remote sensing images.
As can be seen from Table 1, the statistics information of data from the point of view of PCA and ICA were described respectively. PCA can not only realize the data compression of high-dimensional data in terms of second-order statistics analysis, but also retain maximally the structure distribution of high-dimensional data. ICA is a continuation of PCA method in high-order statistics analysis, it is able to extract the different independent characteristics in terms of high-order statistic information of data, and more accurately describe the local detail characteristics of data. The own shortcomings of PCA and ICA method, such as limited to sub-patterns and summarization of variance is not good etc., can be overcome by the comprehensive utilization of two methods. In this paper, a new remote sensing classification for HSI hyperspectral image has been proposed, and the detailed process with weighted PCA and ICA is shown below:
Feature weighting
For the hyperspectral remote sensing image x, x p and x i represent respectively the extracted features by PCA and ICA, y represents the weighted feature and y = wx i + (1 - w) x p . Suppose there is N-dimensional remote sensing image x1, x2, x3, …, x N , so the corresponding weighted feature can be represented as y1, y2, y3, …, y N .
Thereinto, the extracted number of principal component characteristics and independent component characteristics can be determined by the contribution rate and cumulative contribution rate.
The contribution rate is illustrated in Equation (4).
The cumulative contribution rate is illustrated in Equation (5).
In this study, the distance similarity method and cosine similarity method are used to evaluate the different similarity. For the given model u and v, the similarity measure can be expressed as S (u, v), the greater the S value, the more similar the u and v.
Distance similarity measure
The formula of distance similarity measure can be expressed as d (u, v) = ∥ u - v ∥ 2. For the given unclassified HSI hyperspectral remote sensing image y, the distance calculation formula between y and different spectral bands image y i can be expressed as d (u, v) = ∥ y - y i ∥ 2, i = 1, 2, 3, …, N. And then the similarity measure S can be expressed as , i = 1, 2, 3, …, N.
Cosine similarity measure
The formula of cosine similarity measure can be expressed as . For the given unclassified HSI hyperspectral remote sensing image y, similarly, the cosine between y and different spectral bands image y i can be expressed as cos(y, y i ), i = 1, 2, 3, …, N. And then the cosine similarity S can be expressed as S (y, y i ) = cos(y, y i ), i = 1, 2, 3, …, N.
Recognition rule
For the unclassified HSI hyperspectral remote sensing image y, the similarity between y and each spectral band image y i is calculated, and is summarized into the most similar training samples class j according to the similarity value. The calculation formula of class j can be expressed as .
Experiments
Experimental environment
Taking the HSI hyperspectral remote sensing image as the data source in this study, each HSI hyperspectral remote sensing image is composed of four kings of earth objects including construction land, water, green land and farmland. And the scope of the study area is 100×100 pixels. The top 40 remote sensing images serve as the training samples, and the remaining 75 remote sensing images serve as the test samples. Therefore, there are 160 and 300 earth objection samples in training set and test samples respectively. The whole process is complemented by the ENVI 4.6 and Matlab 7.0 software.
Experimental process
Image preprocessing
In the actual application it is necessary to complement the image preprocessing including rough geometric correction, radiometric correction, precise geometric correction and atmospheric correction, etc. Secondly, the corresponding parameters contains the type of sensor, flight altitude, ground resolution, center latitude and longitude and imaging time are set in the process. Thirdly, the atmospheric parameter and aerosol model are inputted in the preprocessing. After the image preprocessing, the HSI hyperspectral remote sensing image are basically reflect the true distribution of different kinds of earth surfaces greatly reduces the influence of water vapor and atmospheric absorption.
The detailed changes of spectral profile of same pixel before and after the image preprocessing are illustrated in Fig. 1(a) and (b). From Fig. 1(a), the reflection ration between 700 nm and 800 nm increased rapidly and forming a reflective steep and between 800 nm and 900 nm reduced obviously and its vegetation spectral curve tends to be more reasonable. From Fig. 1(b), there is a certain bands noise in the spectral profile; this is mainly caused by the response uneven of remote sensor in the imaging. The main purpose of this experiment is to evaluate the proposed method performance and therefore it is not need to reduction of the noise.
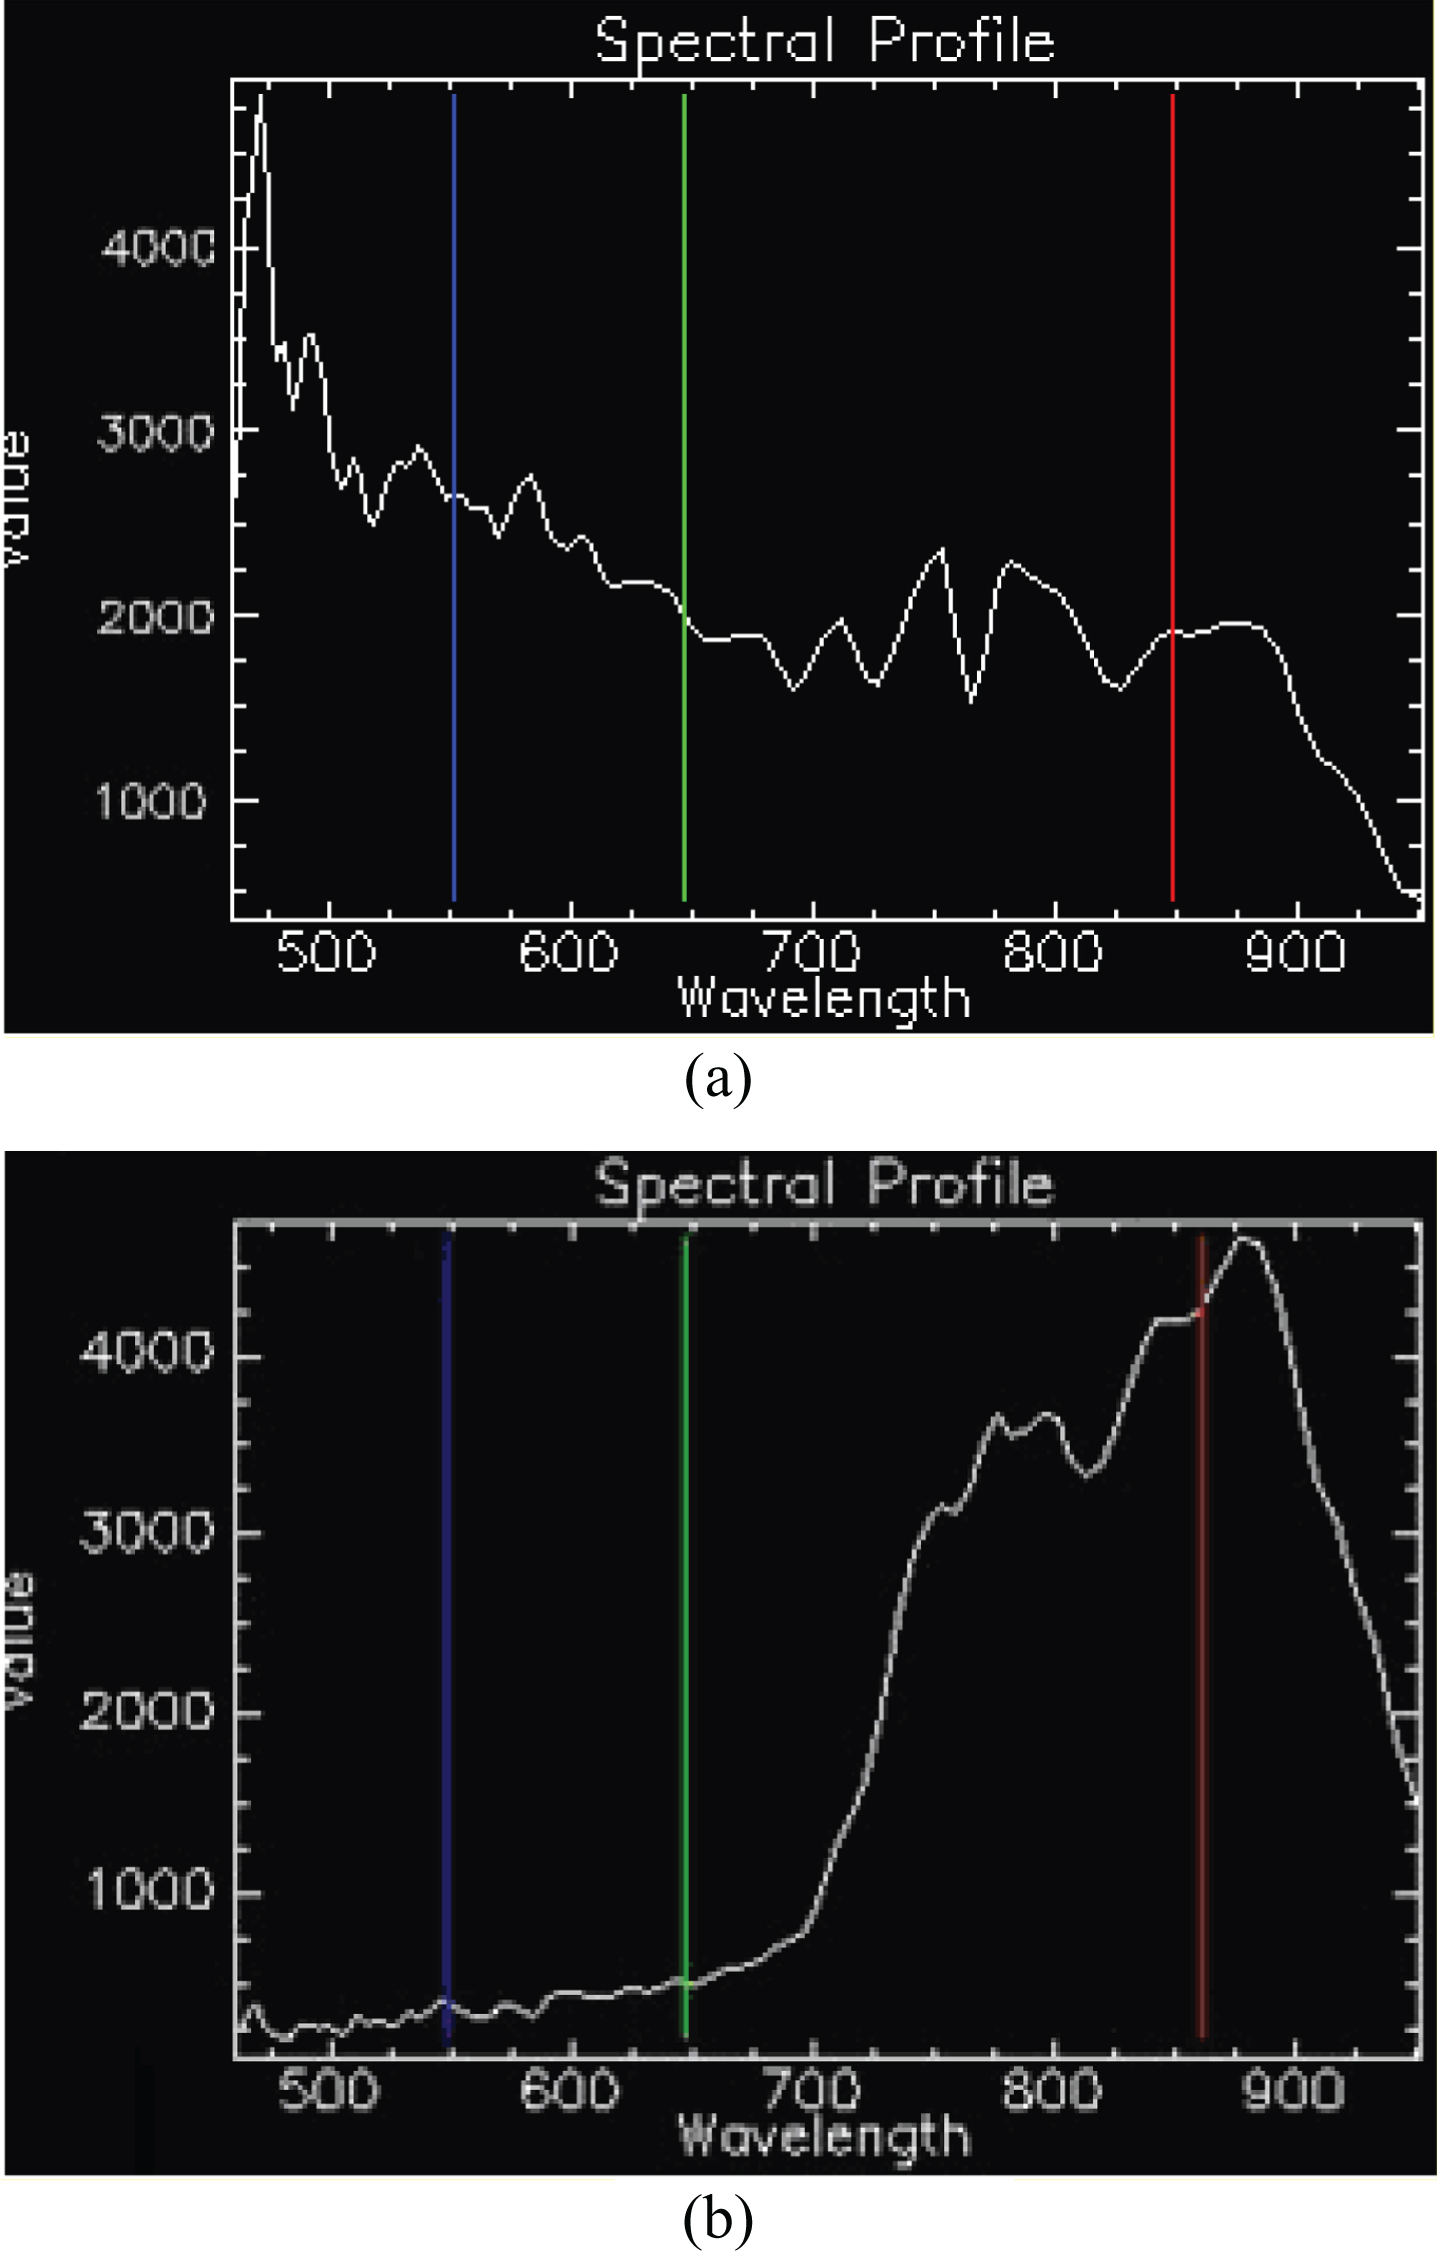
Vegetation spectral profile before (a) and after (b) atmospheric correction.
In this experiment, the weighting mode of PCA and ICA are presented on Table 2. This table presents clearly the four combination of weighted model between distance similarity measure and cosine similarity measure. From Table 2, the four weighting modes are mode 1, mode 2, mode 3 and mode 4 respectively. The ω is the weighted value, 0 ≤ ω ≤ 1. Suppose that the weighted value of PCA method is ω, and the weighted value of ICA method is 1 - ω. When using only PCA method, the weighted value ω = 0; when using only ICA method, the weighted value ω = 1.
Weighting modes
Weighting modes
If all training data sets are used to train, it will not only waste a lot of computer memory resources and be very time-consuming, but also will not necessarily achieve the best effect. So in the actual experiments we can determine the optimal number of eigenvector by calculating the contribution rate and cumulative contribution rate. The contribution rate and cumulative contribution rate of training samples in this experiment are calculated in Mat lab software. It is illustrated in Fig. 2. According to the previous works [21, 25], the cumulative contribution rate between 85% and 95% are appropriate, and it is designed at 90% in common. Therefore, in this experiment we also adopt this rule of cumulative contribution rate is 90%. From Fig. 2, it can achieve better training effect when the number of eigenvector is 12 on the condition that the cumulative contribution rate is 90%.
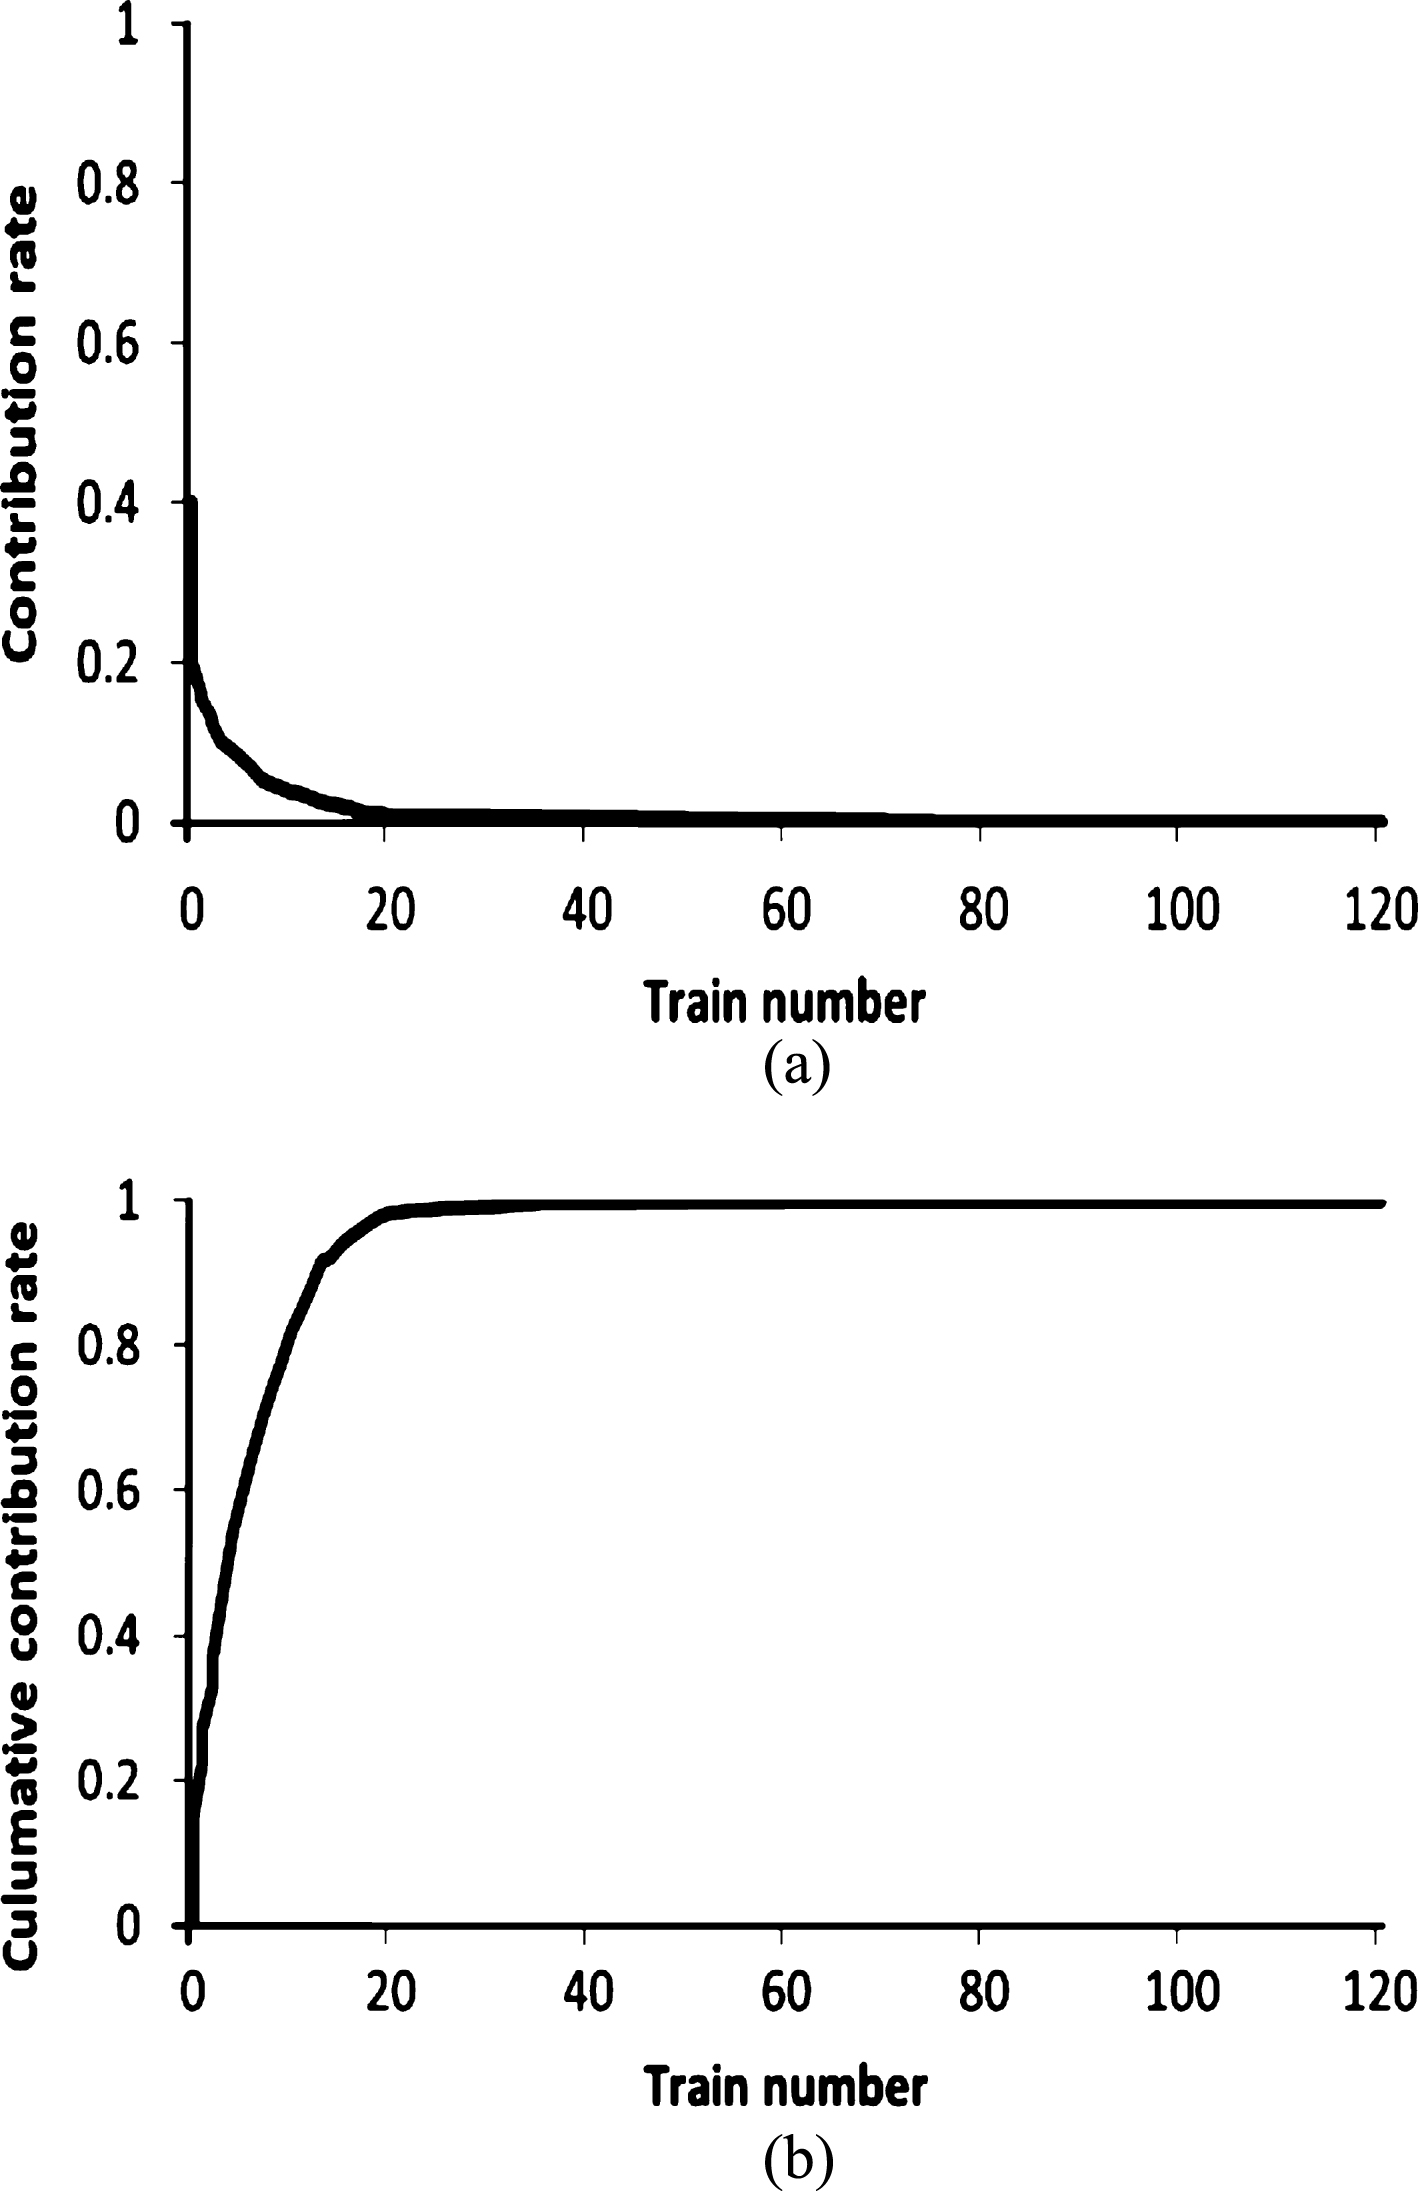
Training set’s contribution rate (a) and cumulative contribution rate (b).
Figure 3 shows the comparisons of extracted thematic information from HSI hyperspectral remote sensing image. Five types of comparisons were investigated: When the PCA method is used to classify the HSI hyperspectral remote sensing image, that is to say, the weighted value ω = 0, the precision of thematic information extraction with distance similarity measure (mode one) reach 68%, 69% and 66% respectively, the precision of thematic information extraction with cosine similarity measure (mode two) reach 70%, 71% and 69% respectively; When the ICA method is only used to classify the HSI hyperspectral remote sensing image, that is to say, the weighted value ω = 1, the precision of thematic information extraction with distance similarity measure (mode one) reach 87%, 88% and 85% respectively, the precision of thematic information extraction with cosine similarity measure (mode two) reach 84%, 85% and 83% respectively; From the perspective of using single method with PCA or ICA, the precision of thematic information extraction from HSI hyperspectral remote sensing image by ICA method is better than by PCA method, no matter with distance similarity measure or cosine similaritymeasure; When the weighted value is ω = 0.8, 0.81 and 0.78, and with mode two, the precisions of the method proposed in this paper reach 88%, 87% and 85% respectively, and have good classification performance; The optimization of data optimization is very important for HSI hyperspectral remote sensing image classification. The number of eigenvectors directly decides the precision of thematic information extraction from HSI hyperspectral remote sensing image. Therefore, in the actual applications it is necessary to optimize the suitable data optimization according to the actual condition and data characteristics so as to achieve the best effect of classification.
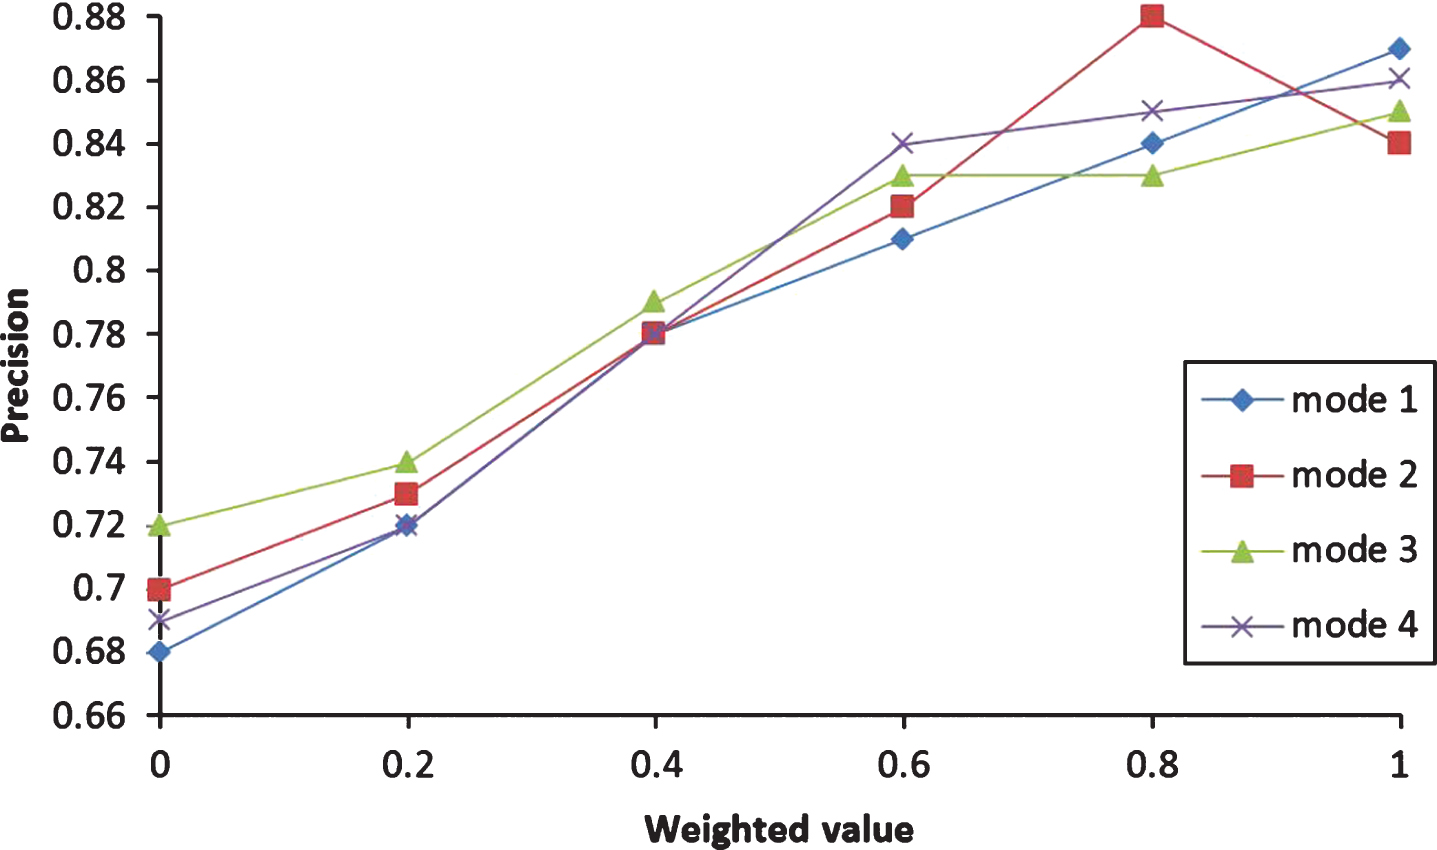
Classification with different combination mode 1, 2, 3 and 4.
In short, the thematic information extraction precision is higher when ω = 0.8 with the condition of weighted model 2, so in the next the experiments are all used the same weighted value.
Figure 4 shows the classification accuracy of HSI hyperspectral remote sensing image by proposed method with weighted mode 2.
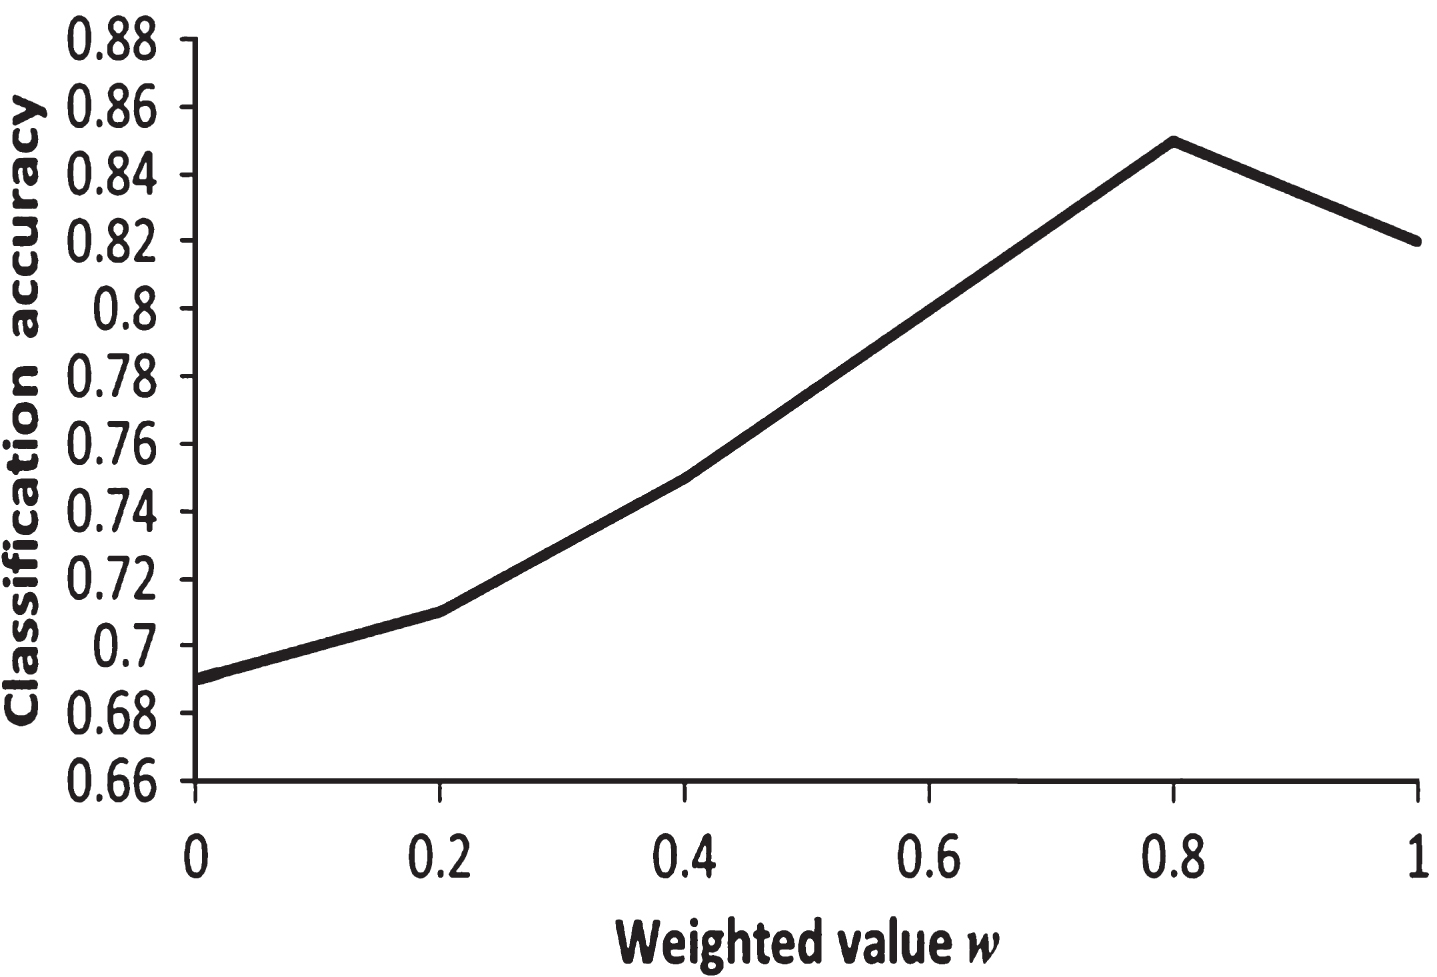
Classification accuracy of HSI hyperspectral remote sensing image by weighting PCA and ICA method with mode 2.
Figure 4 shows the classification accuracy of HSI hyperspectral remote sensing image by proposed method with mode 2, four types of comparisons were investigated: When only PCA method is used to classify the HSI hyperspectral remote sensing images, namely ω = 0, the classification accuracy of weighted mode 2 reaches 69%; When only ICA method is used to classify the HSI hyperspectral remote sensing images, namely ω = 1, the classification accuracy of weighted mode 2 reaches 82%; From the perspective of using single PCA or ICA method, the classification accuracy of HSI hyperspectral remote sensing image by ICA method is better than that by PCA method; Similarity, when the ω = 0.8, the proposed method’s classification accuracy with the weighted mode 2 reaches 85%, and has good classification performance.
Experiments
The proposed thematic information method in this paper based on weighted PCA and ICA was tested and evaluated by the real HSI hyperspectral remote sensing image with 500×500 pixels, represents an urban area in the southwest China. The false color composite image of HSI hyperspectral remote sensing image is processed in ENVI software. It is illustrated in Fig. 5. From Fig. 5, the research area consists of four types of land use classes, for example, agricultural land, green land, water area and construction land, etc.
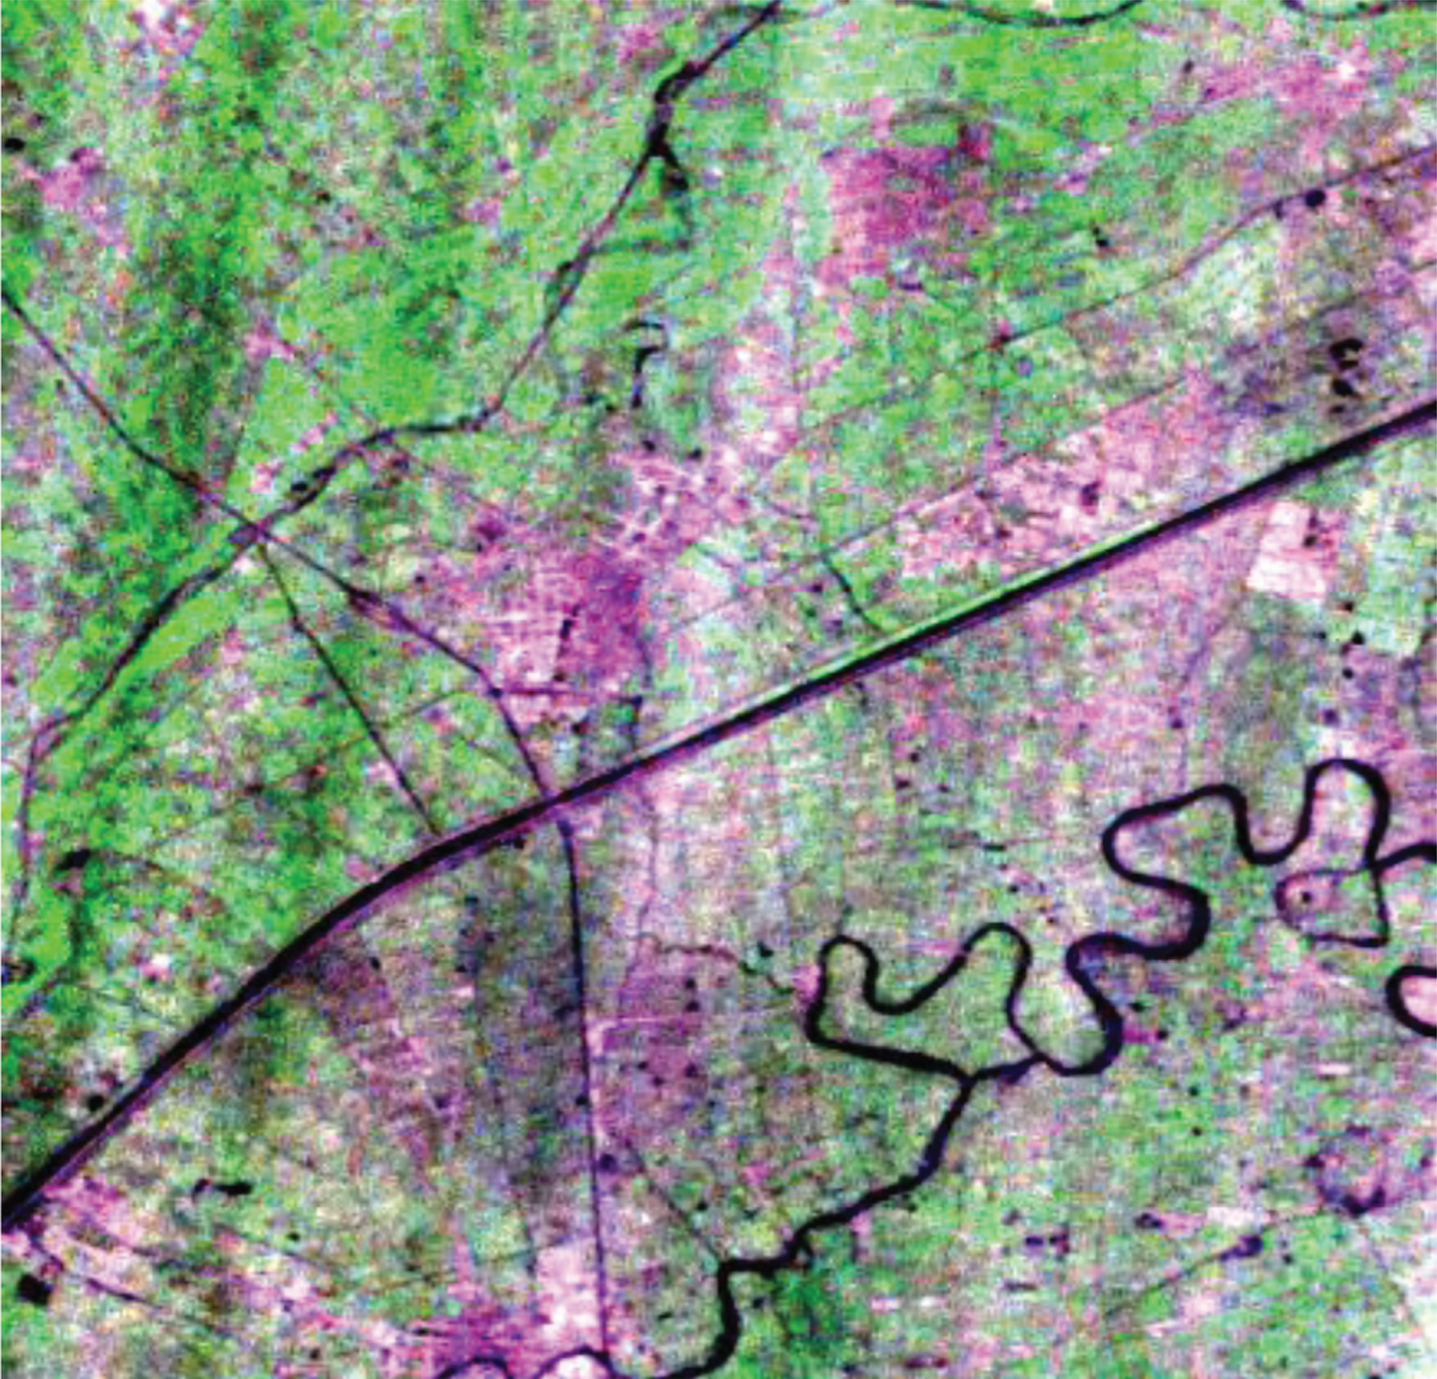
HSI hyperspectral remote sensing image.
As can be seen from Fig. 5, the construction land is presented in pairs of spots and the water area mainly presented linear or strip inclusions. In order to reduce the data dimension and increase the operation efficiency, the PCA and ICA are used to process the HSI hyperspectral remote sensing image, and the weighted value ω = 0.8.
Classification of HSI hyperspectral remote sensing image with proposed method when the weighted value ω = 0.8 is calculated, and the result is illustrated in Fig. 6.
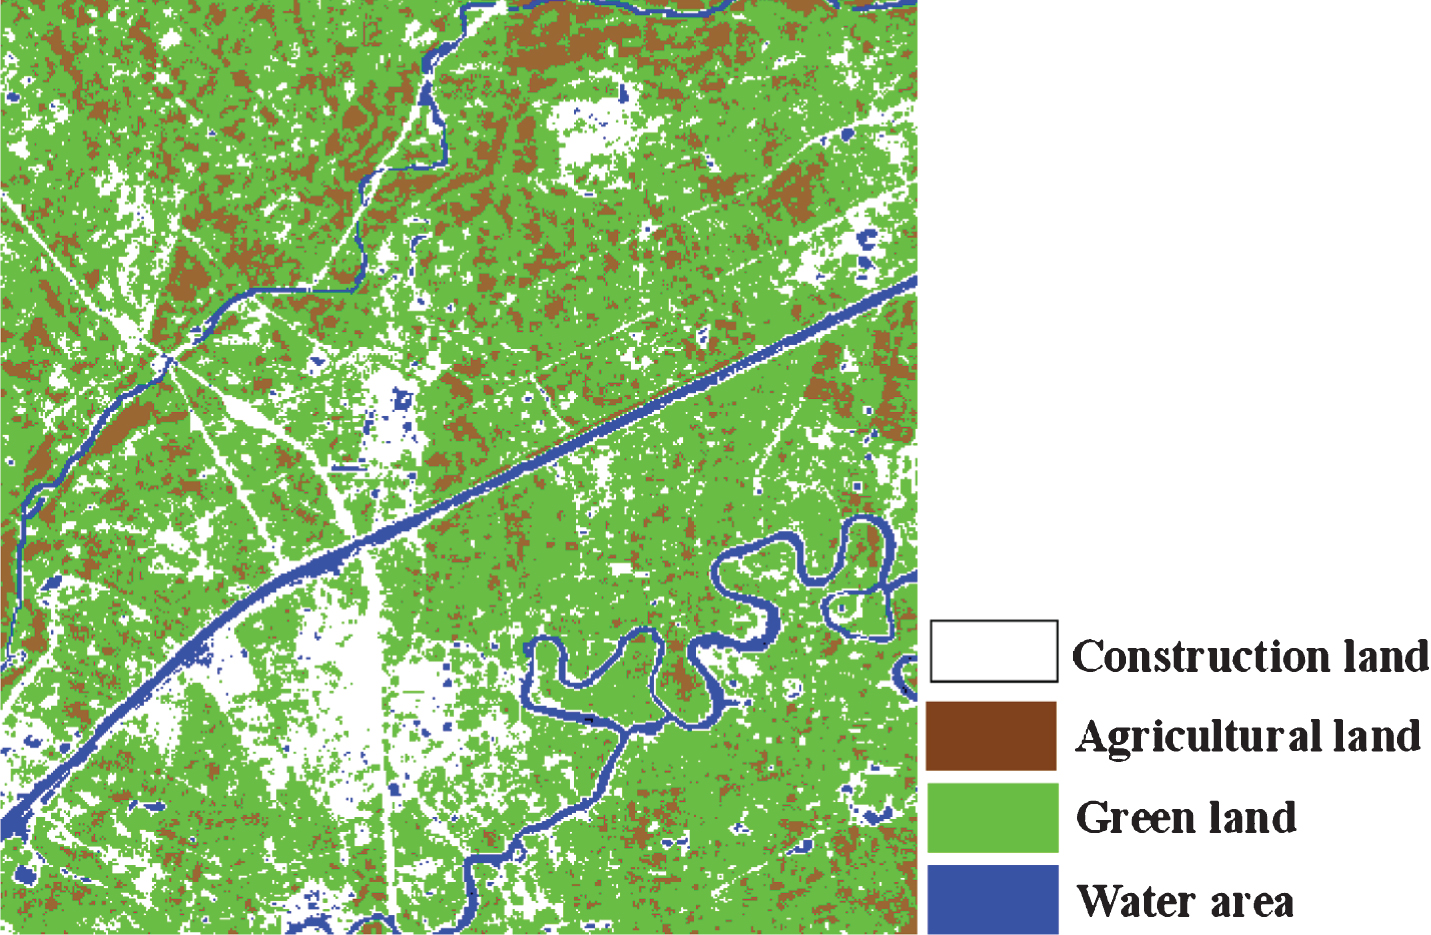
Classification result of HSI hyperspectral remote sensing image.
As can be seen from Fig. 6, we found that the classification image by the proposed method has good image quality and less broken map spots. In addition, in order to assess the classification of HSI hyperspectral remote sensing image, in this experiment, 500 data points were randomly generated by program. Next, the accuracy assessment of the classification is performed with Kappa coefficient and overall accuracy. The classification accuracy is shown on Table 3.
The classification accuracy
Table 3 also presents the overall accuracy and Kappa coefficient reached to 89.75% and 0.8119, respectively. From the single earth surface extraction accuracy, the green land’s extraction accuracy is the highest and reached 92.58%, followed by the agriculture land which reached 90.62%. Compared to the green land and agriculture land, the water area and constructed land’s extraction accuracy are lower than the former, and only reached 89.54% and 86.25% respectively. Whereinto, the classification accuracy of construction land and water area is lower than the other three types of land use classes, this is because the construction land and water area has irregular shape and confused with the surrounding area. To some extent the classification accuracy shows the proposed method with weighted PCA and ICA has good thematic information extraction accuracy for HSI hyperspectral remote sensing image.
In addition, in order to evaluate the proposed method in the HSI hyperspectral remote sensing thematic information extraction, the BPNN, MDC and MLC are introduced into the next assessment. The thematic information extraction of the above three method are calculated in this experiment. The result is illustrated in Fig. 7, and the classification accuracy is shown on Table 4.
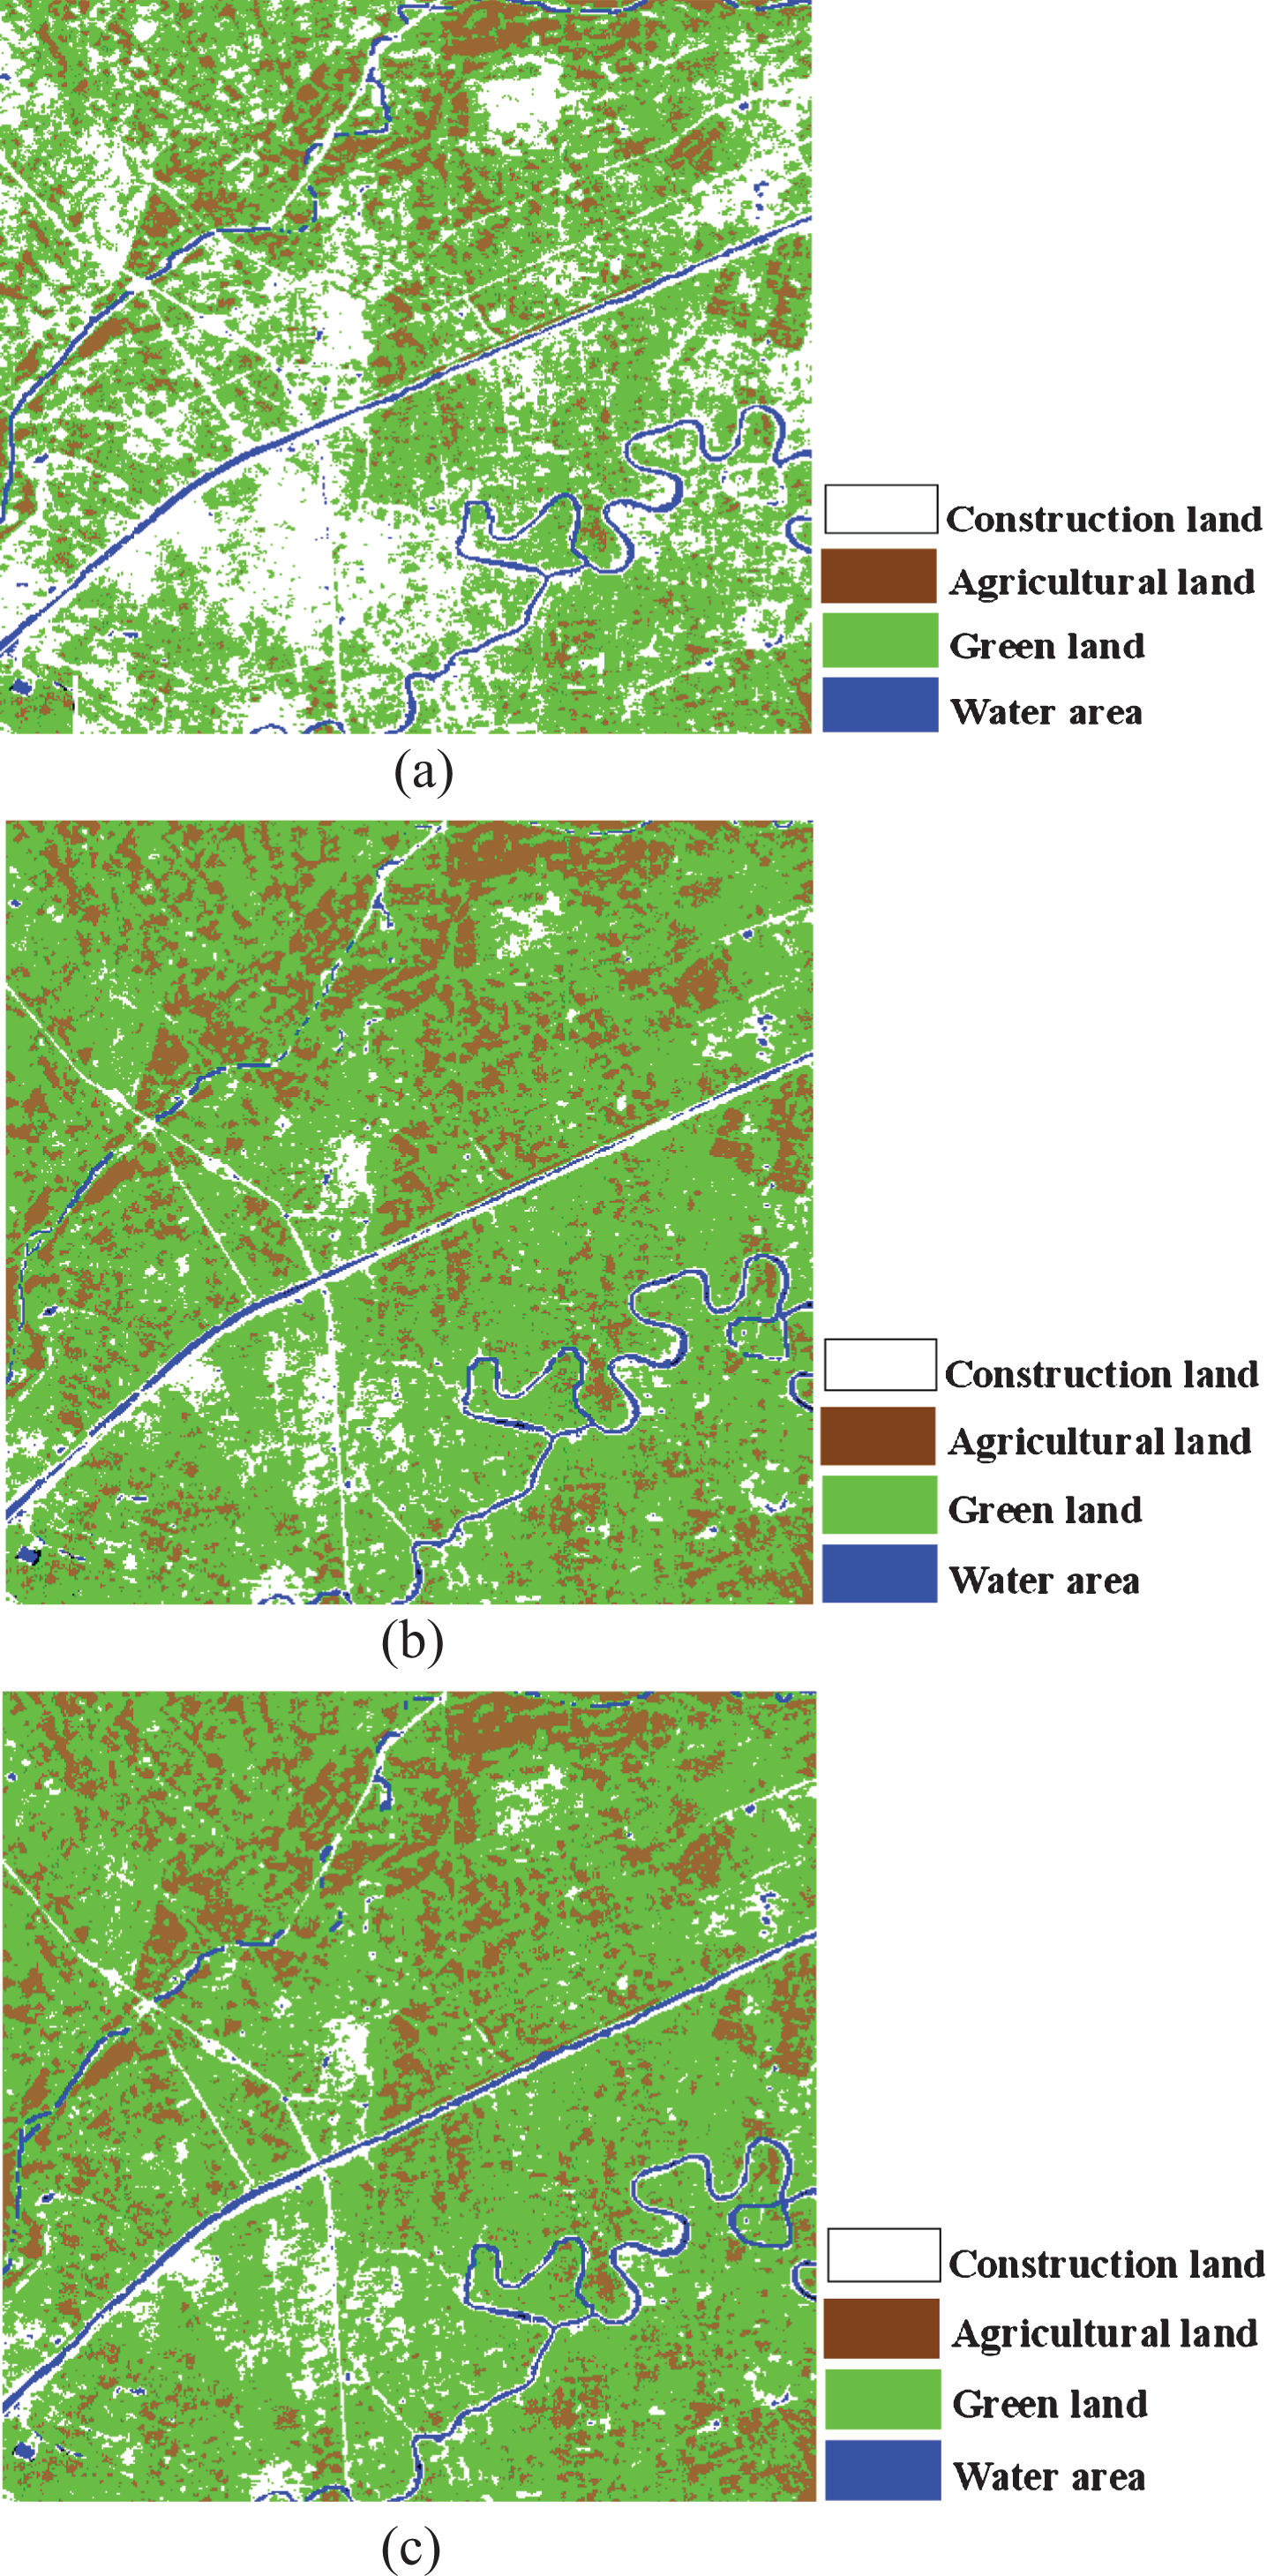
Classification result of BPNN (a), MDC (b) and MLC (c).
The classification accuracy comparison of different method
From the statistical analysis and the results on Table 4, the proposed method in this paper has the best thematic information effect compared with the other three method, its overall accuracy and Kappa coefficient reached 89.75% and 0.8119 respectively, and superior obviously to the other methods. This is also illustrated in Fig. 7.
For BPNN method, the overall accuracy and Kappa coefficient reached 65.23% and 0.4603, the misclassification of different kinds of earth surface is worst in all methods. This is mainly because the excessive number of bands involved in the network training. What’s more, the MDC and MLC method is interposed between BPNN method and the proposed method in this paper. From the image quality, the image quality of proposed method is best, and the visual effect is very clear, followed by the MDC and MLC methods, the BPNN method is the worst.
Conclusions
PCA and ICA mainly concern second-order statistics and high-order statistics information, and have good complementarity, so the combination of both of the above methods has a certain practical significance and feasibility in the actual applications. Aiming at the classification of HSI hyperspectral remote sensing data, this paper presented a new clustering method based on weighted PCA and ICA. For such, the weighted PCA and ICA method mainly studies the feature weighting, similarity measure and recognition rule. Based on the combination of weighted mode between distance similarity measure and cosine similarity measure, the experiment realizes that it can achieve better training effect when the number of eigenvector is 12 on the condition that the cumulative contribution rate is 90%.
Further HSI hyperspectral remote sensing image case will be considered the comparison to the traditional classification methods, i.e., BPNN, MLC and MDC, etc. This work finally realizes the classification of HSI hyperspectral remote sensing image. The results show that the proposed method can achieve good effect of image quality and high classification accuracy from HSI hyperspectral remote sensing image in the condition that selecting the suitable eigenvector number of training set and weighted value.
However, on the one hand, this work is just aimed at the HSI hyperspectral remote sensing image, and it should be noticed that whether or not it is suitable for other types of remote sensing data, for example, multi-spectral remote sensing image and high-spatial resolution remote sensing image, it is unknown at present. On the other hand, in the applications how to select the suitable number of eigenvectors and weighted value corresponding to different types of remote sensing images is still unknown too. Therefore, both these problems require further studies and investigations in our following researches.
Footnotes
Acknowledgments
We thank the vital comments and suggestions made by the anonymous reviewers and editorial team. This work was supported by the Projects of National Science Foundation of China (41404024), Shanghai Science and Technology Development Foundation (16dz1206000) and Young Teachers Training and Supporting Plan in Shanghai Universities (2014–2016). The authors gratefully acknowledge thesesupports.