
Abstract
The microarray data are important to detect diseases, however, there are a large number of genes with small sample size, and this leads to slow convergence speed and reducing the prediction accuracy. Therefore, reducing the dimension of data is needed as preprocessing step for classification of data. There are two methods can be used to perform the dimension reduction, namely, the feature extraction and feature selection. The feature extraction methods are transforming data into another space and then a subset of features are selected using some criteria. The projection of the measurements, using these methods, is different from the original data. Unlike feature extraction, the feature selection methods select relevant features without changing their values, however, these methods need a large time than feature extraction. There are some algorithms can simultaneously select and extract features from data to take the advantages of both methods. This paper proposed a new simultaneous feature extraction/selection method for high-dimensional microarray data. The proposed method combines fuzzy neighborhood rough set method with nonnegative matrix factorization based on multiobjective evolutionary. To evaluate the accuracy of our approach, a computational experiments were performed on seven gene microarray datasets with diverse characteristics. Experimental results illustrate that the proposed method is better than other algorithms in term of performance measures.
Keywords
Introduction
In the biological research such as proteomic mass spectrometry data, genome-wide microarray data, and metabolic data, there are a lot of genes (features) [60]. Determining relevant features is important to know the function of gene types of cells, and others. However, microarrays always contain thousands of genes with relatively few samples, this causes many difficulties in providing an efficient and accurate analysis. This might loss useful information, which leads to inaccurate prediction results and slow classification performance [7]. So the dimension reduction (DR) is needed before any further analysis.
The DR is defined as the operation of selecting a map that transforms the sample from measurement space into the feature space. The common two methods to perform DR are selecting the features in, 1) the measurement space, 2) the transformed space. The aim of the feature selection in the first method is to remove the irrelevant/redundant features [5].
While; the aim of the second method is to get a new transformed space through using all the information in the measurement space. Consequently, the higher dimensional data are mapped to a lower dimensional, this method is called feature extraction [17, 30].
There are several feature extraction approaches such as principal components analysis (PCA) [6, 32], nonnegative matrix factorization (NMF) [1, 2] and independent component analysis (ICA) [3, 27]. These methods have been extensively applied to biological data analysis [18, 34]. Firstly, PCA reduces the uncorrelated features through a group of steps, where the first one is to compute the covariance matrix then the eigenvalue and eigenvectors are computed [6]. The eigenvectors with the smallest variance are removed, in the final step of PCA, the original data is transformed by matrix multiplications. However, PCA has some drawbacks such as the number of eigenvectors must be defined, also the basis vectors of PCA are not suitable for biological data analysis since they are orthogonal and the hidden patterns may not be orthogonal. In the other words, ICA is a statistical method that decomposes a multidimensional feature into statistically independent components to discover the hidden factors from a set of random variables [3], however, it is expensive computationally. The ICA and PCA methods have both positive and negative coefficients. In gene expression, these contradict physical realities [8]. To solve this problem, Lee and Seung introduced NMF that deals with nonnegative data [35]. There are several NMF methods that are presented in [11].
In all previous extraction algorithms, the original data are transformed into a lower dimensional feature space. These transformations are irreversible so the projection of the measurements is different from the original data. Therefore, we need to select relevant features without change their values to accomplish DR, so the feature selection algorithms can do this task.
Feature selection (also be called variable selection, or attribute selection) represents the process of selecting a subset of the existing features without a transformation [17]. The feature selection can be divided into two types, filter and wrapper methods. The wrapper methods [9] are often used with a learning algorithm [48, 58]. The sequential floating forward selection algorithm (SFFS) is one of the popular feature selection methods [49]. The SFFS consists of two steps, the insertion step and a deletion step, which partially avoids the stuck in local point of correct classification rate (CCR). In [16], V. Dimitrios introduced an algorithm that improved SFFS which the execution time is reduced by a preliminary statistical test that removes redundant features. The accuracy is also improved by a tentative test which choses the features that achieve a statistically significant improvement of CCR. However, the SFFS have computationally expensive so cannot apply to large data.
Filter methods are a select subset of feature without learning algorithm, it is faster than wrapper methods. There are many algorithms that use the filter such as maximize the relevancy minimizing the redundancy (MRMR) criterion based on mutual information [43, 47] which maximize the relevancy of a gene subset while minimizing the redundancy [22].
The uncertainty is one of the main problems in data analysis. The Rough set theory recently [42, 46] is used to deal with the uncertainty problem. Rough sets, is a mathematical tool to perform the DR and has many applications including data mining [4, 23] and pattern recognition [61]. Rough sets can be used to selection feature with discretized feature values [28, 45]. Also, neighborhood rough sets [25, 26] are suitable for the heterogeneous dataset. However, in real applications, there are usually real-valued data and fuzzy information and this will lead to error.
Combining fuzzy and rough sets used to work with uncertainty in the real application data [64]. Also, the fuzzy rough solving the discrete problem of the rough set. They have been applied successfully to feature selection of real-valued data set [10, 59]. In [41] a new clustering algorithm, called a fuzzy–rough supervised feature clustering (FRSAC), is proposed to determine such groups of genes. The FRSAC algorithm measure the information of sample groups or class labels similarity between genes, therefore, the redundancy is. However, a feature selection methods are higher time complexity than feature extraction methods [38]. Hence, it is difficult to choose whether the FS algorithm or feature extraction is suitable to perform the DR.
Related works
There are some algorithms can simultaneously extract and select features such as in [19], the authors presented a description an algorithm that combined PCA, ICA, and fuzzy classifier for breast cancer detection. In [56, 57] an algorithm that combined ICA/PCA with RS is proposed for feature extraction and reduction images where PCA/ICA used to feature extraction, then the rough set is used to refine the features. In [56] ICA and PCA are combined with rough set to face recognition, and in [57] for mammogram classification. Also, in [36] PCA is combined with the rough set to feature extraction of the remote sensing image. In [52] the problem of discretization in rough ICA algorithm is avoided by using Rough Fuzzy and this algorithm is introduced to web mining and to handle clustering web user sessions. However, these previous methods (ICA, PCA) suffer from some limitations such as for PCA it is not the optimal choice to deal with biological data analysis because it required the data to be orthogonal and this conditions may be not satisfied. Also, ICA is expensive computationally like NMF, since they provide only one solution at each iteration.
Therefore, the main contribution of this paper is to convert the NMF method to a nonlinear equation systems and used the multiobjective evolutionary algorithms (MOEAs) to solve this system. According to MOEAs there are several solutions (that allocated in different fronts) are obtained at each iteration.
Then according to the modified version of NMF, this paper provides an alternative feature extraction/ selection algorithm is proposed. In which, it combines a fuzzy neighborhood rough set (FRS) and NMF based on multiobjective evolutionary algorithms (MOEAs) for finding the relevant genes from microarray gene expression data. Our algorithm is simultaneously selects and extracts features from microarray data. The steps of our algorithm are a) extracting feature using NMF based MOEA, b) fuzzy similar relation computed, and c) the selection of a reduct and d) the classification of data. The effectiveness of the proposed algorithm, along with a comparison with other methods, is demonstrated on a set of real-life data.
The rest of this paper is organized as follows. We give a brief overview of the fuzzy-rough set, nonlinear equation system and nonnegative matrix factorization are introduced in Section 2. In Section 3 the proposed algorithm based NMF is introduced. Section 4 presents experimental results and statistical analysis of the proposed our algorithm. Conclusion is given in Section 5.
Preliminary
Rough set
Rough set theory is one of the recent mathematical approaches to imprecision and uncertainty. In an Information System (IS), the data can be represented as a table and each object, i.e. row in the table, is represented by some information or features which are represented by columns. Mathematically, an information system is denoted by I = (U, A, V, f), where U is a non-empty finite set of objects, i.e. the universe, A represents a non-empty finite set of features or attributes, V is the union of features domain as follows, V = ∪ a∈A V a , and f a : U → V a , where V a is the set of values of feature a [46].
A decision system has the same structure of data, but each object has its own decision or class label (i.e. A = C ∪ d where C is the condition features and d represents a decision feature).
Each non-empty subset P ⊂ A determines an equivalence relation as follows:
The partition of U that is generated by P is denoted by U/P and given by
The lower approximation
Let P, Q ⊆ A be an equivalent relation over U, the positive, negative region of the relation U/Q with respect to P (given by β
P
(Q)) is defined as:
Where β P (Q) represents the set of all objects of U that can be uniquely classified to blocks or classes of U/Q by means of P.
The dependency between attributes is an important task of data analysis. Given P, Q ⊆ A, and all features from P are determined by the features from Q. If there is a relation between P and Q, then P depends totally on Q (IND (P) ⊆ IND (Q)) is denoted by Q → P. In other words, the partition that is generated by P is better than the partition generated by Q. The degree of dependency γ (Q) is denoted by
The fuzzy-rough set model has been proposed to deal with the real-world applications usually contain real-valued features. The fuzzy rough sets are used to solve the drawbacks of rough sets in real applications, as we know, Pawlak’s rough set model can only deal with data sets with discrete values [46]. Following [38], given a non-empty finite set X, R is a binary relation defined on X, denoted by a relation matrix M (R) [31]:
Where r ij ∈ [0, 1] is the relation value of x i and x j .
The fuzzy partition of the universe U, generated by a fuzzy equivalence relation R, is defined as:
Where [x
i
]
R
is the fuzzy equivalence class generated by x
i
and R. The fuzzy equivalence relation, U/R is a fuzzy partition and then [x
i
]
R
is a fuzzy set defined as:
The R is a fuzzy equivalence relation on the universe U; the lower and upper approximations of X can be defined as:
The nonlinear equation systems (NESs) has more attention in many fields such as physics [24], chemical processes [44], engineered materials [21] and robotics [12]. The NES can be stated as follows:
Where
However, the complexity of CA is high since it is considered that the number of equations in NES are the number of objective functions to be solved.
Complexity of MOEA to solve the transformed problem by CA is high since the number of objectives is equal to the number of equations in NES. In [63] an algorithm called multiobjective optimization for NESs (MONES) is presented. In this algorithm, the NES is transformed into a bi-objective optimization problem through two parts: 1) the first is define the location function as:
Where
2) The second part is the system function which has the following form:
Then these two parts are combined together as in Equation (9) which represents the bi-objective optimization problem [63]:
The transformed problem is solved by the most popular algorithm of MOEAs called non-dominated sorting genetic algorithm II (NSGA-II) [14].
The first step in NSGA-II is to generate random populations P of size N. Then compute the fitness values for each individual in P. The NSGA-II selects randomly a two individuals, x and y by using the binary tournament selection techniques. Then the parent is determined by selecting the individual which has the best nondomination fitness and this parent is added to a mating pool (which represent N/2). For example, the individual x is considered as parent if (f (x) < f (y)), however, if (f (x) = f (y)) then select the individual which resides in the less crowded region (The details of the crowding distance calculation refer to [13].
To construct the offsprings Q
G
, (The new individuals in the feasible space of solutions), the polynomial mutation operators and crossover are used to select parents. Here the polynomial mutation is used the polynomial probability distribution. The offsprings created are given as:
Where the parameter
The η m ∈ R+ is mutation constant and r i ∈ [0, 1] is a random number.
Nonnegative matrix factorization purpose to decompose a nonnegative matrix
A general algorithm used to decomposition the above loss function based on multiplicative update, defined as [35]:
Also, there are many algorithms to solve NMF problem such as projection gradient, Newton and others in [11]. However, all the previous approach suffer from some drawbacks such as they are dependent on the initial solution, easily stuck in a locally optimal solution, and needed gradient information. Also, the aim of these algorithms is to find only one optimal solution at each. Therefore, to find optimal solutions in a single run the MOEA is used [13, 14].
The proposed Fuzzy Neighborhood Rough MONMF method (which called FNRMONMF) is illustrated in Algorithm 1 and Fig. 1. This method is successfully applied to extracting the features by using NMF and then applying the upper and lower approximations to find the reduct set of features. The FNRMONMF method is consists of three stages 1) feature extraction 2) feature selection 3) classification.
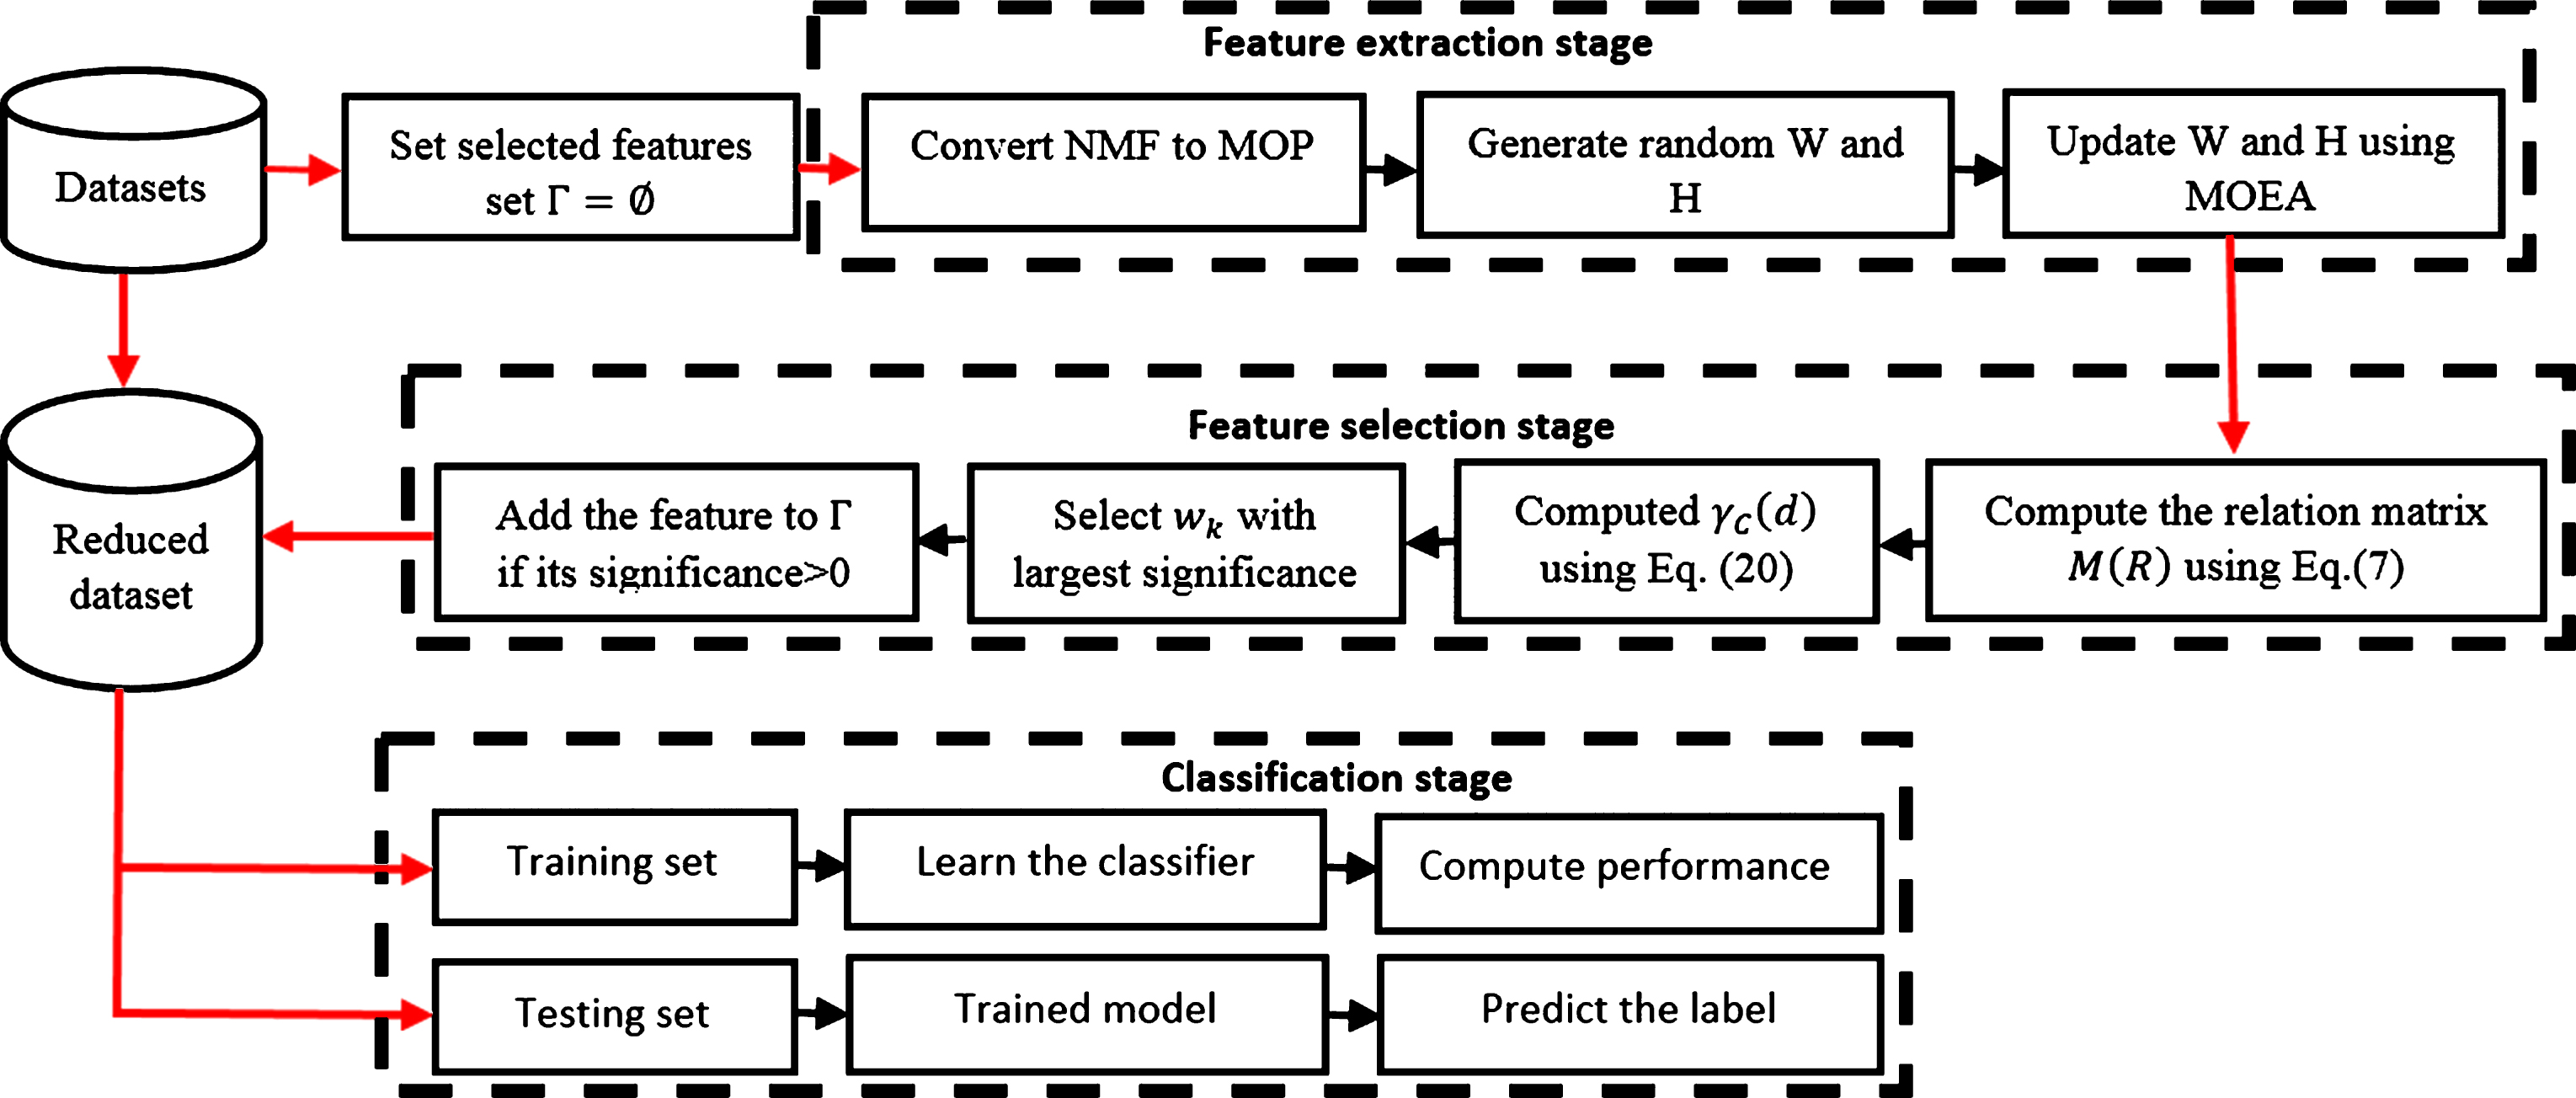
The framework of the proposed FRMONMF Algorithm.
However, before any stage, the method starts by initial value to the set of selected features (i.e. Γ =∅).
The next step in the proposed method is to extract the features from the data
Then the MOEANMF algorithm (as in Algorithm 2) starts to decompose
The next step is to generate a two random matrices
The next step in FNRMONMF is to select the best subset of features from
Then the feature w k of the largest significance is selected. Finally, if the significance of w k is greater than zero, then it added to Γ, otherwise return Γ.
In order to assess the performance of the selected features, the dataset is classified by using either KNN or SVM classifiers. These two classifiers are used in several literatures and provide better results as in [65–67]. However, before using classifier the dataset is divided into two sets by using fivefold cross-validation (CV) method. In which this method works by splitting the dataset into 5 groups and select 4 groups as training set and one group as testing set, then repeat this process 5 time until all groups become testing. The output of this process is the average of classification accuracy overall 5 runs.
To evaluate the accuracy of FRNMONMF algorithm for classification a high-dimensional biological data that given in Table 1, it is compared with nine algorithms. These algorithms namely, ICA [18], PCA [32], RS [46]), FRS [39], neighborhood RS (NRS) [25], Fuzzy-Rough ICA (FRICA) [52], Multi-Cluster/Class Feature Selection (MFCS) [15], Entropy NMF (ENMF) [64] and Fuzzy-Rough neighborhood NMF (FRNNMF).
The description of datasets
The description of datasets
The dataset is divided into training and testing set by using the fivefold cross-validation (CV) method. Also, two classifiers namely, K-Nearest Neighbor (KNN) and Support Vector Machine (SVM) are used since they provides a good results in several literatures [65, 66]. The experiments are implemented using Matlab 2014b which setup on Windows 7 (64-bit) that runs on “CPU Core2 Duo with 4GB ram". For statistical analysis, all the comparative algorithms are run 30 times.
Figs. 1 and 2 (also, Tables 2–3) show the averages of performance overall datasets using SVM and KNN respectively. From these results we can observed that, the ICA has the less accuracy overall the datasets. Whereas, the MFCS has performance better than ICA overall the used datasets (expect on Colon cancer and Brain tumor). The RS, FRS and NRS are have nearly the same accuracy for all the used datasets. Also, we can concluded that, in general, the FRNMONMF algorithm has better performance than FRNNMF algorithm (expect on Colon Cancer and 9 Tumors).

The average of classification accuracy for each algorithm overall datasets using SVM.

The average of classification accuracy for each algorithm overall datasets using KNN.
The average of classification accuracy of the algorithms using SVM along each dataset
The average of classification accuracy of the algorithms using KNN along each dataset
In this section, in order to make further statistical analyses, the non-parametric Wilcoxon rank sum test is used [67]. This test is used to determine if there exists a significance difference between the median of control group (the proposed algorithm) and other groups (algorithms) or not at level of significance equal 5%. In which the null hypothesis assumes that there is no a significance difference between the proposed algorithm and the other algorithms.
The time required by each algorithm to select the features
The time required by each algorithm to select the features
The results of Wilcoxon rank sum test
Table 5 shows the results of Wilcoxon rank sum test, in which from this table it can be seen that there exists a significance difference between the FRNMONMF algorithm and the other algorithms except the FRNNMF algorithm. Also, there is no a significance difference with ENMF along Leukemia dataset, also, when the SVM is used to classify ALLAML, Colon and 9 Tumors, and for CNS dataset when KNN is used. For PCA and FRICA algorithms there is no significance difference only over Colon dataset with SVM. Moreover, the results of the proposed algorithm not significant difference with RS and NRS in Leukemia (with SVM) and 9 Tumors (with KNN). As well as, by comparing FRS with the FRNMONMF only the 9 Tumors dataset with KNN not significant difference.
Moreover, from all previous results it can be observed that the FRNMONMF is the better algorithm which improves the classification accuracy of the microarray datasets that contain a large number of genes. However, there is no significance difference with only FRNNMF algorithm overall dataset but the proposed algorithm still gives results better than FRNNMF with small difference.
The good performance proposed FRNMONMF method is results from the two facts: 1) the fuzzy neighborhood rough set that determine the degree of dependency of the features in label (target) feature. 2) In the proposed method, the NMF is converted into a biobjective optimization problem and used MOEA algorithm to determine the optimal solutions. This way is different from solving the NMF through multiplication rule that, can getting in stuck and, provides only one solution at each iteration (for
The dimension reduction is a necessary preprocessing for microarray data, because this data contains a lot of irrelevant/redundant genes (features). The Fuzzy-Rough set is one of popular feature selection methods, which not needed to discretize the dataset, unlike the classical rough set. However, the Fuzzy-rough algorithms suffer from a large computation time and, therefore not it is a suitable optimal method for dealing with big data. The feature extraction methods such as PCA and ICA can be used as dimension reduction but it changes the meaning of original data, also it contains negative values. In this paper, we combine the perfect feature extractions methods called NMF and fuzzy-rough sets to improve classification performance. NMF is the algorithm attempts to maximize the similarity among extracted features. The main drawbacks of the NMF are determining the number of clusters to reduce this dependency the fuzzy-rough sets are used. Also, the MOEA algorithm is used with NMF to find multiple optimal solutions and this not performed in other NMF algorithms that aim to find just one optimal solution at each run. The results on seven microarray data show that the proposed algorithm is effective, where the irrelevant features can be removed without decreasing classification performances.