
Abstract
Existing fuzzy KANO model has the defect that respondents should judge tendency on satisfaction degree at all levels. A KANO quality attribute classification method based on trapezoidal fuzzy number similarity measures is established, which is applied in practice of quality attribute classification of mobile classrooms. Fuzzy questionnaire is not adopted for investigation in the method. Fuzzy treatment is implemented on questionnaire data in the calculation process only. The questionnaire filling difficulty is reduced greatly, thereby it is more operational.
Literature review
KANO model is a user demand classification tool proposed by NoriAki KANO- a Japanese scholar. The quality of products is distinguished through two dimensions of user subjective evaluation and product objective quality in the model [9]. The relationship between product quality and user satisfaction degree is solved. The quality elements in KANO model includes five categories- attractive quality, must-be quality, one-dimensional quality, indifferent quality and reverse quality (shown in Fig. 1). The contents of functions are shown as follows:
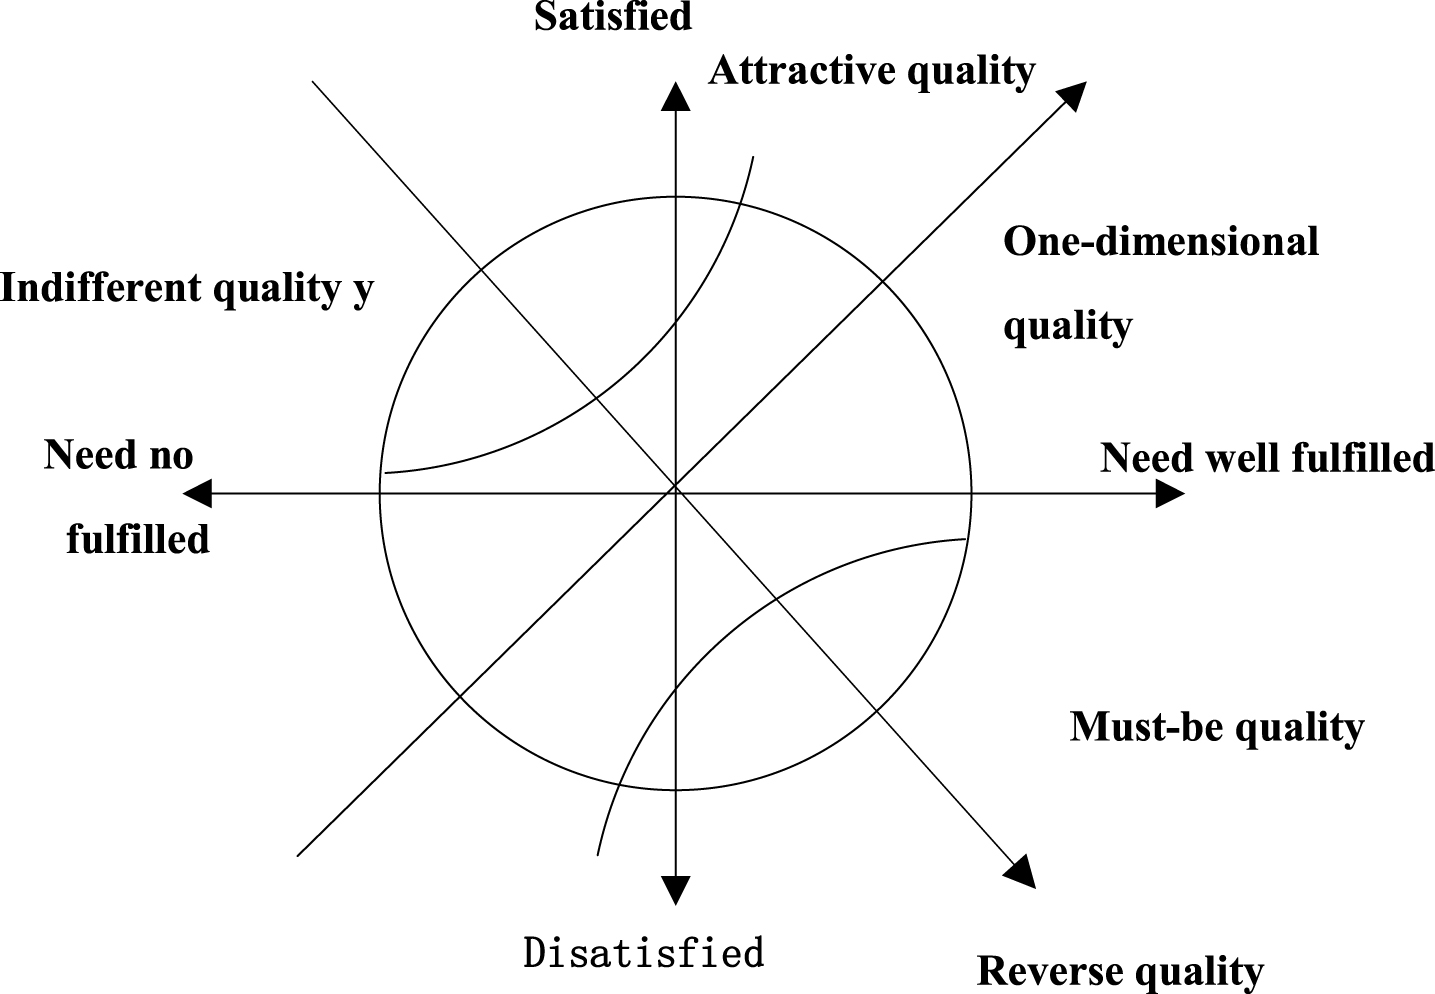
Shows the relation of user needs (X axis) And user satisfaction (Y axis) of five qualities.
Attractive quality: it refers to quality which can bring surprise to users. User dissatisfaction can not be caused if the quality is not satisfied. However, the quality will improve user satisfaction greatly.
Must-be quality: it is deserved quality of products. The product is satisfied when the quality is satisfied fully. User dissatisfaction can not be caused if the quality can not be satisfied fully.
One-dimensional quality: it is also known as expected quality, which has a linear relation with user satisfaction. It belongs to a quality feature with the fiercest competition among enterprises.
Indifferent quality: users don’t care about quality, and its satisfaction does not affect user experience.
Reverse quality: user dissatisfaction can be caused if the product has the quality.
Purchase cost and purchase motive of users can be considered at the same time in KANO model as a method for analyzing related demands of users. User participation is emphasized. It has the advantage that the nonlinear relationship between products or service performance and user satisfaction can be expressed effectively. The model is applied widely in the fields of quality management, product design, service innovation, large-scale customization production and other fields [3, 20].
Berger [1] proposed to improve KANO model through increasing Better coefficient and eliminating Worse coefficient in order to make up for the defect that quality attribute classification is too subjective in traditional KANO model, and. It is regarded as the basis of quality element classification. The improved KANO model with Better- Worse coefficient solves the problem of application limitation of original KANO model to certain extent. It has become a universal method of applying KANO model at present.
Matzler & Hinterhuber [12] introduced “Better- Worse coefficient” of Berger to the application process of QFD (Quality Function Deployment). The research results show that: the demand of users in must-be quality must be satisfied firstly aiming at product development. Meanwhile, product development is competitive in one-dimensional quality, which is better than competitors in attractive quality. Tontini [18] introduced the concept of ‘adjustment factor’ on the basis of research by Berger. Greater weight is given to factors of producing user satisfaction. The research results are applied in development practice of new products; Yang [21] increased the concept of importance in KANO model on the basis of user relative satisfaction coefficient proposed by Berger. The quality elements of KANO model are increased from five original categories to eight categories accordingly. Namely, must-be quality, attractive quality, one-dimensional quality and indifferent quality are further divided into two branch categories according to importance respectively. Meanwhile, elements of reverse quality are eliminated. Li-ming and Huan [4] utilizes wider scoring grades to indicate the difference of strong correlation and weak strong correlation between user demands and engineering characteristics more clearly aiming at the defects thereof on the basis of summarizing integration methods of Matzler and Hinterhuber. Weighted statistical test method is applied to deal with the condition of similar weight of two user demands.
Chen et al. [2] improved the method of judging quality element evaluation tendency in KANO model. The method can eliminate the defects of judging evaluation tendency difficulty on the basis of time characteristics and statistical probability characteristics of quality elements. In addition, the indicator of measuring quality element evaluation tendency- the degree of tendency in the evaluation of quality elements is derived through the properties of the Strongest Superior Degree in three aspects of internal, external and sample size influence. Jie et al. [10], etc. constructed I-KANO model, and they proposed I-KANO model aiming at decision for improving user satisfaction. KANO indicators are proposed, which are combined with user satisfaction for quantitative analysis. Priority index is introduced as a decision factor for screening satisfaction improvement indicator.
Jip et al. [8] utilized function equation for describing the relationship between demand implementation degree and user satisfaction according to satisfaction coefficient and dissatisfaction coefficient of some element in the KANO model. Geng et al. [6] utilized satisfaction coefficient and dissatisfaction coefficient in KANO model for optimizing product design plan through analyzing functional demands. The function relationship between functional demand and user satisfaction can be established according to KANO model, thereby establishing more precise and rational user satisfaction objective function. Functional demands are optimized accordingly. Meng Qing-liang et al. [13] combined grey system theory and KANO model to propose dynamic prediction method of KANO quality elements based on GM(1,1) model aiming at the problem in existing research that classification results of KANO model quality elements are lack of dynamic prediction research.
KANO model is improved aims at the qualitative defect of the quality element classification process mainly in the above literature. User satisfaction is measured more precisely in the methods through quantitative measurement mode. However, they have common problem that the complex fuzzy psychological state of users on product satisfaction awareness is ignored. Therefore, some scholars try to introduce fuzzy theory into KANO model for measuring satisfaction awareness of user fuzziness.
Qing-liang et al. and Wen et al. [14, 16] introduced fuzzy correlation theory into KANO model and proposed service element classification method based on fuzzy KANO model. Fuzzy KANO questionnaire is designed, and users are allowed to select many answers according to own psychological feelings according to characteristics of user thought fuzziness. Any value of [0,1] is endowed for option score. The original questionnaire based on precise value judgment (shown in Table 2) is transformed into fuzzy value judgment (shown in Table 3). The results of questionnaire are utilized for dividing product quality factors, and specific steps are shown as follows [14, 16]: Construction of fuzzy matrix: fuzzy KANO questionnaire (shown in Table 3) is adopted as an example. It is supposed that the generated interaction evaluation matrix is shown as follows if the element function matrix and element no function matrix, X = [0.3 0.6 0.1 0 0] , Y = [0 0 0 0.2 0.8]
Element values in the matrix S and quality attributes of KANO model quality element classification table (Table 1) are combined for obtaining quality attribute membership vector Results of the previous steps show that the same quality element is displayed as many quality attributes at the same time generally, therefore, confidence level α ∈ [0, 1] is introduced for further screening. α is taken. The quality attribute corresponding to the element can be expressed as 1 if one element in the membership vector is greater than or equal to α further screening. Otherwise, it is expressed as 0. The quality membership vector is T = [1 0 0 0 0], and it belongs to must-be quality if α = 0.4 Difference values of α have greater influence on the classification results. Information is crossed if the value is lower, which can not reach the purpose of testing results precisely. Data are lost and information is distorted if the value is higher. The above steps are repeated to calculate attribute classification of each quality element. The appearance frequency of each attribute is recorded. The attribute categories with the highest accumulated frequency are taken. If the accumulated frequency of some attributes is the same, they can be sequenced according to the priority of quality attribute categories. The high-to-low order is must-be quality, one-dimensional quality, attractive quality, indifferent quality and reverse quality.
Appraisal table of KANO demand classification
Example of traditional KANO model questionnaire survey
Example of existing fuzzy KANO model questionnaire survey
Fuzzy questionnaire mode is applied to measure user satisfaction with products for reflecting imprecise characteristics in people satisfaction awareness in Literature [14, 16]. However, respondents should judge the tendency of satisfaction at all levels during questionnaire collection in the method. For example, it is judged that ‘satisfactory’ tendency is 0.3, and ‘more satisfactory’ tendency is 0.6. The judgment difficulty of respondents is increased obviously in the mode of judging satisfaction tendency by the respondents themselves.
User judgment on product satisfaction belongs to an inexact fuzzy judgment itself, namely ‘more satisfactory’, ‘indifferent’ and other judgment intensions are also included during ‘satisfactory’ judgment. The respondents fill questionnaire expressed with precise values. However, the boundary judgment among all satisfaction degrees in the internal cognition still belongs to a fuzzy state. In the paper, KANO quality attribute classification method based on trapezoidal fuzzy number is proposed accordingly.
A trapezoidal fuzzy numbers A = (a1, a2, a3, a4 ; w A ) is called a linguistic value trapezoidal fuzzy number if there are if there are 0 ≤ w A ≤ 1, 0 ≤ a1 ≤ a2 ≤ a3 ≤ a4 ≤ 1.
The algebraic operators given in Literature [19] are as follows: Supposing the language values of two trapezoidal fuzzy numbers are:
Supposing the language values of two trapezoidal fuzzy numbers are:
The sum ⊕ of language values of two trapezoidal fuzzy numbers is:
The product ⊗ of language values of two trapezoidal fuzzy numbers is:
The quotient ø of language values of two trapezoidal fuzzy numbers is:
Prof Wei proposed Calculation of degree similarity S (A, B) of and is defined in Literature [19] as follow:
Fuzzification of product satisfaction judgment
Four grades of ‘very satisfactory’, ‘more satisfactory’, ‘very dissatisfactory’ and ‘more dissatisfactory’ are increased on the basis of five grades of satisfaction judgment in original KANO model in order to better reflect the fuzziness in the judgment process of people. Corresponding quality attributes are shown in Table 4.
KANO demand classification by judgment of satisfaction at 9 grades
KANO demand classification by judgment of satisfaction at 9 grades
Satisfaction judgment grades correspond to trapezoidal fuzzy numbers at 9 grades, which correspond to statements of trapezoidal fuzzy numbers given in Literature [19] as shown in Table 5. Then, the precise judgment values are converted into trapezoidal fuzzy numbers according to the judgment of respondents to product satisfaction degree in the questionnaire. For example, ‘very dissatisfactory’ corresponds to language value of trapezoidal fuzzy number, namely (0, 0, 0, 0; 1.0).
Language value of different degrees of 9 trapezoidal fuzzy numbers
The results after fuzzification of judgment values by respondents are counted on the basis of questionnaire. Formula (5) is used for calculating the satisfaction of all indicators.
Wherein,
Formula (4) is utilized for calculating the similarity between
Application examples
The mobile Internet era for ‘satisfying individual needs anytime and anywhere’ is coming with the development of mobile data network and popularization of mobile devices. Remote learning through mobile APP has become a learning mode recognized by people gradually since it has the advantages of portability, intelligence, good interaction experience and no limitation from time and space. The quality of education APP has been more than 70000 in China in 2014. They are only following to the quantity of game APP in APP Store. Mobile education market scale has been up to 1.43 billion Yuan in China and user scale reached 249 million in 2015. China Internet giants introduced Baidu Lecture, Taobao Education and Tencent Classroom respectively. Online education APP market tends to be saturated gradually. Rich mobile classroom APP resources provides users with sufficient selection space. Therefore, how to design APP functions according to user demand and improve user loyalty to products are key issues for operators to obtain advantages in fierce market competition. Therefore, the quality element of rich mobile classroom APP is regarded as research object in the paper. The research process is shown as follows:
Acquisition of quality factors
Park et al. [7] put forward a quantitative model for integrating user experience elements of most mobile devices into simple indicators. The model has been qualified in test and inspection of a commercial case study on tablet computers. Senior APP product managers are organized for collective interview on the basis of literature [7], and quality elements of mobile classroom APP are determined as shown in Table 6 finally.
Quality elements of mobile classroom APP
Quality elements of mobile classroom APP
This survey was made in a way of network issuing questionnaires, and a professional questionnaire survey website— Questionnaire Star was employed. 132 questionnaires were collected totally. Through analysis and sort-out of valid questionnaire data, the respondents’ demographic information in this survey is shown in Table 7.
Respondents’ demographic information
Respondents’ demographic information
The young and highly educated people are primary user of mobile classroom APP as we usually know.
The trapezoidal fuzzy value of satisfaction is calculated by questionnaire and formula (5). The degree similarity between fuzzy value of satisfaction and judgment of satisfaction is calculated by formula (4). The KANO demand classification of quality elements are calculated by Table 4 and the maximum of degree similarity (shown in Table 8).
The maximum of degree similarity and KANO demand classification
The maximum of degree similarity and KANO demand classification
In the paper, a KANO quality attribute classification method based on trapezoidal fuzzy number similarity measures is established, which is applied in practice of quality attribute classification of mobile classrooms. Research results show that consumption motives and uncertain physiological state of users are considered fully in the process of obtaining user demand on product quality according to the method, and the method is more practical. Fuzzification treatment is implemented on questionnaire data in the calculation process only, it is not necessary to judge satisfaction tendency at all grades by respondents themselves according to the method proposed in the paper, thereby lowering questionnaire filling difficulty greatly, and the method is more operational.
The research achievements in the paper has important significance for perfecting related theory of KANO model, enhancing its decision support functions in management practice. However, empirical research of the paper is used for quality attribute classification of mobile classroom APP only, and the applicability of the theory and method proposed by the paper in other industries still should be further explored and validated.