
Abstract
Planetary gearbox (PG), especially multi-stage PG, is widely used in various commercial and military applications. A dynamic model of PG is a valuable way to investigate its vibration behaviors in good and faulty statuses for designing a highly reliable PG and corresponding robust monitoring techniques. In this paper, a modified dynamic model is firstly constructed for a two-stage PG with a varying crack. The modifications include the crack propagation path settings as well as the coupled structure of flexible and rigid gear components, which makes a balance between the model accuracy and computational burden. Secondly, using this model, its vibration responses from a healthy PG and faulty PGs with different cracks are collected for the analyses of its frequency components and statistic features. Experiments are also conducted on a two-stage PG in similar conditions. Both results in simulations and experiments demonstrate the usefulness of the presented dynamic model. Moreover, sidebands and some statistic features are verified to be useful tools to monitor and evaluate the healthy status of PG.
Introduction
Topics on fault diagnosis [1, 2], predictive maintenance [3, 4], and reliability analysis [5] of large-scale machinery in industry have attracted intensive investigation and research, all of which is based on the processing and analysis of dynamic responses. A planetary gearbox (PG), as a key component in most mechanical transmission systems, is widely employed in wind turbines, defense and maritime, aerospace, and industry applications. Any gear damage may lead to vibrations, noise, undesirable dynamic behaviors, and even a failure of the planetary gearbox, which may cause unscheduled downtime, production losses, and safety concerns. It has been proven that its vibration may influence the reliability and durability of the PG, and thus vibrations are one of key concerns for the PG [6, 7].
Most published work on PG vibrations focused on dynamic modeling as well as the study of natural frequencies and response analyses. Ambarisha and Parker [8] compared dynamic behavior of spur planetary gears using a lumped-parameter model and a finite element model, the latter of which shows a rich spectrum of PG dynamics. Parra and Vicuña [9] used a phenomenological model and a lumped-parameter model to compare frequency contents of vibrations for healthy and faulty planetary gearboxes. Hussain [10] proposed a fuzzy rule-based inference system to simulate the human reasoning for PG diagnosis. Lei et al. [11] summarized the publications on the modeling, signal processing, intelligent diagnosis, and other hot topics in the field of condition monitoring and fault diagnosis of PG. Liang et al. [12] made a summary on the dynamics based gearbox fault modeling, detection and diagnosis. Ma et al. [13] focused on the reviews of crack propagation prediction and calculations of time-varying mesh stiffness and vibration response.
For PG dynamic modeling, lumped-parameter models and finite element models are two commonly used modeling methods. One of assumptions in the former models is that each gear body is assumed to be rigid, which leads to the problem of low fidelity. In recent research, the consideration of having partially deformable gear components was introduced to keep a balance between computation burden and simulation accuracy. Abousleiman and Velex [14] developed a hybrid 3D finite element/lumped parameter model to analyze the quasi-static and dynamic properties of planetary gear sets, where the effect of a flexible ring gear was taken into account. Wu and Parker [15] investigated distinctive modal properties of equally-spaced planetary gear sets including an elastic ring gear and other rigid components. Chen et al. [16] developed an analytical model having a tooth root crack and a flexible ring gear to better simulate the dynamic responses of the PG.
Besides modeling methods, another concern is how to simulate the PG damages as real as possible. The tooth fatigue crack is one of the most common damages in the PG. These cracks occur more frequently on the sun gear teeth owing to excessive stress. Such a failure is not unchanged, but progressive, which makes the simulation difficult. Chaari et al. [17] analyzed the effects of manufacturing errors on the dynamic behavior of a PG. Chen and Shao [18] made an assumption that the crack propagates in the directions of the tooth width and crack depth, like a parabola and a straight line, respectively. They [19] also pointed out that the modification on the tooth profile need to be involved during the modeling of the gear tooth crack. Yu et al. [20] considered spatial cracks that propagate in three directions, i.e. the directions of crack depth, tooth width and tooth profile, either individually or simultaneously. Using the finite element method (FEM), Ma et al. [21] compared the mesh stiffness and vibration responses when setting various crack propagation paths through the rim. Ghaffari et al. [22] proposed a mixed-model fatigue crack propagation model to further consider friction effects on the fatigue crack initiation life and partial contact loading conditions. Chen et al. [23] newly calculated the tooth fillet foundation stiffness when the crack exists and gear tooth flexible deflection along line of action is increased accordingly.
However, the research focus is mainly made on single-stage planetary gear set while researches on more complicated multi-stage planetary gearboxes are few. Zhang et al. [24] presented a translational– rotational dynamic model of a two-stage closed-form planetary gear set and revealed the mode types in the vibration responses. Wei et al. [25] presented the coupling vibration analysis method for the healthy multi-stage planetary gear system to make a compromise between the accuracy of the lumped parameter method and the computation burden of the FEM.
Although the above models provide valuable suggestions on monitoring and analysis of the PG, the simulation accuracy of a faulty multi-stage PG is still limited by assumptions and simplifications during the modeling, and needs to be further improved. In this paper, a dynamic model is designed for a two-stage PG with a varying crack and more realistic settings are also made for the crack propagation and gear body. Firstly, the straight crack paths are replaced by parabolic ones to simulate a real crack propagating along the tooth width and crack depth simultaneously. Furthermore, flexible gear components in PG are set to take the deformation of the faulty gear into consideration. The aim of this research is to further investigate vibration behaviors of a healthy PG as well as the PG in the presence of various gear cracks, especially for a multi-stage PG.
The rest of this paper is organized as follows. Section 2 presents an improved dynamic model for a two-stage PG and introduces its modifications on the modeling, including a flexible sun gear with a crack on its root and a flexible planet carrier in the first stage. Using this model, Section 3 analyzes the frequency components under different states. After that, their statistic based features are analyzed for evaluating the health status of the PG. Section 4 presents some experimental results. Finally, conclusions are drawn in Section 5.
Dynamic modeling for a two-stage planetary gearbox with a tooth crack
An elementary planetary gear set has a non-rotating ring gear, a sun gear that rotates around its own center, and some planet gears that also rotates their own centers, meanwhile, revolves around the center of the sun gear. During their working, they would mesh with the sun gear and the ring gear simultaneously. In this paper, the planetary gearbox to be modeled has two stages, and the first and the second stages has three and four planet gears, respectively.
As mentioned above, the damage, for example, a crack, would be a threat to normal operations of the transmission system. This section would present an improved dynamic model for this PG with/without a crack, which would be used for vibration generation and feature analysis in the next section.
Setting for tooth cracks
Usually, the crack is not fixed, but starts from some local position where the stress concentration has and then gradually grows along a path that has close relationship with its initial crack location [26]. The results in Ref. [27] indicated that cracks do not initiate at the theoretical region and may start at any point of the tooth root. Belsak and Flasker [28] concluded that gear crack propagation paths were, in most cases, rather straight with only a slight curvature. Early works on PG modeling simulated the crack as a straight line along the crack depth and throughout the tooth width. Actually, the crack does not always extend throughout the tooth width but gradually grow along the tooth width. Meanwhile, the simplification of a straight crack leads to the problem that the accuracy in simulating faults is not high enough. Cui et al. [29] compared the responses caused by crack paths of a straight line and a parabola and stated that the latter is correct to simulate a crack. Pandya et al. [30] revealed the effects of the backup radio and pressure angle on the crack propagation path. Based on these results, the tooth crack in this paper is set on the tooth root of the sun gear in the first stage of the gearbox. To analyze the effects of different levels of the crack, the crack is simulated from its initial position and then propagates along both the tooth width and depth simultaneously, as shown in Fig. 1. For the modeled sun gear, its specification is: the tooth number is 20, the module is 1 mm, the tooth width is 10 mm, the contact ratio is 1.635, and the pressure angle is 20°.
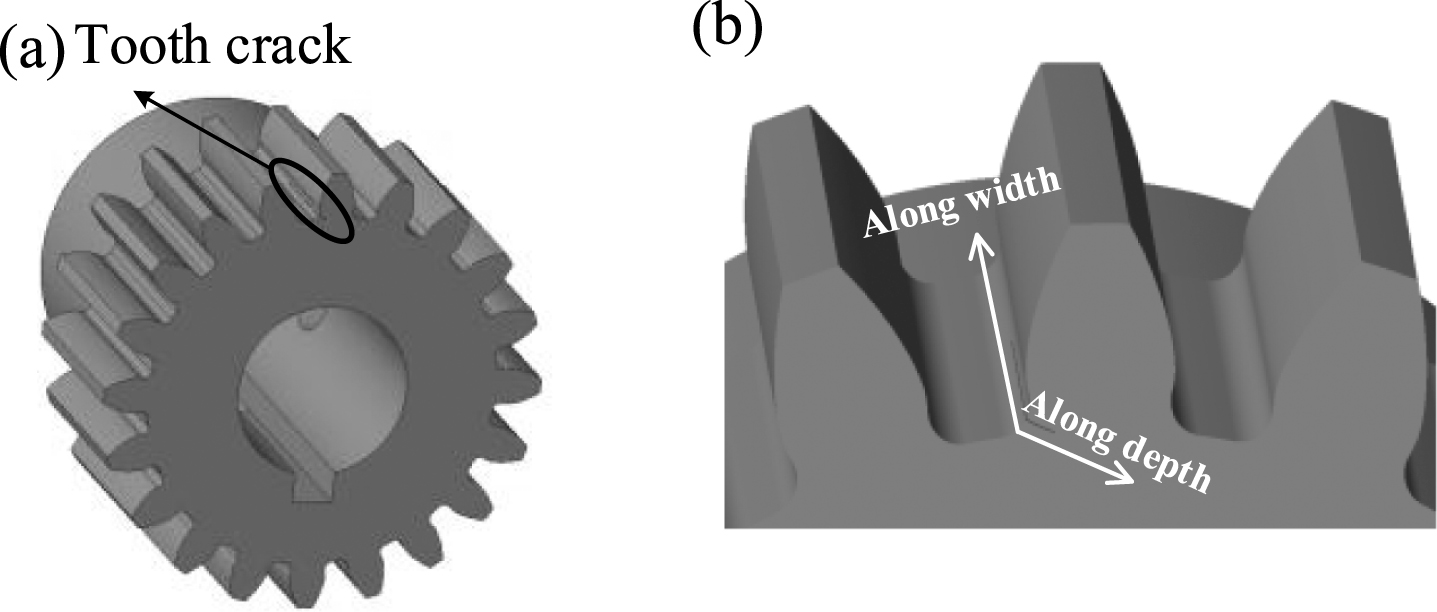
A simulated crack on one tooth of the sun gear.
Refer to Refs. [18, 31], the crack begins at the root circle. Assume that its initial position is marked as Q shown in Fig. 2(a). The crack grows along two directions. First, along the crack depth, its propagation path is simulated by a parabola. To control the curvature of the path, two angles are set. The intersection angle of the tangent line and the gear tooth centerline is β, and the point P is the vertex of the parabola representing the crack propagation path along the crack depth. The intersection angle between line PQ and the tooth centerline is marked as ν. Their values in the simulation are set to 30° and 75°, respectively. The crack starts from the point Q and grows along the curve
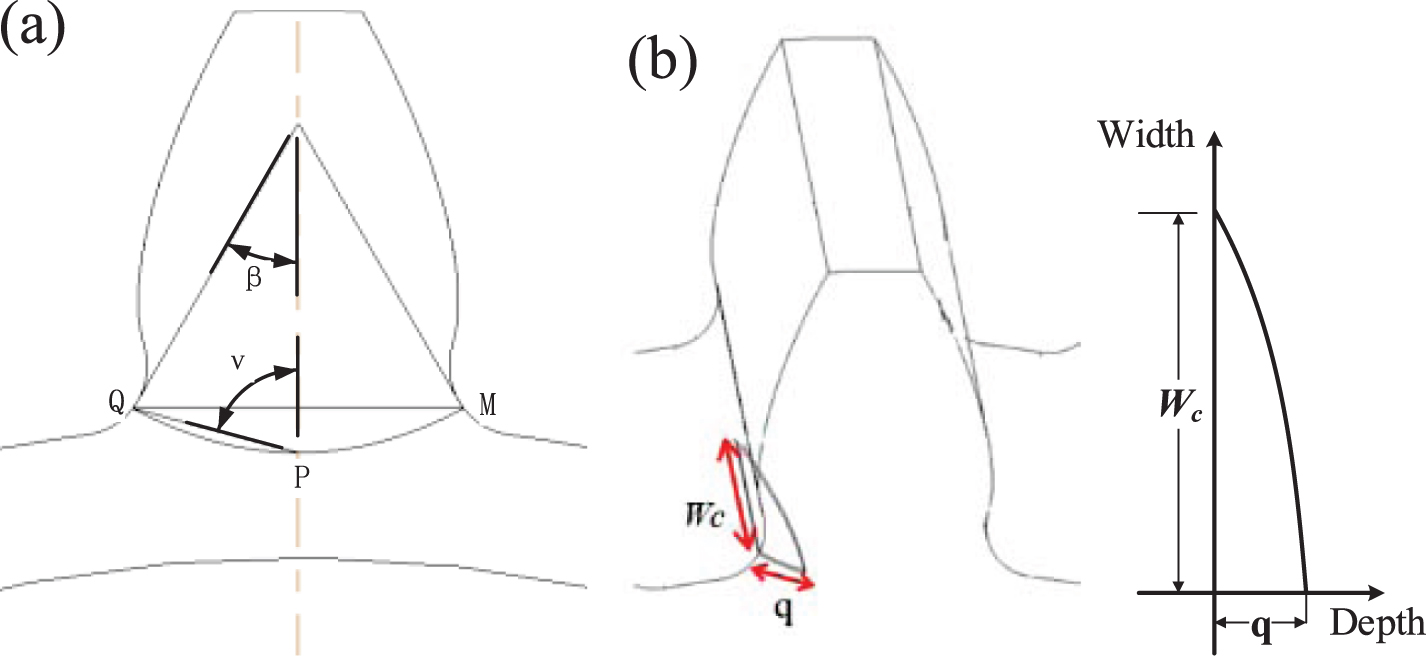
Crack settings along the tooth width and the crack depth on the sun gear.
To analyze the effects of different cracks, crack levels are individually set. In the direction of the crack depth, four crack levels are set and their levels of severity are compared with the maximum crack depth, i.e. 20%, 50%, and 80% of the whole crack depth. In another direction, i.e. the tooth width, five levels, including 2.5 mm, 5 mm, 7.5 mm, 10 mm, and throughout tooth width, are separately set. During the simulation, the crack grows on these two paths simultaneously and its corresponding vibrations are used for analyzing responses of PG.
As mentioned above, the assumption that each body in any stage is rigid limits the application of the lumped-parameter model, while the finite element method is limited by its high computational cost. However, the consideration of the elastic deformation of gear components can make the dynamic responses more close to real cases. In order to model the PG reliably and efficiently and well understand the coupling vibration mechanism in the multi-stage planetary gear system, an improved rigid-flexible coupled model is presented in this paper. In this model, only the sun gear and the planet carrier in the first stage are processed as flexible bodies by using the software ANSYS because of main components bearing damage and/or strains. The other gear components are still set to be rigid. Such a setting is to make a balance between the modeling accuracy and computational cost for a complex PG. The flexible bodies, the sun gear and the planetary carrier, are individually obtained by generating model neutral file (MNF) and completed by four steps: 1) define the material properties and element types; 2) generate mesh; 3) create rigid regions and interface points that are joint points between the rigid body and the flexible body in ANSYS; and 4) import to the software ADAMS.
Generally, the more models the MNF file includes, the more accurate the computation is. Its cost is the increment of the computation time. In this study, the first 20 order models are selected to export and meet the requirement of precision. Based on the above work, a coupled dynamic model for the two-stage PG is ready for simulation, and its virtual prototype is then obtained to generate dynamic responses of the planetary gearbox with and without cracks.
A virtual prototype model using ADAMS
To obtain vibration responses of the simulated PG with a varying crack, a virtual prototype model is established by using the software ADAMS. The PG components, rigid ones and flexible ones are separately imported to the software ADAMS, in which the latter was generated by using the software ANSYS. During modeling, the HASTIFF solver and integrator SI2 are chosen to ensure the computational accuracy and avoid excessive impacts. The virtual prototype model is shown in Fig. 3.
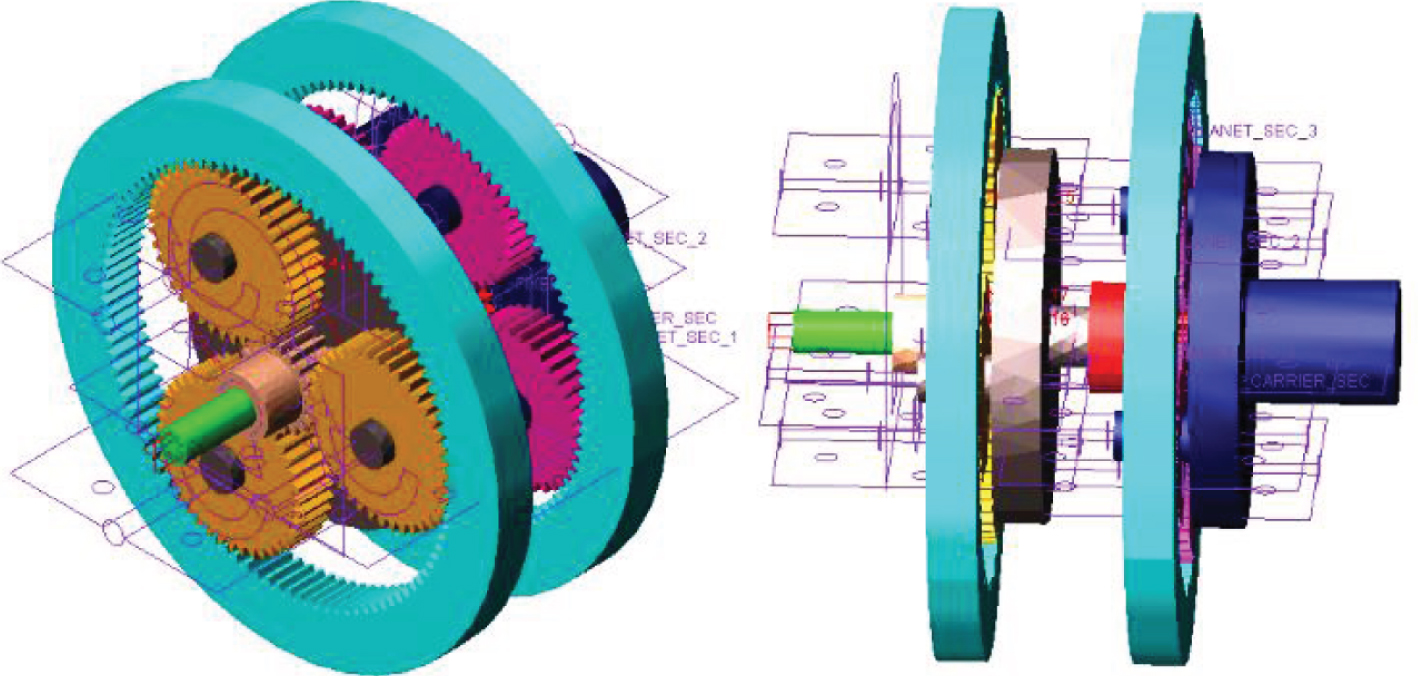
The constructed dynamic model for a two-stage planetary gearbox.
Previous research with simulations and experiments indicate that vibrations provide valuable diagnostic information and a useful way to investigate its internal dynamic behaviors. It is usually modeled as a cyclo-stationary signal with a fundamental frequency that equals to the gear meshing frequency f
m
, as well as its sidebands whose space is the characteristic frequency f
g
of a faulty gear. According to its specification, both of them can be calculated as follows [32]:
During modeling, the meshing incentives between planet gears and the sun gear are finally transmitted to the carrier, and thus the carrier is set as an output component. Therefore, its angular acceleration can represent the dynamic response of the whole PG [33].
For the constructed planetary gearbox, theoretical values of these frequencies are: f r 1 = 30 Hz, f m 1 = 500 Hz, f m 2 = 109.4 Hz, and f g = 75 Hz, where the subscripts ‘1’ and ‘2’ correspond to the first and the second stages, respectively. The simulation settings are shown in Table 1.
Simulation settings
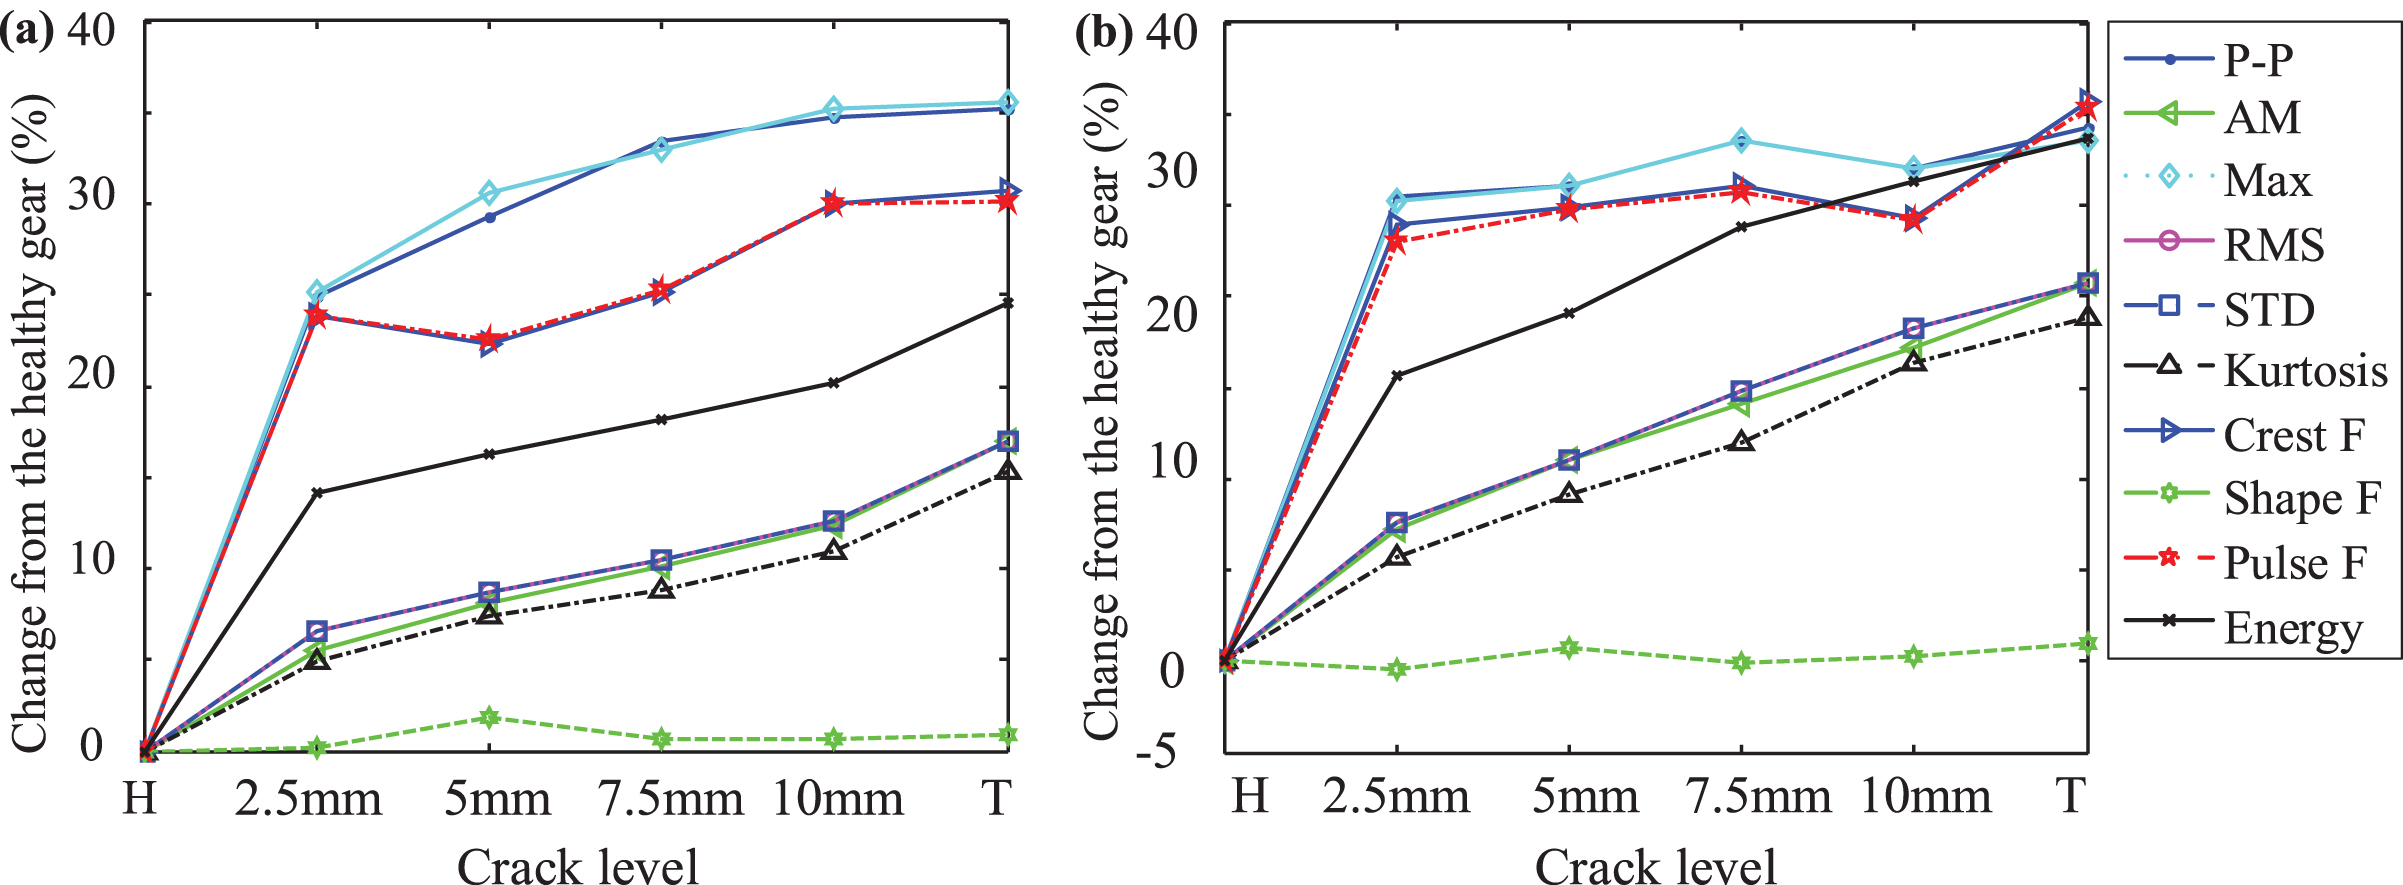
To validate the correctness of the constructed PG model, one effective way is to compare the frequency components in the simulated vibration responses with the theoretical values of the analytical model of PG [32]. The frequency spectra of vibrations collected from the first stage and the second stage of the PG are shown in Fig. 4(a) and (b), where the sun gear in the first stage has a crack with 5 mm width and 20% of the maximal crack depth. Some characteristic frequencies are also marked in this figure, in which f c 1 represents the rotating frequency of the carrier in the first stage and its value is 5 Hz. In addition, only low-frequency band is shown in this figure to clearly display these specific frequencies. The following spectra is also partially shown for the same purpose.
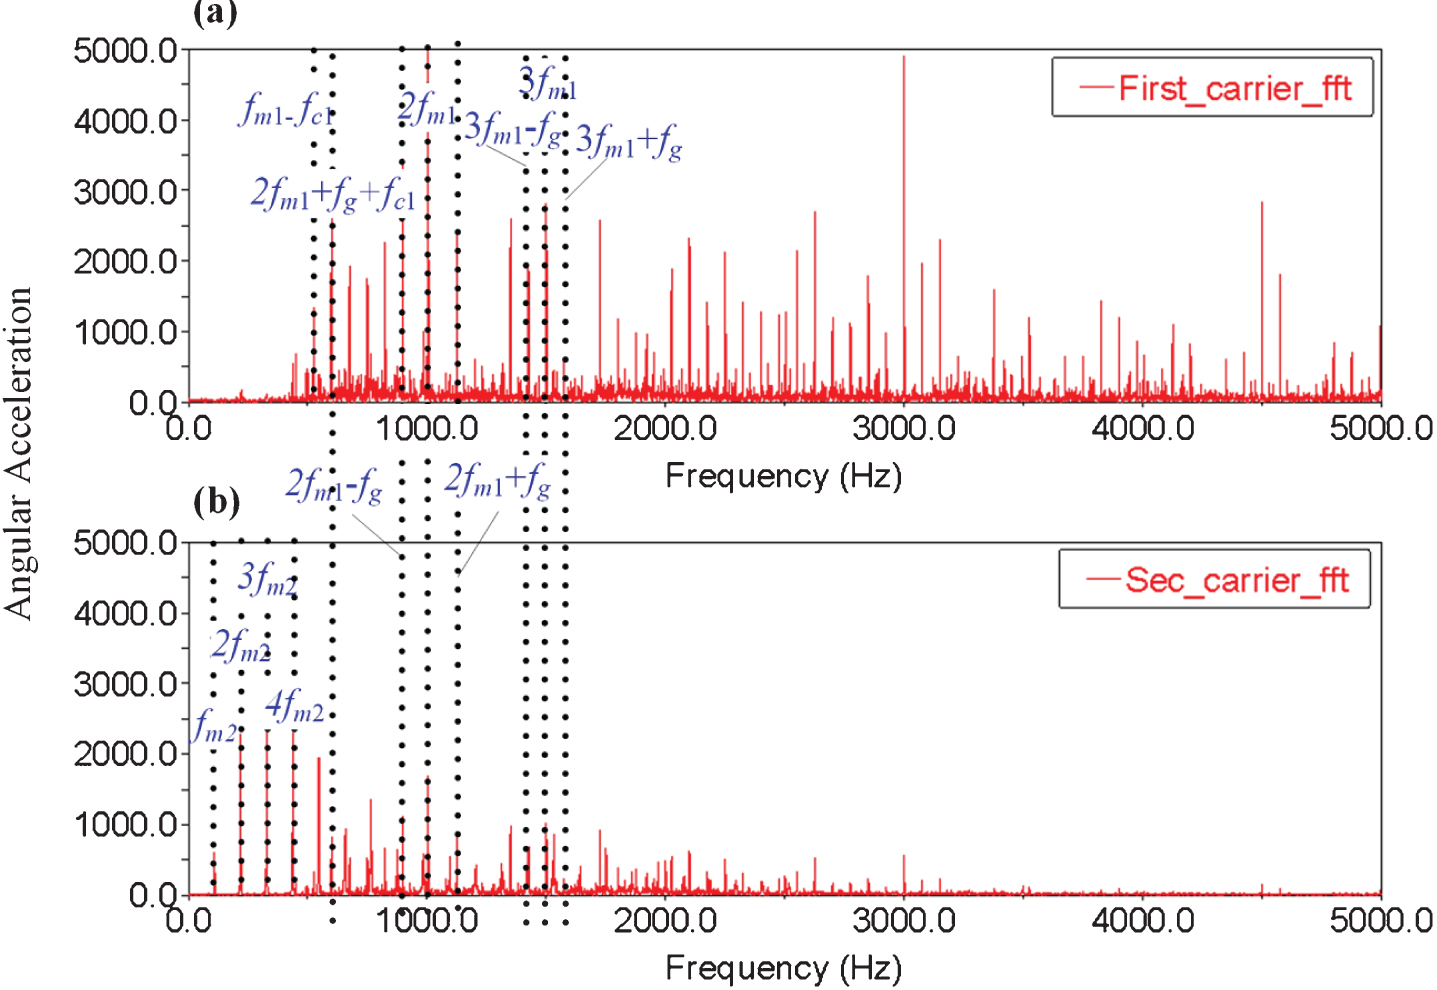
Frequency spectra of vibration responses of the two-stage planetary gearbox with the crack of 20%, 5 mm: (a) the first stage, and (b) the second stage.
As shown in this figure, characteristic frequencies of the PG, i.e. the meshing frequencies f m 1 and f m 2 can be clearly observed in the spectra. For the first stage, more frequencies, including the meshing frequency f m 1 and its multiples can be observed in Fig. 4(a). What is more, around the multiples of the meshing frequency f m 1, their sidebands, labeled at the frequency of kf m + hf g can be seen. These results match with the results obtained by the analytical model, and thus indicates that the presented model is correct.
As for the results from the second stage, only its meshing frequency f m 2 and its multiples can be observed in Fig. 4(b). Meanwhile, their amplitudes are much smaller than those at the frequency f m 1. It is because the damage is set on the sun gear in the first stage and the energy caused by the crack is partially transmitted to the second stage, which also matches with the simulation setting.
Another comparison was also conducted between the presented coupled model and a rigid model. As mentioned above, the deformation of the crack and its effects on the jointed stage are considered during the modeling and then a rigid-flexible coupled model is obtained. Different from this model, a model whose gear components are all rigid is also constructed under the same conditions and the same crack, i.e. a crack with 5 mm width and 10% depth. Figures 5 and 6 show the comparisons of two models based on the responses of the first stage and the second stage, respectively.
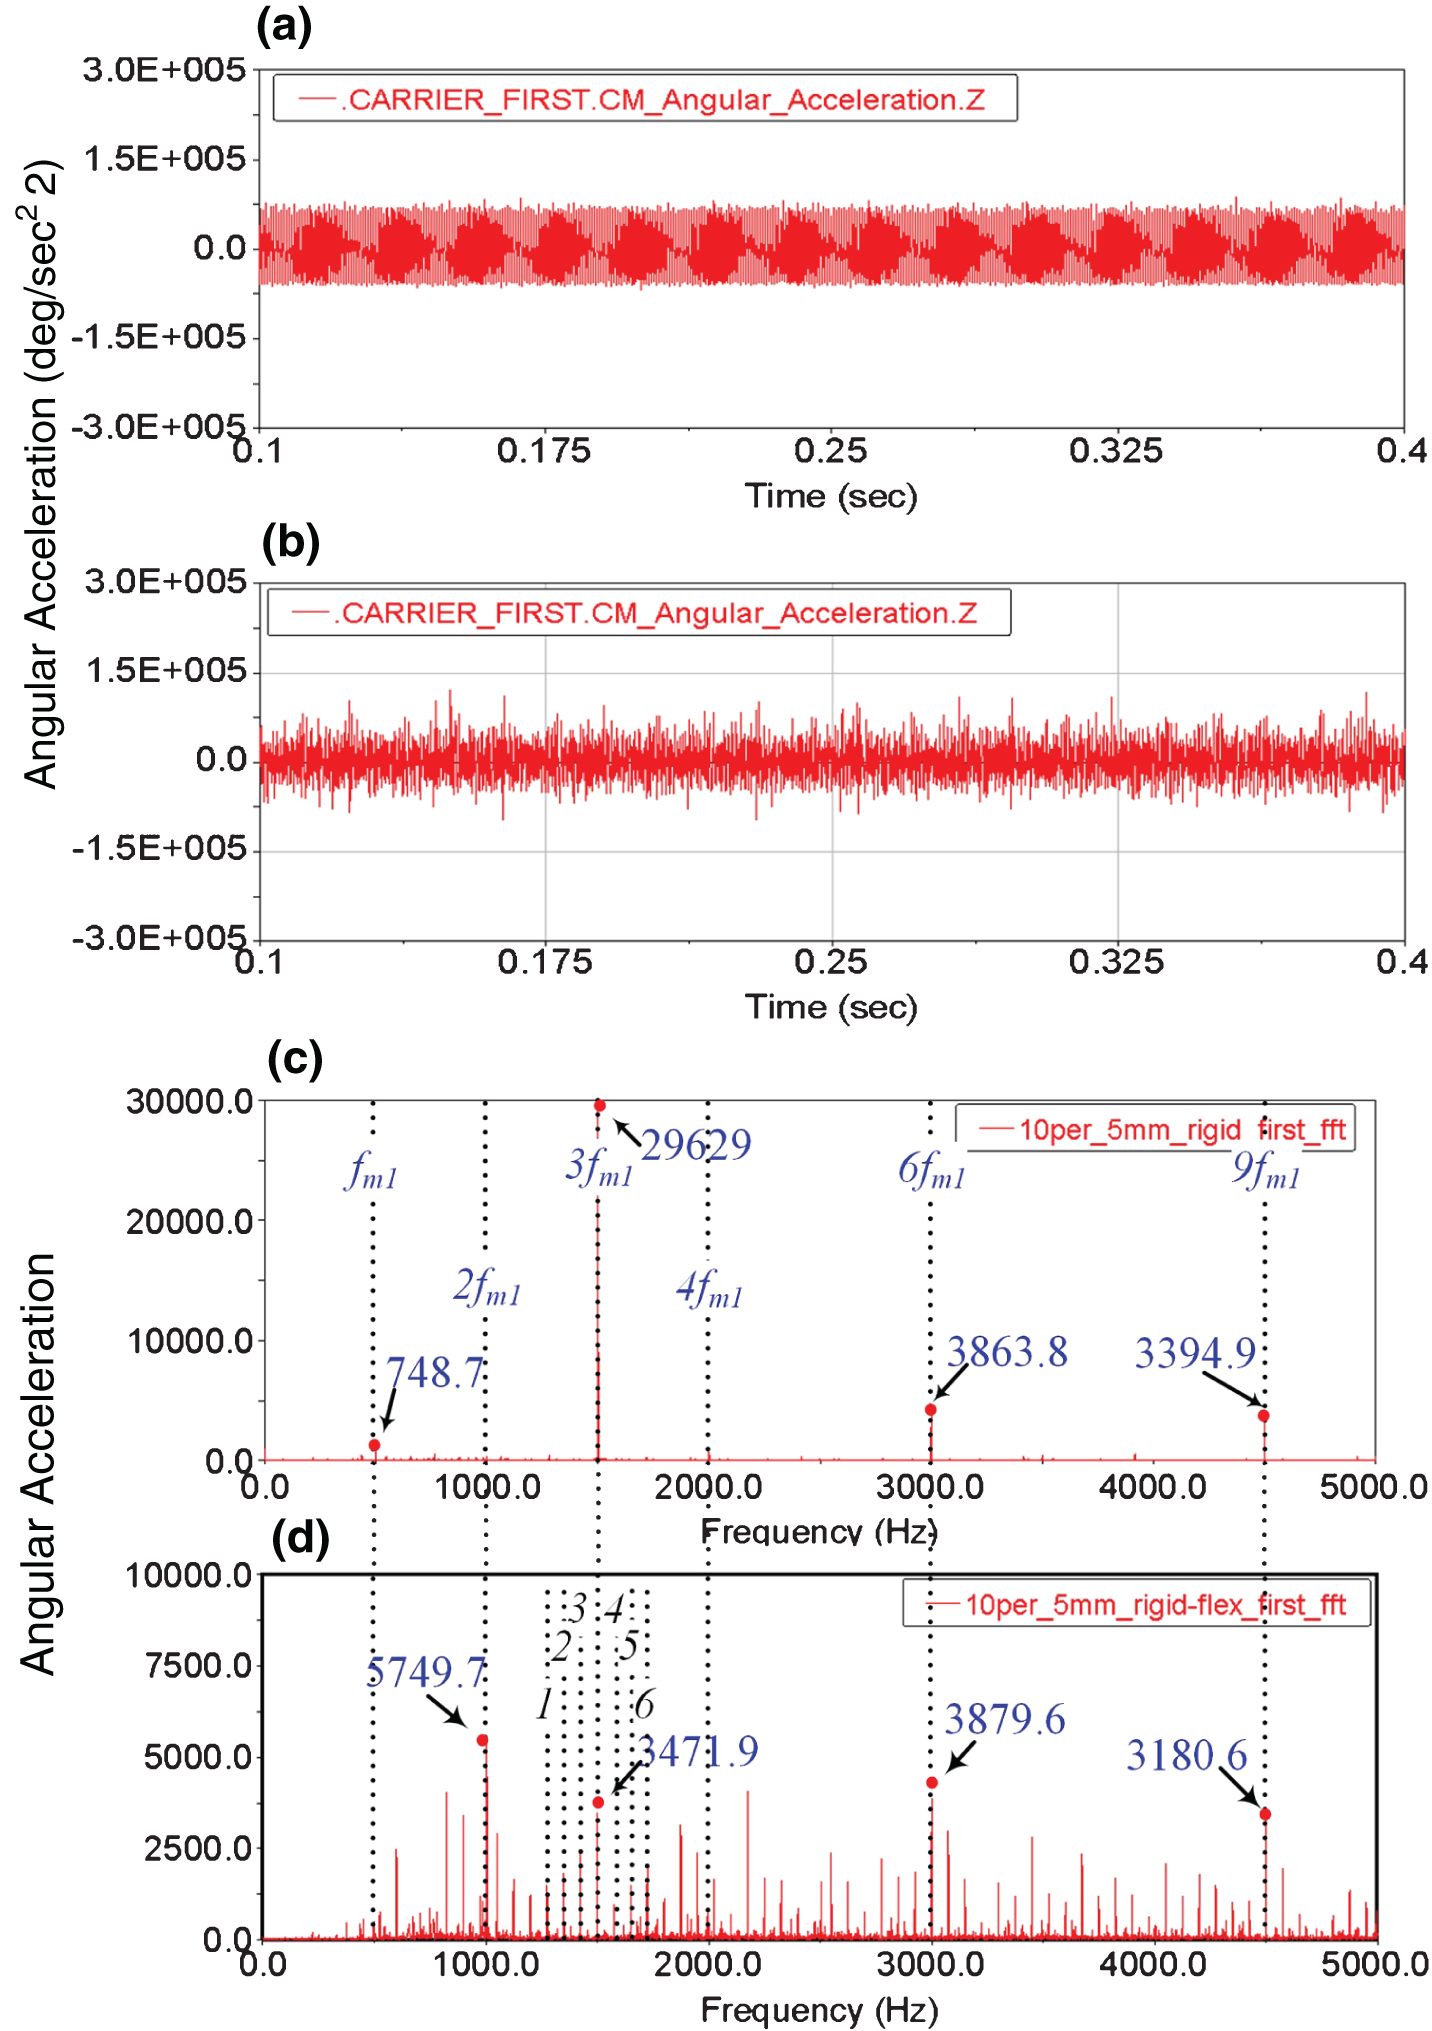
Comparison of a rigid model and a rigid-flexible coupled model for the first stage of the PG with the crack 10%, 5mm: vibration and frequency spectrum of the former in (a) and (c), those of the latter in (b) and (d). Notes. 1 : 3fm1 - 3f c ; 2 :3fm1 - 2f c ; 3 :3fm1 - f c ; 4 :3fm1 + f c ; 5 :3fm1 + 2f c ; 6 :3fm1 + 3f c .
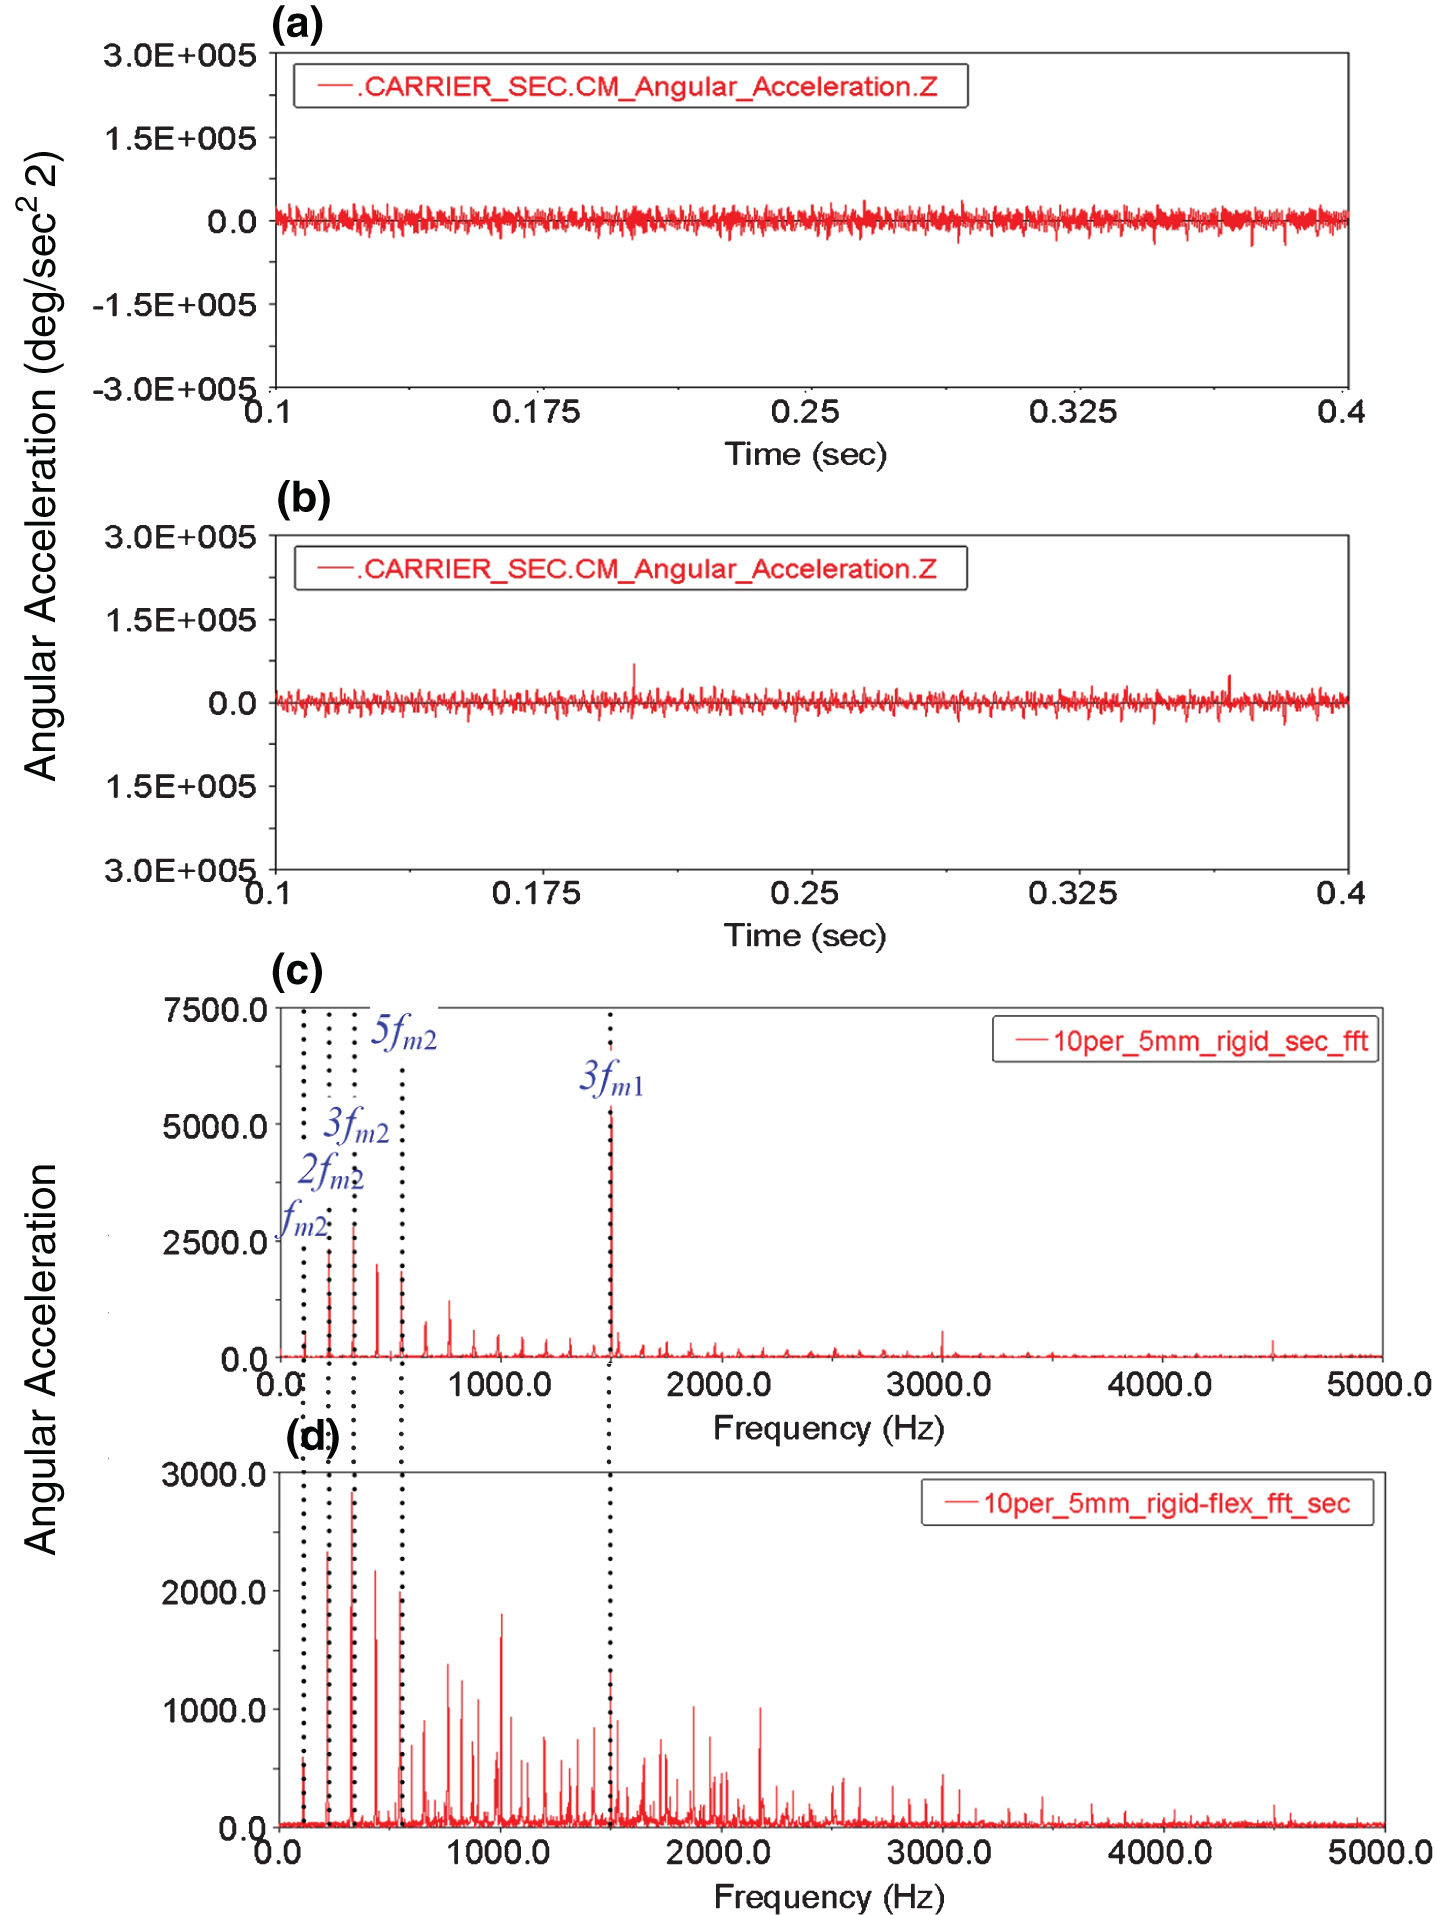
Comparison of a rigid model and a rigid-flexible coupled model for the second stage of the PG with the crack 10%, 5 mm: vibration and frequency spectrum of the former in (a) and (c), those of the latter in (b) and (d).
Due to unsteady output of the model before the first 0.1 second, the vibration signals in Figs. 5 and 6 start from 0.1 second. For the first stage, the difference of two models are obvious. Figure 5(a) shows a clearer modulated waveform than Fig. 5(b) because the frequency components in the former is relatively simple. For the second stage, their difference in time domain is difficult to observe. Further comparison in frequency domain is then conducted in the following.
For the first stage of the rigid model, only the meshing frequency and its multiples can be observed in its frequency spectrum in Fig. 5(c), while more frequencies, including the sidebands and other unknown feature frequencies, can be found in Fig. 5(d). Besides the difference on the frequency components, the amplitudes at multiples of f m 1, are also marked in these figures. At the same frequency, the amplitude of the rigid model is much larger than that of a coupled model. Both results indicate that the presented hybrid model can display the features when the PG has a crack, and thus can better reflect real working situations of the PG than the rigid model.
As for the second stage of two models, their performances on the spectra are almost the same because the setting in this stage is the same. Their minor difference is also the frequency components, which is still caused by the previous faulty gear set.
In this paper, to analyze the effects caused by various cracks, the crack propagates along two directions, and four and five crack levels on two directions are individually set. Here, the comparison results are shown in Figs. 7 and 8. Figure 7 shows frequency spectra of vibrations from the first stage of the presented PG model without crack (health) and with the crack of 10% crack depth and five different crack widths. Figure 7(a) shows the spectrum from a healthy sun gear. Figure 7(b)– (e) correspond to the cracks of 2.5 mm, 5 mm, 7.5 mm, and 10 mm of the crack width. Figure 7(f) is the spectrum from the PG with the same crack depth and the crack throughout the tooth width. Figure 8 shows the frequency spectra of vibrations from the second stage of the PG under the same conditions. Part of characteristic frequencies are also marked in these figures.
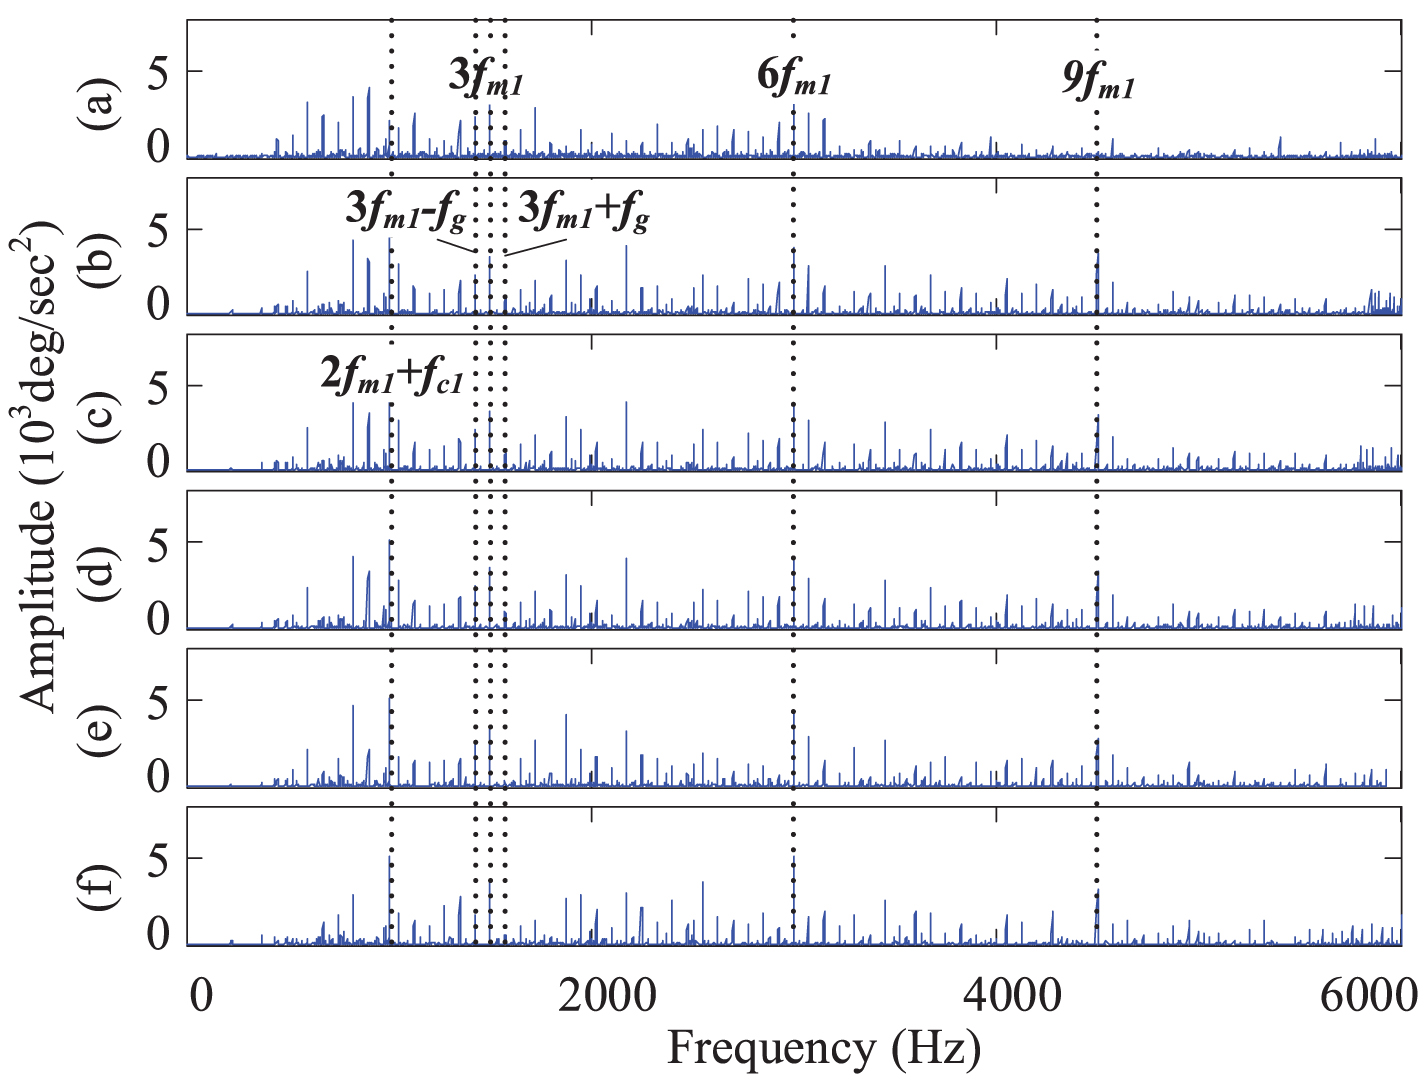
Frequency spectra of vibrations from the first stage of the presented PG model with the crack of 10% crack depth: (a) health sun gear, crack (b) 2.5 mm, (c) 5 mm, (d) 7.5 mm, and (e) 10 mm of the tooth width, (f) throughout the tooth width.
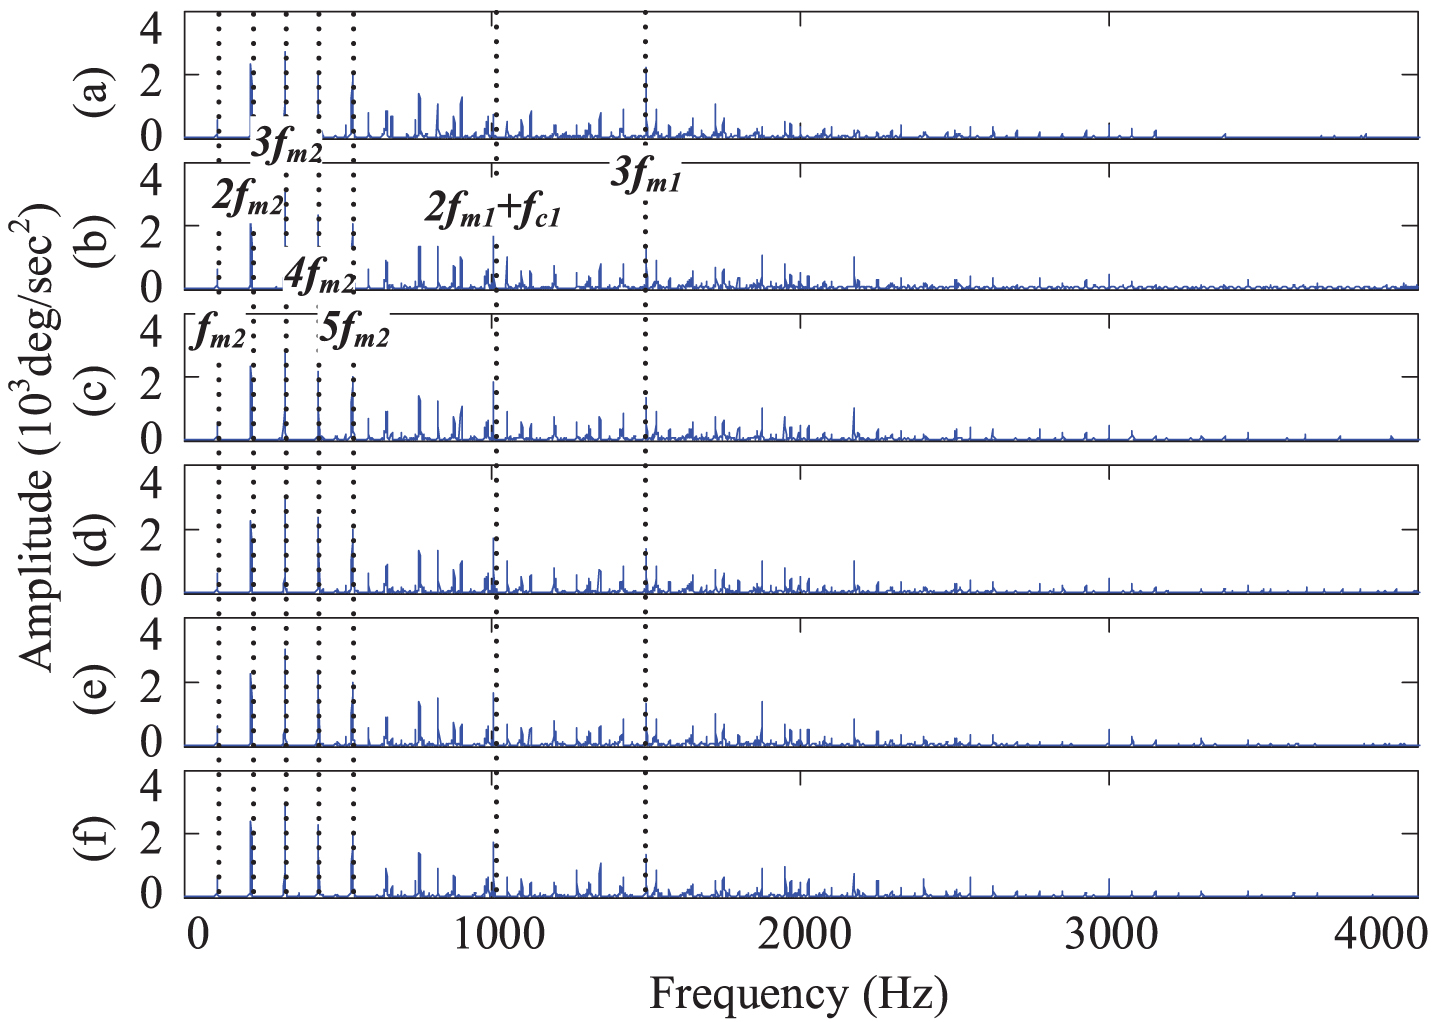
Frequency spectra of vibrations from the second stage of the presented PG model when setting as Fig. 7 for each case.
Larger amplitudes for the faulty stage (the first stage) and the healthy stage (the second stage) are identified at the frequencies of 2f m 1 + f c 1 and 3f m 1, respectively. For the first stage, at multiples of the meshing frequency, such as 3f m 1, 6f m 1, and 9f m 1, larger amplitudes as well as their sidebands can be observed. For the second stage, there are not any sidebands around the meshing frequency f m 2 and its multiples k f m 2. These results also indicate the effectiveness of the presented model. Meanwhile, owing to small cracks on the sun gear teeth, the corresponding vibrations are too small to distinguish their difference from the healthy PG. The following two subsections will use sidebands and statistic features to further analyze the differences caused by various cracks.
Considering that Y scale in Fig. 7 is limited, the changes of faulty sun gears are too small to be observed directly. To analyze these changes, the sidebands at the meshing frequency can be a possible choice because the sideband is one of indicators for the existence of damage. In this subsection, the amplitudes of sidebands are analyzed to further compare the changes of the growing crack. Based on the results shown in Fig. 7, one component of sidebands, the frequency of 1575 Hz (3f
m
1 + f
g
), is chosen, and its amplitude A is represented as the logarithmic coordinate, i.e.
Figure 9 shows the amplitudes at the frequency of 1575 Hz corresponding to various cracks on the sun gear teeth in the first stage. Y label represents their amplitudes and X label represents the crack level. The crack is firstly classified into four zones according to the crack depths, i.e. 10%, 20%, 50%, and 80% of the maximal crack depth. In each zone, the crack is then classified according to its widths, i.e. 2.5 mm, 5 mm, 7.5 mm, 10 mm, and throughout the tooth width (marked as T). The starting point of X label represents the value from a healthy sun gear (marked as H).
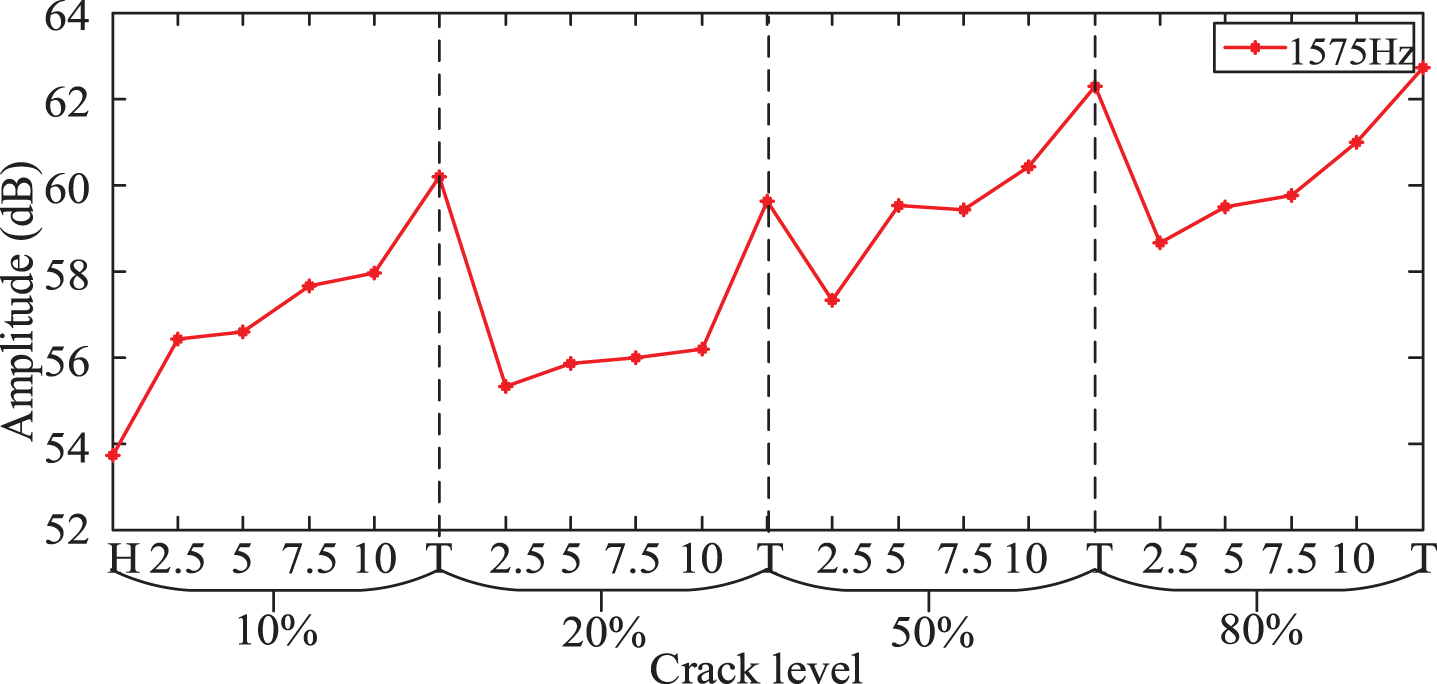
Amplitudes of the special frequency 1575 Hz of sidebands at the first stage of PG.
As shown in this figure, the amplitude increases with the growth of the crack as a whole. It indicates that the effects caused by the growing crack can be observed from the amplitude change of the sidebands. Once advanced signal processing methods are introduced to detail these changes, the relationship between the crack severity and amplitudes may be determined.
To investigate the condition of the monitored object, the statistic-based indicators is proven to provide accurate information regarding the conditions of various components having damage. In recent years, fault extraction and identification based on statistic features, especially multi-domain statistic features, received more attentions due to their contributions on a variety of information and problems on efficiency and inconsistency. In this paper, some commonly used statistic features are selected as condition indicators (CIs) to reveal varying characteristics of the PG with a growing crack. They are max, peak-to-peak (P-P), mean, absolute mean, root mean square (RMS), standard deviation (SD), skewness, kurtosis, crest factor, shape factor, pulse factor, and energy.
To compare the effects caused by different cracks, these statistic features are represented as a relative change from the healthy sun gear, that is to say, the value of each statistical feature is a ratio of their change between the faulty and the healthy sun gears to the healthy one, which is expressed as
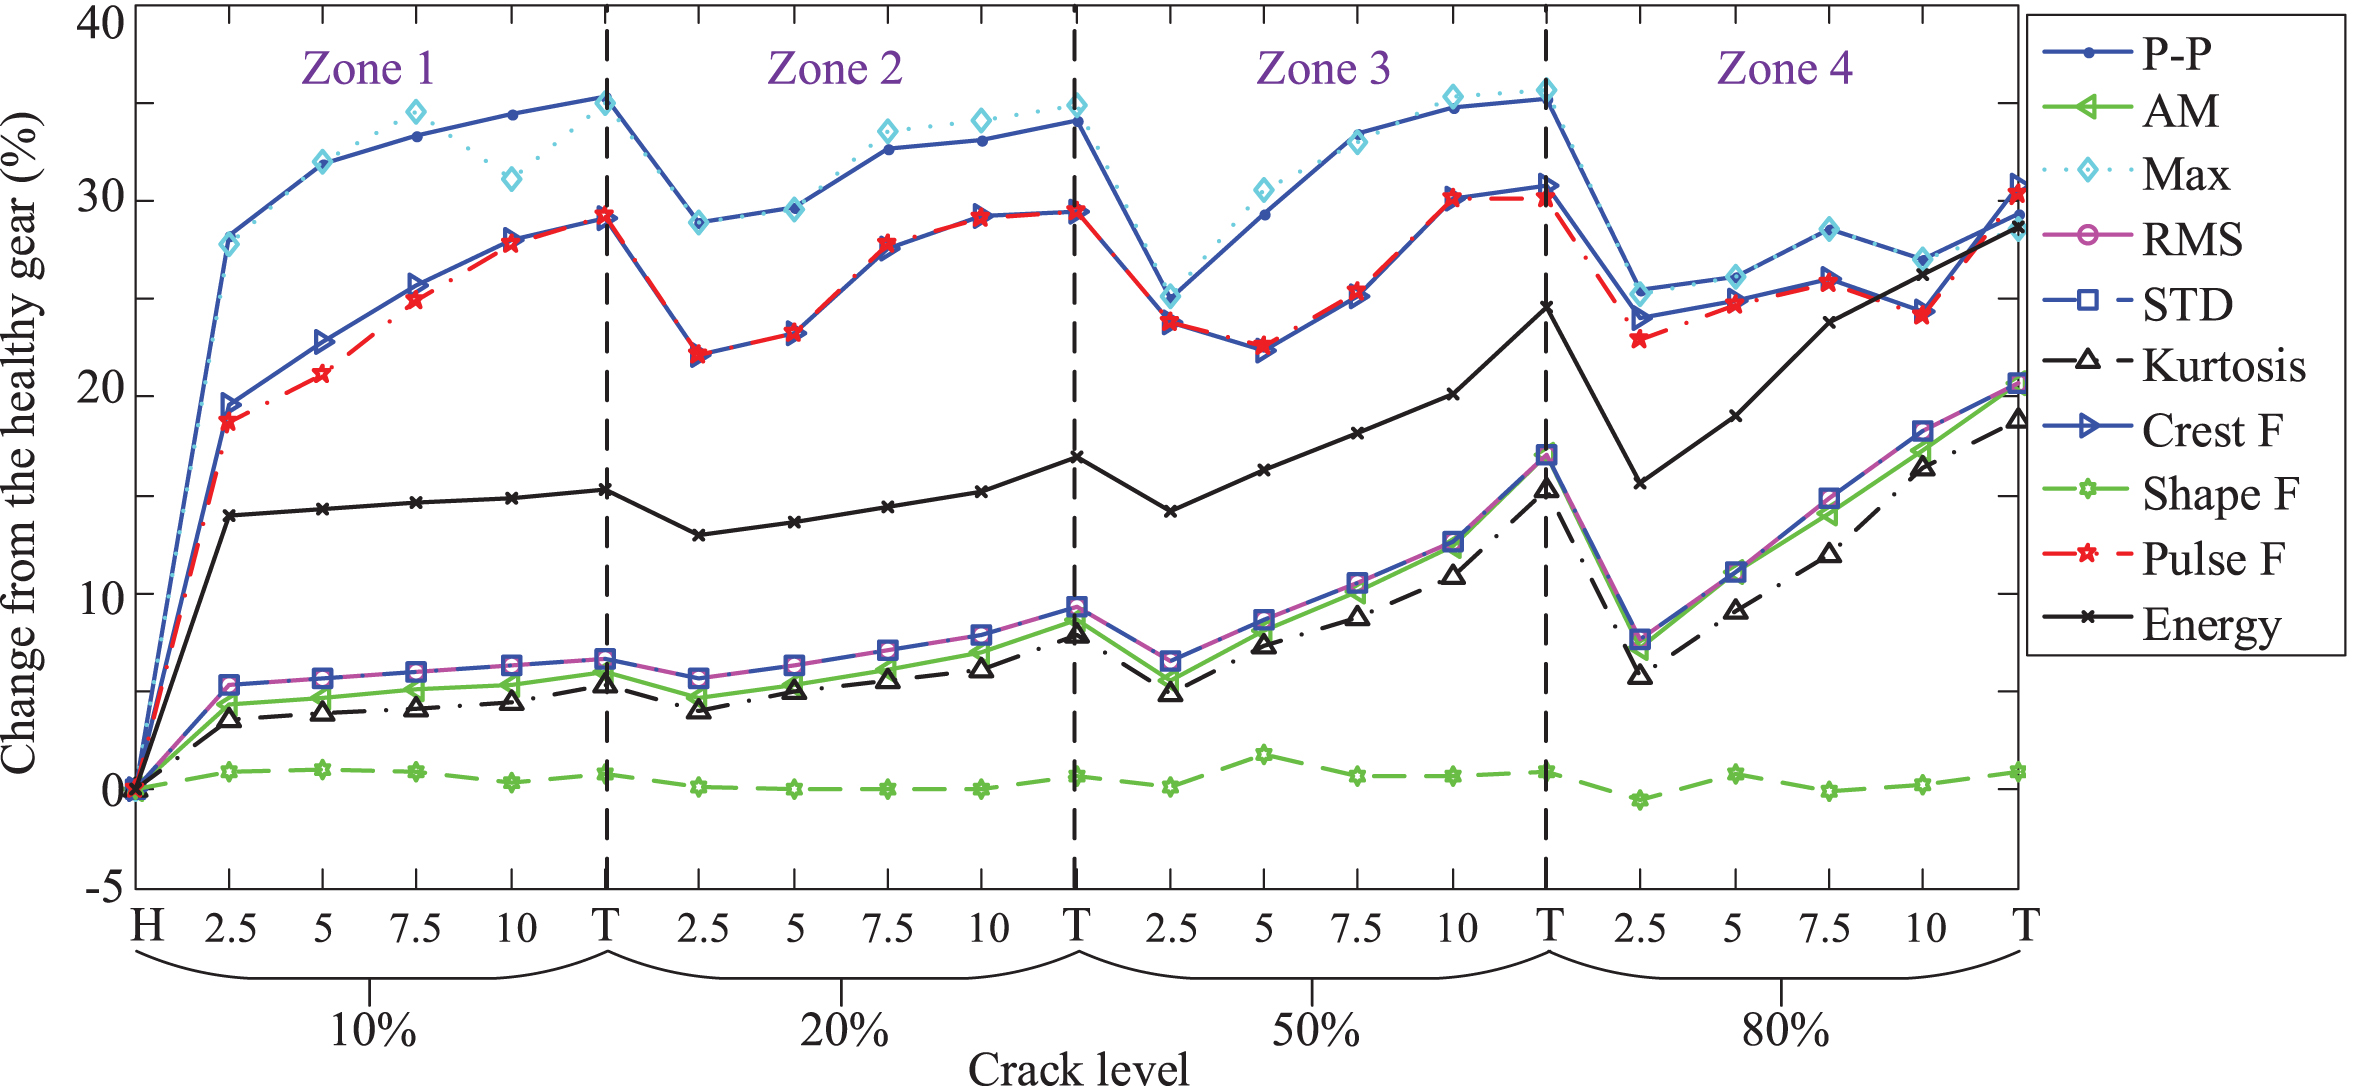
Condition indicator values in time domain to compare the healthy gear (H) with gears with various cracks, in which each zone corresponds to the cracks with the same depth and five widths.
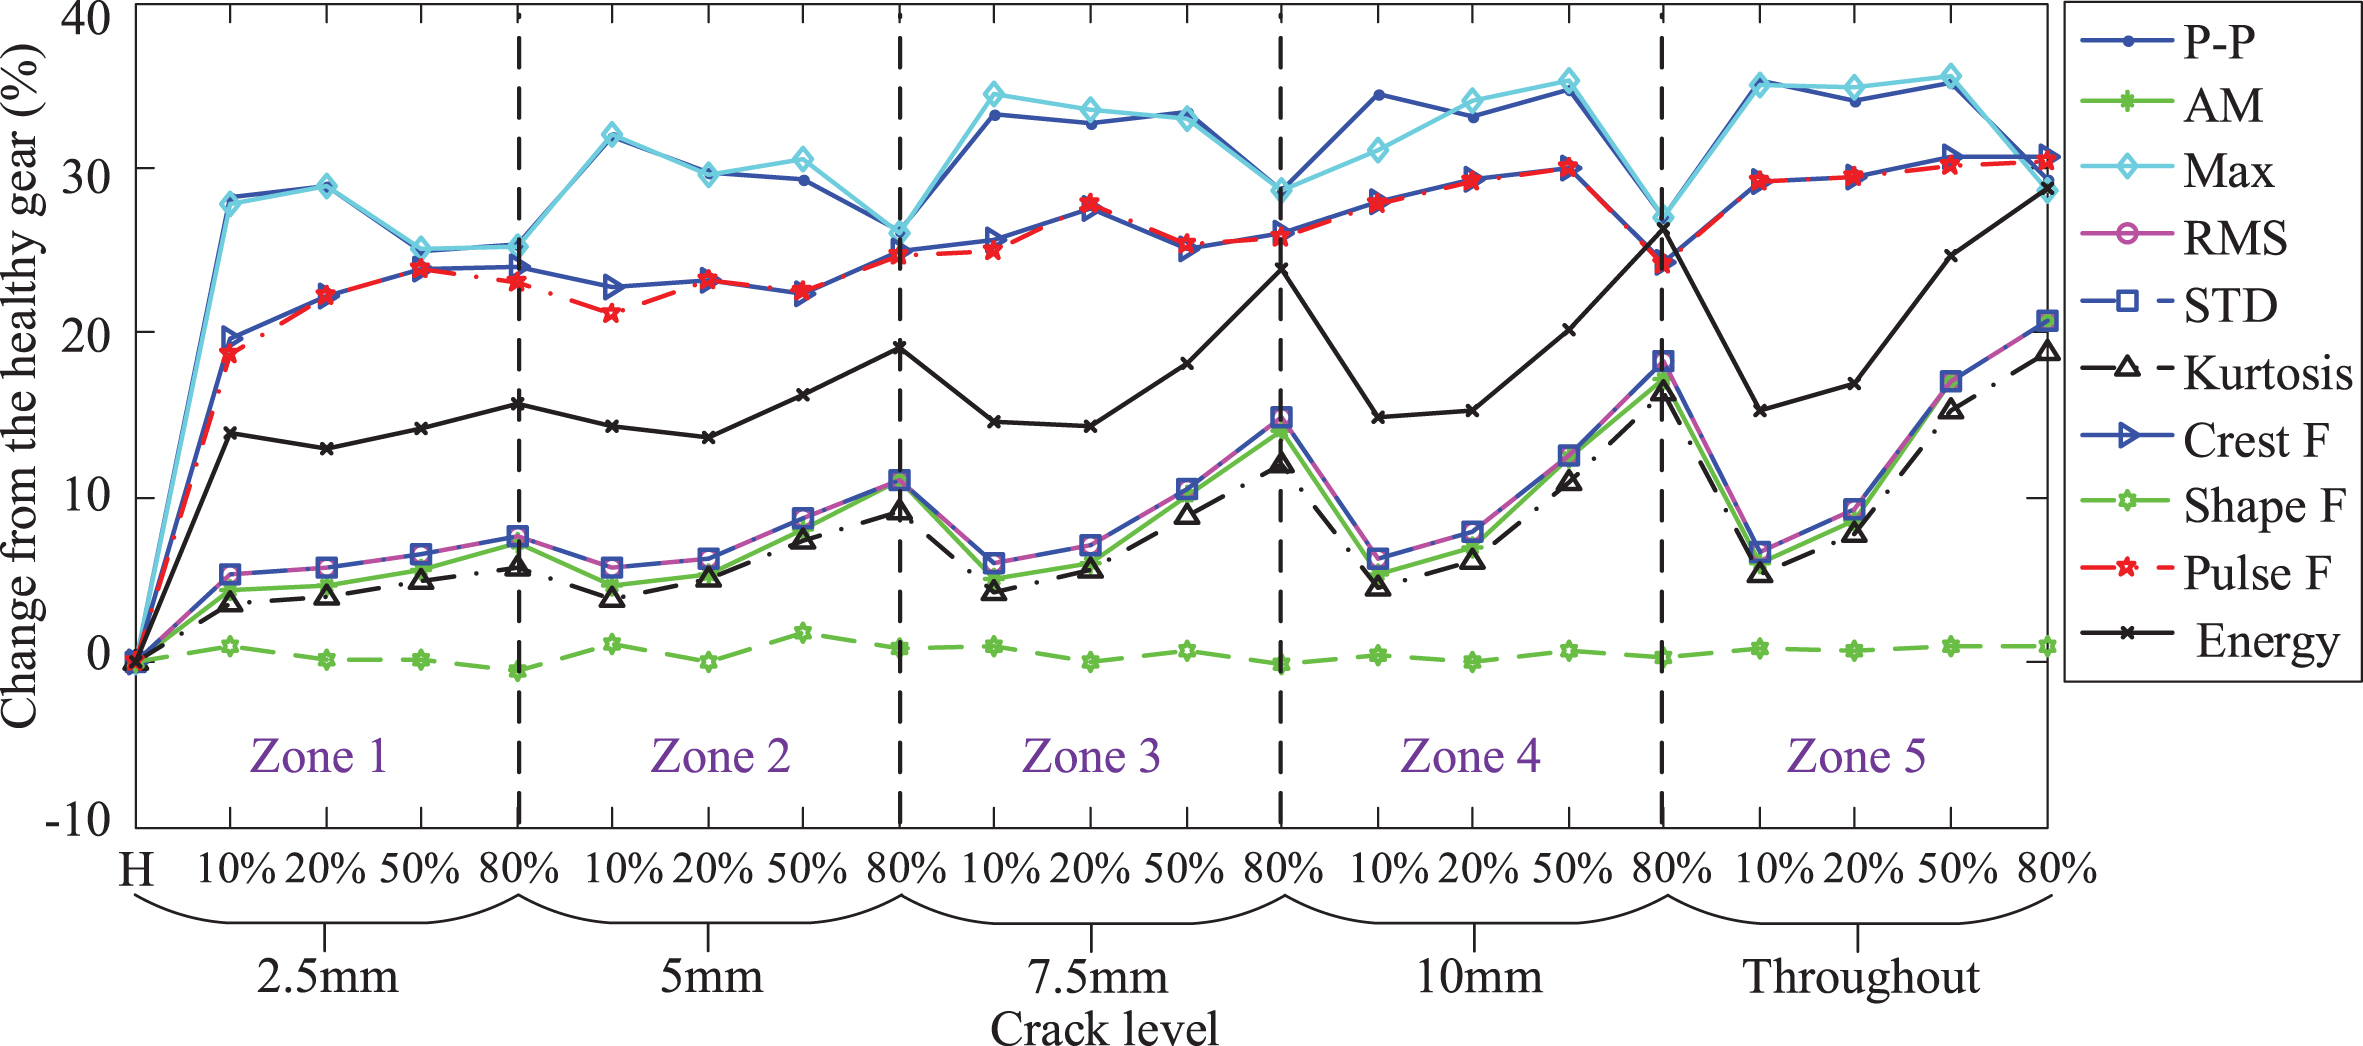
Condition indicators in time domain to compare the healthy gear (H) with gears with various cracks, in which each zone corresponds to the cracks with the same width and four depths.
Figure 10 shows values of condition indicators in time domain for responses from a healthy sun gear and faulty sun gears with various cracks. The meaning of X label is the same as that in Fig. 9. The meaning of Y label is the relative change of the fault gear to the health gear. It is noted that the starting point in Fig. 10 corresponds to the healthy PG, and each of other points represents the relative change of the faulty PG to the healthy PG. To observe the overall trend, all results from the same feature are consecutively connected by a continuous line as shown in Fig. 10, not connected to the starting point, i.e. their reference point. According to the crack depth, the whole figure is divided into four zones, and each zone shows the results when setting the same crack depth and five different crack widths.
Figure 11 also demonstrates CIs with the crack growth, which corresponds to the results shown in Zone 3 and Zone 4 of Fig. 10. The difference of Figs. 10 and 11 is that, in the former, the first point of Zone 2, or 3, or 4 is not connected to the reference point, but the last point of its previous zone. The former demonstrates the overall trend of all cases and the latter shows the local trend in single zone.
It is noted that the values of two CIs, Mean and Skewness, change dramatically among cracks and influence the observation of other CIs, and thus the results of these two CIs are not shown in Figs. 10–12.
As shown in Fig. 10, taking no account of the first segments in Zones 2, 3, and 4 (its reasons mentioned before), no matter which range (single zone or the whole range) is observed, the CIs show an upward trend as a whole, while CIs also show the difference on the damage sensitivity, and their performance on the state indication is then different. Some observations are summarized as follows: The CIs of P-P and Max show similar upward trend as a whole. In Zone 1 and Zone 3, with the increase of the crack width, the uptrend of the CI is steady, while this trends in Zone 2 and Zone 4 are not so obvious. The CIs of Pulse factor and Crest factor also show such an upward trend, but their variations are more moderate for a minor change on the crack. The CIs of energy, RMS, STD, AM and kurtosis show similar indication performance on the crack changes. For a smaller crack, for example Zone 1 and Zone 2, their changes are also relatively small. For a larger crack, for example Zone 3 and Zone 4, their rising trends are more noticeable. Therefore, they are more useful on health monitoring of the PG. Shape factor shows almost a flat trend with the crack growth and thus is viewed to be not sensitive to the crack. Accordingly, it is not suitable to be a condition indicator for the PG.
Figure 12 shows another comparison of CIs in time domain. Its difference from Fig. 10 is the arrangement of crack levels in X label. The crack is firstly classified into five levels, i.e. 2.5 mm, 5 mm, 7.5 mm, 10 mm, and the crack throughout the tooth width. Fixing this crack parameter, four crack depths, i.e. 10%, 20%, 50%, and 80% of the maximal crack depth, are then compared. Therefore, five zones are obtained to compare the results when setting the same crack width and four crack depths. It is to analyze whether different sequence of crack levels would affect the trend. As shown in Fig. 12, similar observations can be obtained. The CIs of energy, RMS, STD, AM and kurtosis show better performance on the indication of PG health state. Using the energy as an example, the change for a small crack, such as the crack of 2.5 mm or 5 mm, is difficult to be noticed, and the change for the latter three cracks presents a visible rising.
Based on above results, the use of CIs presents a useful way to monitor and evaluate the vibration of healthy as well as faulty planetary gearboxes.
Experiments were conducted on a drivetrain dynamics simulator (DDS) shown in Fig. 13. The drivetrain consists of a two stage planetary gearbox, a two stage parallel shaft gearbox with rolling or sleeve bearings, a bearing loader, and a programmable magnetic brake. An accelerometer was vertically mounted on the planetary gearbox housing to collect vibration signals. The tested PG has three planet gears in the first stage and four planet gears in the second stage. It is noted that, limited by manufacturing error and small size of the sun gear, the artificially made crack is relatively thick, which is not as slim as a real crack. The rotating frequency of the sun gear at the first stage is 30 Hz, and the sampling frequency is 10240 Hz.
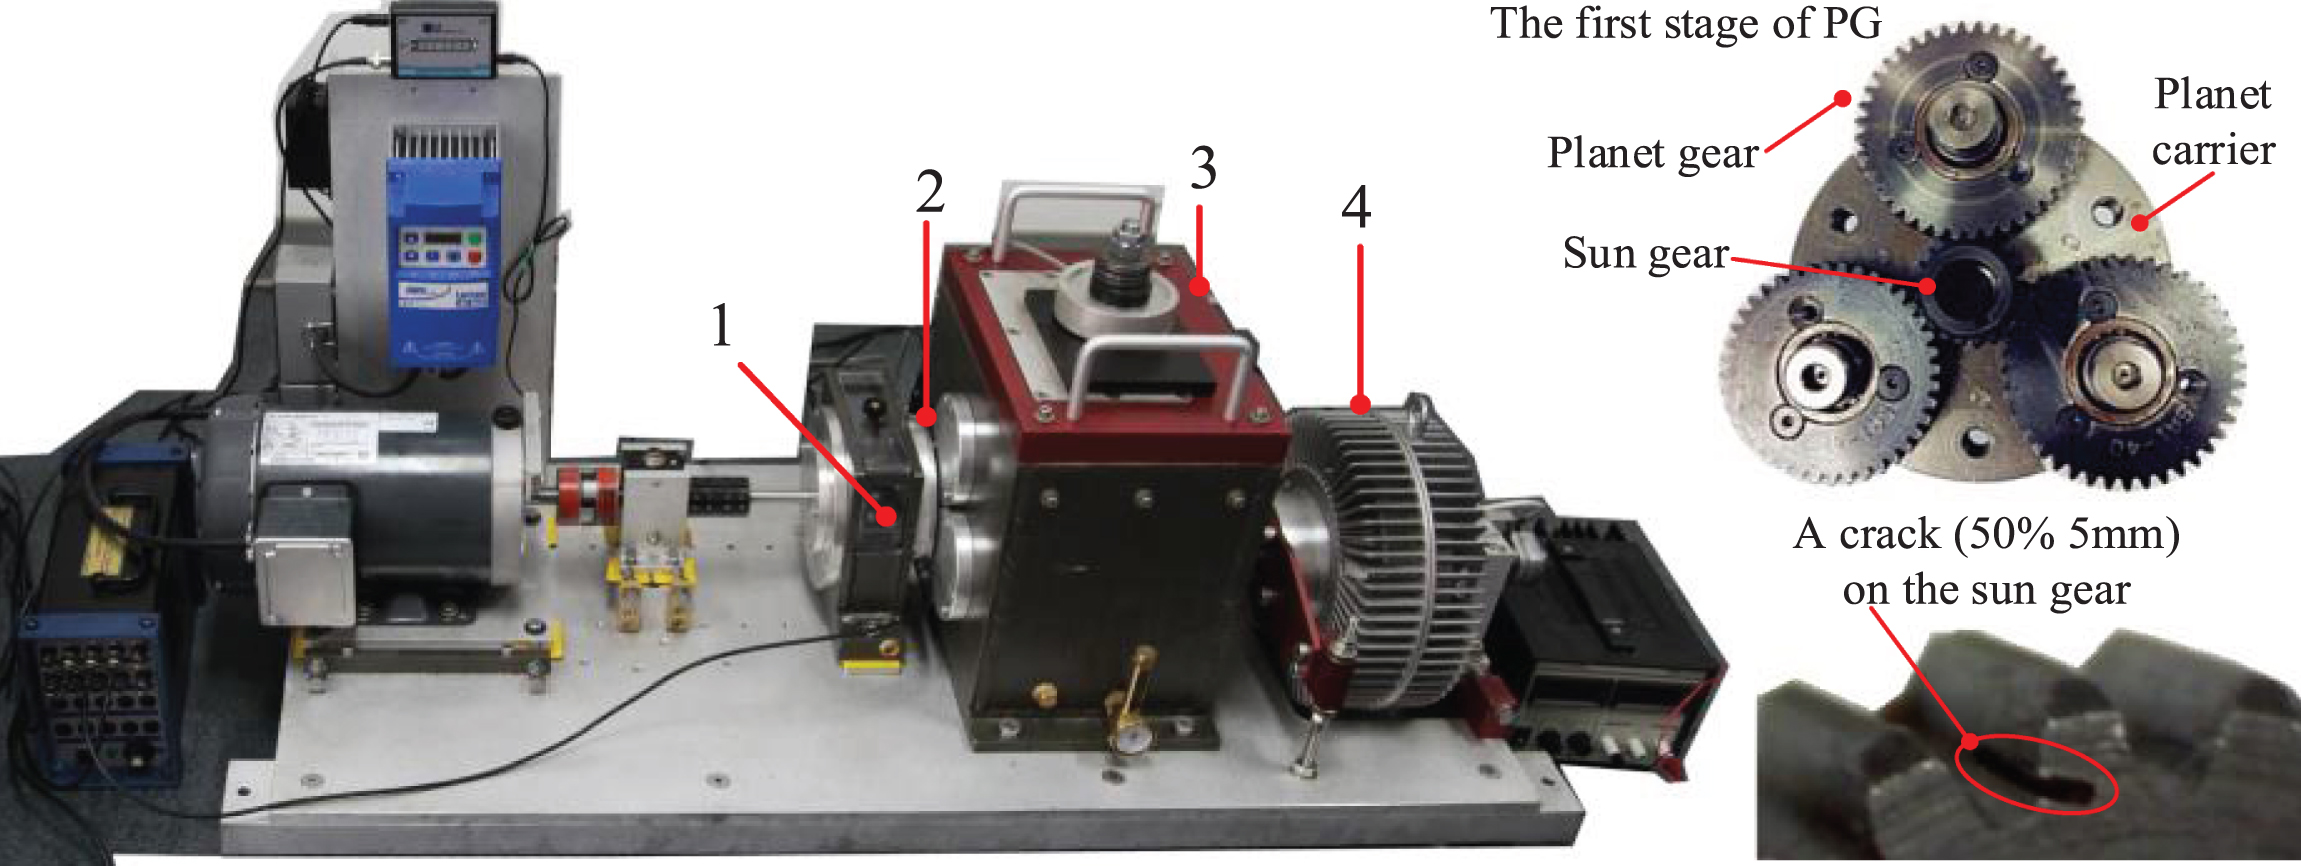
Drivetrain dynamics simulator (DDS): 1. a two stage planetary gearbox; 2. an accelerometer; 3. a two stage parallel shaft gearbox with rolling or sleeve bearings; 4. a programmable magnetic brake.
Figure 14 shows the frequency spectra of experimental vibration signals of the PG. The result in Fig. 14(a) comes from a healthy PG, and the results in Fig. 14(d)– (e) correspond to the PG having 5 mm cracks on the direction of the tooth width and four depths, i.e. 10%, 20%, 50%, and 80% of the maximal crack depth, respectively. Some characteristic frequencies are marked by using the dotted lines in this figure, including the meshing frequency f m 1 and its multiple kf m 1, the rotating frequency of the first carrier f c 1 and its multiples, the rotating frequency of the input f n 1 and its multiples, and their combinations. Around the meshing frequency f m 1, peaks can be found at its sidebands f m 1±f g , in which the amplitude at the frequency of f m 1 + f g is larger, and that at the frequency of f m 1-f g is relatively small. Comparing the whole spectra, the effect caused by the crack change is also observable. For a healthy PG in Fig. 14(a) or a PG with a slight crack in Fig. 14(b), amplitudes at characteristic frequencies are relatively small. When the crack grows more severely, their amplitudes and adjacent amplitudes increase more obviously, which matches with the severity of cracks in the experiments.
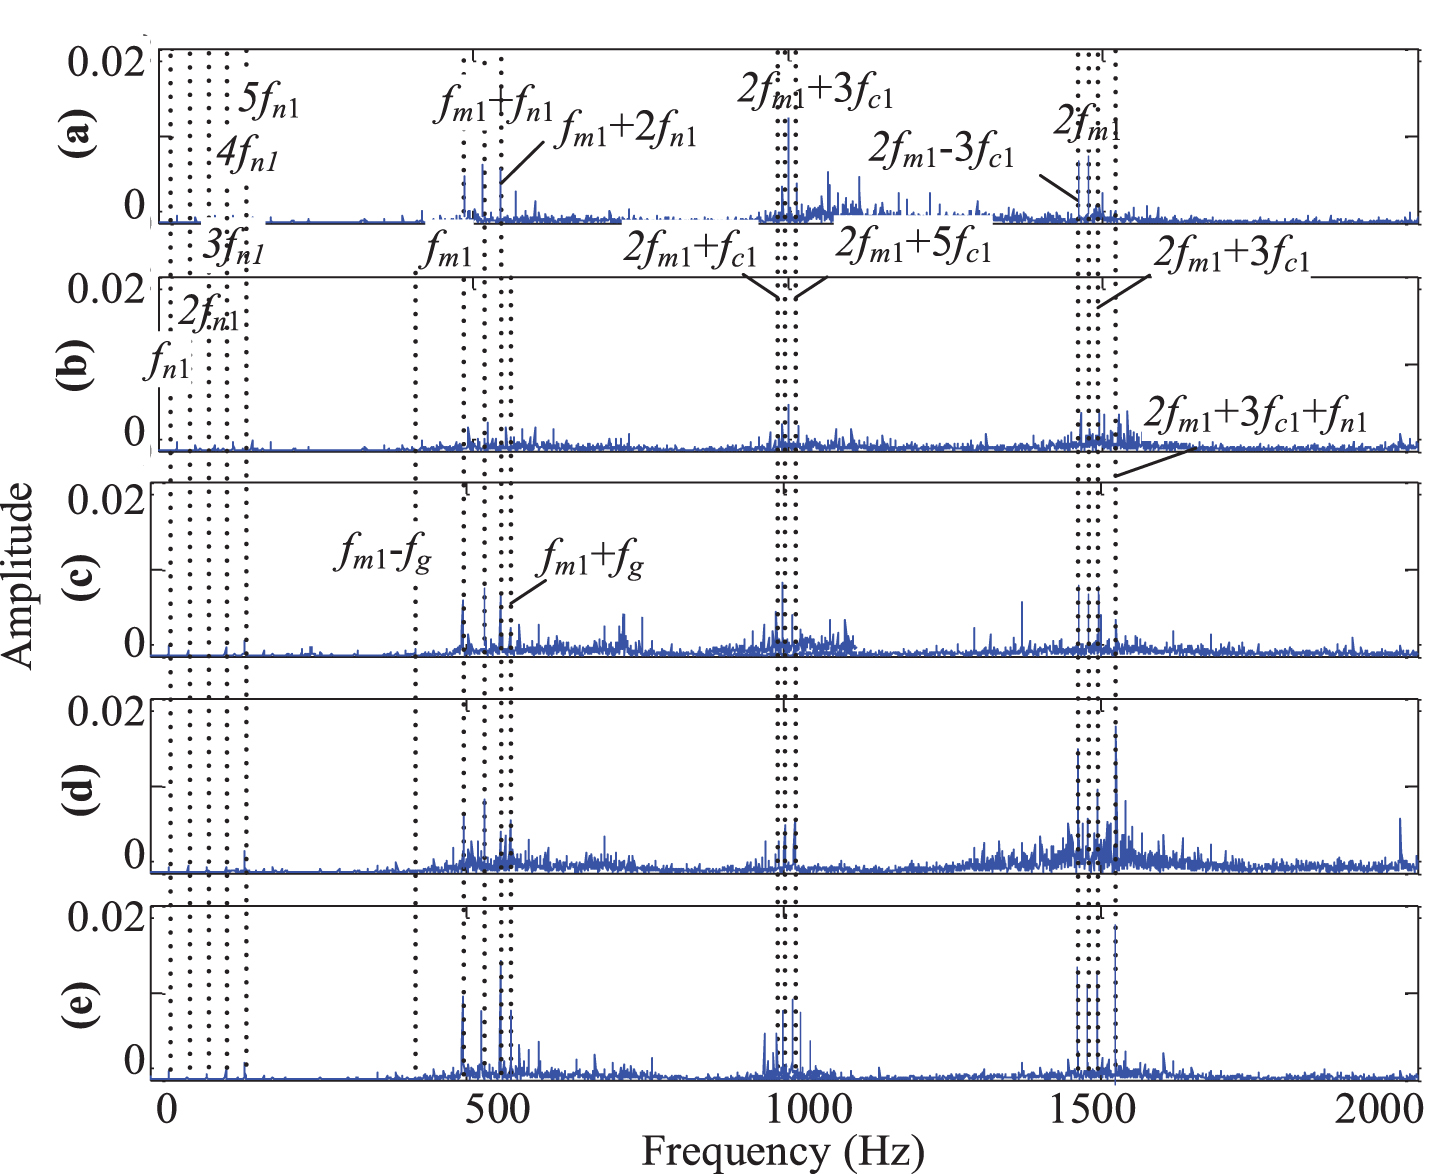
Frequency spectra of vibrations at the first stage for the PG: (a) Healthy gear; and gears with cracks (b) 10% 5 mm; (c) 20% 5 mm; (d) 50% 5 mm; (e) 80% 5 mm.
Figure 15 shows the amplitudes at the frequency of 575 Hz (f m 1 + f g =575 Hz) for above cracks. The meaning of X label is also the crack level. Here, the cracks with four depth and the same width of 5 mm are compared.
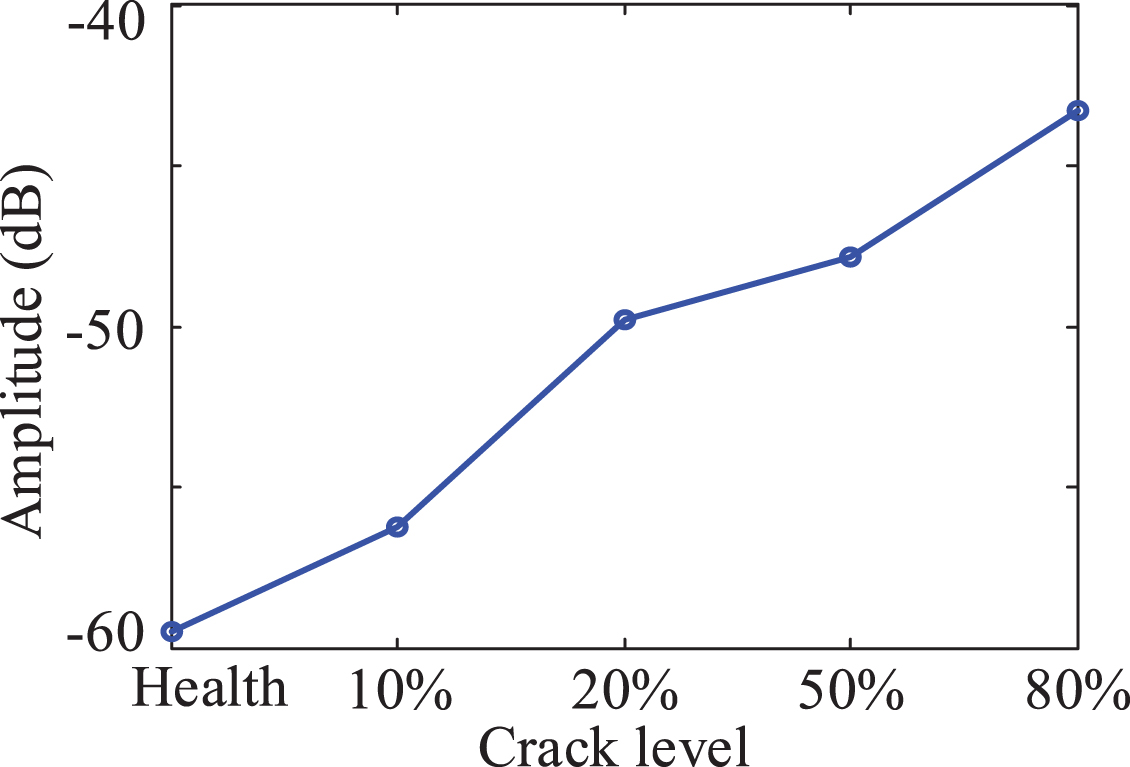
Amplitudes of the frequency at 575 Hz for the sidebands of the crack with the same width (5 mm) and different depths.
The results in Fig. 15 are also similar to the simulation results in Fig. 9. It also shows an obviously rising trend with the increase of the crack. Both results in the simulations and experiments indicate the effectiveness of the sidebands on the health monitoring of the PG. Similar observations can be obtained in the comparisons among the cracks with the same depth and different widths.
Based on the results of simulation and experiments, some observations are listed as follows: The characteristic frequencies of the first stage can be observed in the spectra of the first and the second stage, while those of the second stage are seldom found. The existence of sidebands can indicate abnormal state in the PG, and what’s more, its amplitudes increases with the growth of the crack. Therefore, it can be used as the condition indicator of the running PG. Some statistic based condition indicators, such as RMS, STD, kurtosis, and energy, are fault sensitive, and thus can be used to monitor the PG effectively. Early crack has relatively weak vibrations; accordingly, there may be different observations between simulations and experiments.
In this paper, a modified dynamic model is established for a two-stage planetary gearbox with a varying crack on its sun gear tooth. To simulate real operations of the PG, two modifications are introduced into this model. First, to avoid over simplification of a straight propagation path, not only the shape of the crack path but also the direction of the crack extension are modified. The crack is set to propagate along the tooth width and the crack depth simultaneously, and both paths are simulated by using two parabolas that were proven to be more close to real cracks. Furthermore, a rigid-flexible coupled model is constructed to keep a balance between the model accuracy and computational burden. In this model, two critical components, the sun gear with a varying crack and the planet carrier in the first stage of PG are set as flexible bodies, and the other gear components are still set to be rigid. The former strategy considers the deformation of the faulty gear and its effects to the joined stage, and the latter avoids the problem of high computational cost. The model verification and vibration analyses demonstrate that the presented model is closer to the real case than the rigid model. The analyses of amplitudes of sidebands and statistic features demonstrate the effectiveness for investigating the vibration behavior of the PG with or without a varying crack. Moreover, they can be used for health monitoring of the PG.
The results of simulations and experiments in this paper demonstrate that the dynamic model of PG is helpful on the understanding of PG vibrations under the healthy and faulty conditions. As Randall stated in Ref. [34], making simulation models of a machine, such as a gearbox with various faults of different types, severity, and location, provides a number of benefits for machine fault diagnosis, such as a better supporting for theoretical methods and a better understanding of signal characteristics. In this paper, the constructed dynamic model of the PG also provides a useful tool to investigate PG dynamics and condition indicators. It can be used to further study condition monitoring and prognosis of the PG.
In the future, relevant research work and experiments on quantitative relationship between damage severity and vibration intensity would be investigated for the prognosis and prediction of a single stage PG, even the multi-stage planetary gearbox.
Footnotes
Acknowledgments
The work described in this paper is fully supported by the National Natural Science Foundation of China (Nos. 51405063, 51537010, and 11602054), and the Natural Science Foundation of Guangdong Province under Grant 2017A030313278.