
Abstract
In order to improve the accuracy of support vector machine (SVM) classification of remote sensing image, SVM parameter selection is an important part. In this paper, we analyze the influence of SVM parameters on classification performance. Aiming at the characteristics of particle swarm optimization (PSO) and genetic algorithm (GA) in optimization, a method of optimizing SVM parameters based on dynamic co-evolutionary algorithm (PSO-GA) is proposed. This method can dynamically adjust the selection probability of PSO and GA strategy, realize the complementarity of evolution between PSO and GA, improve the convergence speed and realize the optimization of depth and breadth. The experimental results show that the method improves the parameter selection efficiency of SVM, and the obtained parameters are optimal for the classification of the test samples.
Introduction
In recent years, remote sensing classification has been widely regarded as an important means of management, monitoring and evaluation. There are many algorithms that are applied to remote sensing classification problems such as minimum distance method [1], artificial neural network [2] (ANN), decision tree method [3] and so on. In theory, these methods have to ensure high performance, the number of samples must be large enough, but the actual application does not guarantee the selection of a sufficient number of classification samples. Support vector machine (SVM) is a new type of data mining method and it has the advantages in small sample, nonlinear and high-dimensional pattern recognition [4]. Therefore, it has been widely used in remote sensing classification in recent years and achieved good results.
In the application of SVM, the selection and optimization of kernel function parameters are of great significance to solving the performance of SVM [5, 6]. In recent years, Ref. [7–10] shows that the evolutionary algorithm is applied to SVM kernel function optimization Process, can make SVM achieve better classification effect. The co-evolutionary algorithm is proposed for the natural evolution of a single algorithm which is prone to misleading and quickly fall into the local extremism. Based on our previous studies, we found that co-evolutionary algorithms [11–13] have good performance in function optimization, constrained optimization and multi-objective optimization problems. In this paper, a dynamic co-evolutionary algorithm (PSO-GA) is proposed to optimize SVM model parameters. The algorithm dynamically adjusts the selection probability of PSO and GA evolution strategy, and obtains the optimal parameters and high precision classification as the design scheme. The experimental results show that the proposed algorithm improves the parameter selection efficiency of SVM, and the obtained parameters are optimal for the classification of test samples.
We will briefly summarize the rest of the paper. Section 2 describes the basic principles and their performance analysis. Section 3 introduces the dynamic co-evolutionary algorithm (PSO-GA) to optimize the SVM parameters, including the choice of coding method and fitness function. It focuses on the probabilistic selection of PSO and GA evolution strategies. Section 4 is the experimental analysis. The validity of the method is verified by remote sensing image data experiment. Finally, the conclusion of the article and the future research direction.
Basic principle and its performance analysis
Classification principle of support vector machines
The mechanism of an SVM is to find an optimal classification hyperplane that satisfies the classification requirement so that the hyperplane can maximize the blank space on both its sides, while ensuring classification accuracy. Taking two classes of data as an example, a training set is given (x i , y i ), i = 1, 2, ⋯ l x ∈ R n , y ∈ { + 1, - 1 }, The hyperplane is written as (w · x) + b = 0. For a classifier to correctly classify all samples and have a classification interval, the following constraints must be satisfied, as shown in Equation 1.
We can calculate the classification interval 2/∥ w ∥, and therefore, the problem of constructing an optimal hyperplane is transformed to
In high-dimensional space, if the training sample is inseparable, or if it is unknown whether it is linearly separable, a certain number of misclassified samples will be introduced, and a non-negative relaxation variable ζ i will be introduced. The above problem is transformed into a quadratic programming problem with linear constraints as shown below.
However, in actual classification, it is difficult to ensure linear separability between categories. For linearly indivisible cases, the SVM introduces the kernel function, maps the input vectors into a high-dimensional eigenvector space, and constructs an optimal classification surface in the feature space. Owing to the superior performance of the radial bias function (RBF) kernel function, it is chosen as the kernel function of SVM in practical applications, as shown below.
As an adaptive global optimization search algorithm, for the GA, the selection, crossover, and mutation of the three operators become key factors in optimizing the population and maintaining the diversity of solutions. The basic implementation process is as follows:
Initialization: Identify the population size N, Crossover probability p
cross
, Mutation probability p
mutation
, and the termination of evolutionary criteria. Individual evaluation: Calculate the fitness of each individual. Population evolution: The probability that an individual is selected is proportional to its fitness function value. This selection can be carried out using two types of genetic operators, which are:
Crossover operator: The next generation of new chromosomes is created by exchanging some of the chromosomes in accordance with the crossover probability p
cross
. Mutation operator: Certain characteristics of individuals in the population are randomly changed in accordance with the mutation probability p
mutation
. Terminate the test: Once the termination criteria have been met, output the optimal solution; else, go back to b).
Basic principles of particle swarm optimization
PSO is a new evolutionary algorithm developed by Kennedy and Eberhart [14]. It is derived from behavioral research on predatory birds. The particles are optimized within the search space and locate their own best position in the current path. Each particle needs to consider its current position and velocity, record their own optimal solution (optimal position) pbest, and adjust the current position according to the global optimal solution gbest in the particle population.
Effect of support vector machine parameters on classification performance
The SVM classifier with RBF as its kernel function has two adjustable parameters, kernel function parameter σ2 and error penalty factor C. The kernel function parameter σ2 mainly affects the complexity of the sample data distribution in the high-dimensional feature space, and the error penalty factor C adjusts the confidence range and empirical risk ratio of the learning machine in the determined feature space [15]. Therefore, in order to obtain the SVM classifier with the best generalization ability, we should first apply the appropriate σ2 mapping data to the appropriate feature space, and then find the appropriate C for the determined feature space so that the confidence range and empirical risk ratio of the learning machine are at an optimal level. In addition to optimizing C in the same feature space to obtain the optimal SVM for the space, we also optimize the kernel function parameters σ2 to obtain the global optimal SVM.
Dynamic Co-evolutionary algorithm (PSO-GA) for optimizing SVM parameters
Algorithm design ideas
According to the no free lunch (NFL) theory [16], there is no optimal algorithm for all problems. However, for some optimization problems, the optimal algorithm can be designed by co-evolution to improve performance. From the point of view of structure, co-evolutionary algorithms are divided into two types, those that employ serial cooperation [17–19] and those that employ parallel coordination [20, 21]. Serial cooperation refers to the sequential execution of multiple evolutionary strategies in each generation; based on probability and historical information, the optimal evolutionary strategy applicable to the current evolution will be selected from amongst a number of strategies. Compared with serial cooperation, parallel coordination is more adaptable, while its time complexity is lower, when applied to various optimization problems. The proposed strategy based on dynamic co-evolutionary algorithm (PSO-GA) is suitable for SVM parameter optimization. The advantage of PSO lies in its large memory and quick convergence rate; however, it easily falls into the local optimum, showing strong convergence and low population diversity. The GA algorithm calculates probabilities to retain some potential optimization ability of the candidate solution in order to improve the diversity of the population; however, its convergence rate is relatively slow. The combination of the two evolutionary computing methods not only guarantees global search capability, by preventing the algorithm from being stuck in the local optimum, but also ensures high evolutionary speed. The basic flow of dynamic co-evolutionary algorithm (PSO-GA) is shown in Fig. 1.
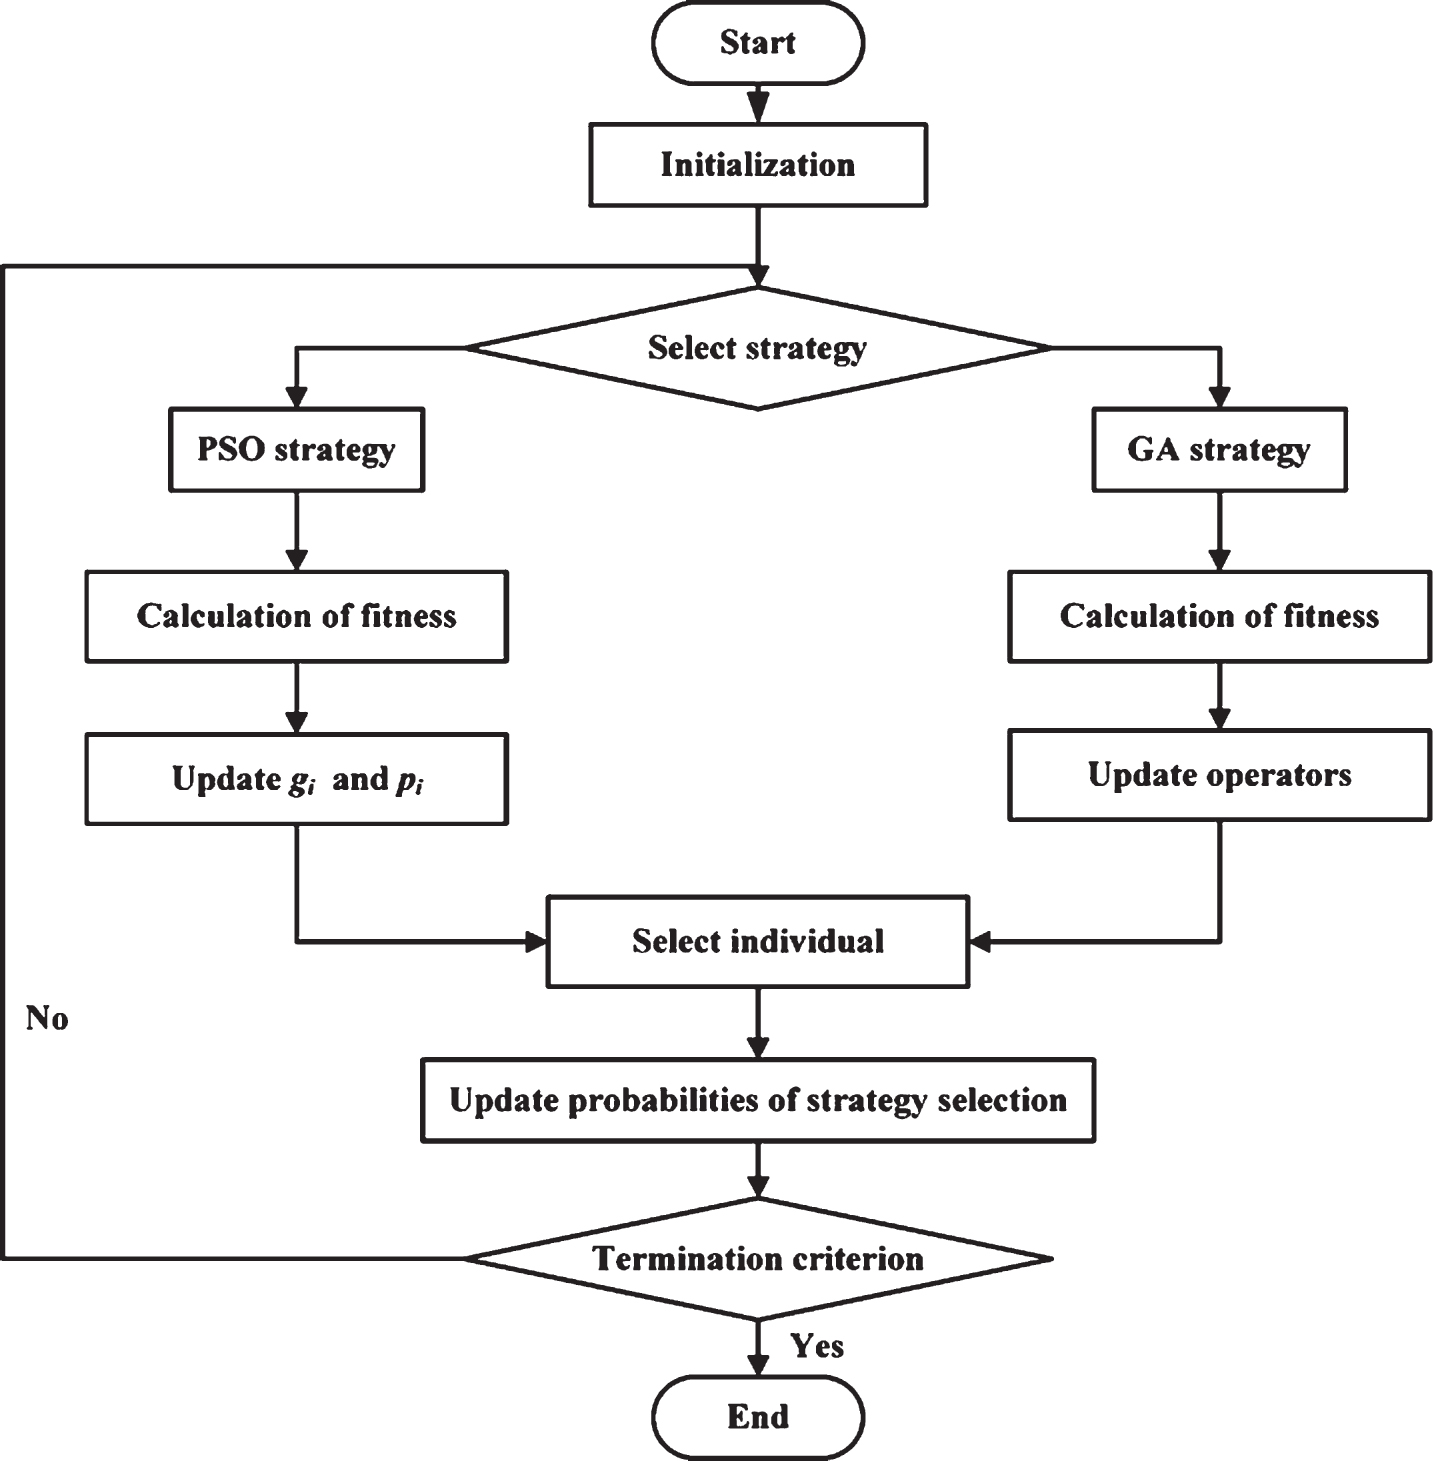
Flow chart of dynamic co-evolutionary algorithm (PSO-GA).
In this study, because the two SVM classifier adjustment parameters for the real number, so the use of real number coding. This kind of encoding method is faster and reaches a stable global optimum. Coding of such real numbers is the method used in the present study [22]. Each individual is represented by the vectors in Equation (5) below.
According to this coding method, the kernel function parameter optimization problem is transformed into the problem of finding the best individual.
The co-evolutionary strategy proposed in this paper needs to evaluate the individual; therefore, we find a fitness function that can evaluate the kernel function parameter as an individual. In this study, we choose the classification and recognition precision as the fitness function. The fitness function is:
Where TP is the number correctly divided into positive cases and FP is the number that is incorrectly divided into positive examples.
Initial population and parameters
Let N be the population size, G be the iteration number, φ1 be the GA crossover probability, φ2 be the mutation probability, λ1 and λ2 be the harmonic factors in PSO, γ1 be the minimum disturbance factor, γ2 be the maximum inertia disturbance factor, and f be the fitness function. The initial population consisting of N individuals was randomly generated. Each individual can be represented as a binary vector
At the beginning of the Kth generation, the PSO-GA co-evolutionary algorithm selects the evolutionary strategy according to the strategy selection probability.
PSO evolutionary strategy
The PSO evolutionary strategy used by PSO-GA adjusts the particle’s current velocity in the search space Ω by using the optimal position g
i
of the population and the historical optimal position p
i
of the individual. The k + 1 generation candidate solution is generated according to X′(k+1) in Equation 7.
The optimization problem to be solved by the GA evolution strategy used by PSO-GA can be defined as:
where f is a real-valued function, X = {x1, x2, ⋯, x m } T is the variable set in R N space, Ω is the set of all feasible solutions, and σ2 ∈ [0.01, 50], C ∈ [1, 1000].
After the evolution of the kth generation, the final offspring X(k + 1) is selected from |X (k) ∪ X′ (k + 1) | individual based on the rotation disc selection. The specific approach is as follows: the relative fitness of the individual is the probability of the individual surviving in the next generation, and each individual is given the opportunity to be selected based on its relative fitness. The steps to implement this strategy are as follows:
After the evolution of the kth generation, according to a sub-individual in X(k+1) and its corresponding parent individual X(k), the following dynamic update is made to μ(k):
For an individual of the X(k+1) generation, the number of individuals from different parental evolution strategies is calculated. If the majority of individuals in the generation are from the parental evolution strategy h, the evolution strategy h used by the Kth generation is the current advantage strategy. In order to make the evolution process converge as soon as possible, the probability of selection μ(k) (h) of the evolution strategy h should be increased, and the probability of selection μ(k) (l) of other evolution strategies l should be reduced, to satisfy Equation 12 as follows:
Data preparation and classification system
The control points were evenly selected using Landsat TM5 images (track number 120/27) with a resolution of 30 m on June 14, 2015. By quadratic polynomial geometry correction to Albers Equal Area Conical projection, the research area was restricted. The digital elevation model (DEM) was constructed by using the 1:50000 topographic model of the Zhalong protected area. Considering the morphological features of the study area, the study area was divided into six types of landforms: cultivated land, grassland, marsh wetland, water body, residential area, and unused land.
Feature extraction
The following features were selected:
Spectral features: The gray values of TM1–TM5 and TM7 are selected as the characteristic variables. Since wetlands are dominated by water and land vegetation, the normalized difference vegetation index (NDVI) is calculated, and the image space is passed through the hat transform.
Based on this transformation, green degrees, brightness, humidity are generated as three bands of space. Ten spectral features are constructed which contain the above three bonds, six TM bands and NDVI.
Texture features: A large number of experiments show that texture analysis based on gray level co-occurrence matrix can improve the accuracy of remote sensing classification. Considering the landscape types of the study area and the landscape form of the plain area, windows with dimensions 3×3, 5×5, 7×7, 9×9, and 11×11 are used as the windows of the texture calculation. According to the method of Z-test [23], the difference of two different texture measurements is calculated. Finally, seven optimal texture bands are identified, namely green degree entropy, the fourth band entropy, the mean of green degree, the third band Entropy, the mean of fourth band, the first band entropy, and the seventh band entropy, which derive 5 texture windows respectively. A total of 35 texture bands constitute texture feature.
GIS (Geographic Information System)-assisted features: DEM, slope, aspect, geomorphology, and soil map of the study area were transformed into raster data. After resampling, the data were overlapped with the remote sensing data to form five GIS-aided feature variables.
Classification accuracy of SVM optimized with dynamic co-evolutionary (PSO-GA)
Classification accuracy of SVM optimized with dynamic co-evolutionary (PSO-GA)
Overall accuracy = 93.33% Kappa coefficient = 0.92.
Classification accuracy of SVM optimized with GA
Overall accuracy = 87.91% Kappa coefficient = 0.855.
Classification accuracy of SVM optimized with Grid search
Overall accuracy = 85% Kappa coefficient = 0.82.
Six types of objects selected 300 training samples, as far as possible to ensure that all belong to the “blueprint”, evenly distributed throughout the study area. In this paper, the experimental environment is Matlab 2014a, using the Taiwan University Professor Lin Zhiren LibSVM to build SVM model. The population size is 50, the number of iterations is 200, the GA crossover probability is 0.5, and the mutation probability is 0.01. The harmonic factors λ1 and λ2 in PSO are set to 2, and the minimum perturbation factor γ1 and the maximum inertial perturbation factor γ2 are set to 0.4 and 0.8, respectively. Cross validation method for testing training models. Finally, the optimal parameter σ2 of SVM kernel function is 17.336 and C is 91.453, and the training precision is 95.18%. The same training samples were selected using the LibSVM grid search and the genetic algorithm. The optimal parameter σ2 of the grid search is 0.027 and C is 36.33, while training precision is 96.7%. The optimal parameter σ2 of genetic algorithm is 12.65 and C is 84.75, while the training precision is 93.66%.
Classification and accuracy verification
Using the SVM classifier under ENVI4.7 remote sensing software, the radial basis function is used as the type of kernel function. The SVM classifier with the optimal parameters determined by three methods is used to classify the whole remote sensing image. The classification results are shown in b, c and d in Fig. 2.

Zhalong wetland remote sensing classification results. a: TM image (7,4,3). b: classification results of grid search optimization SVM. c: classification results of genetic algorithm optimization SVM. d: classification results of dynamic co-evolutionary (PSO-GA) optimization SVM.
In order to verify the validity of the proposed algorithm, this paper uses the GPS sample points in June 2008 and June 2009, and selects the test samples according to the land use status chart. The results of the three methods are verified by the precision.The results are shown in Tables 1–3.
Comparison of dynamic Co-evolutionary (PSO-GA) and GA
According to Fig. 2 and Tables 1–3. Fig. 2(c) and (d) are the same as the evolutionary strategy optimization SVM wetland remote sensing classification, the overall classification is similar. Because the scale of the study area is too large, it is difficult to see the significant difference, so choose the local further observation of two different evolutionary algorithms to optimize the SVM. As shown in Fig. 3.
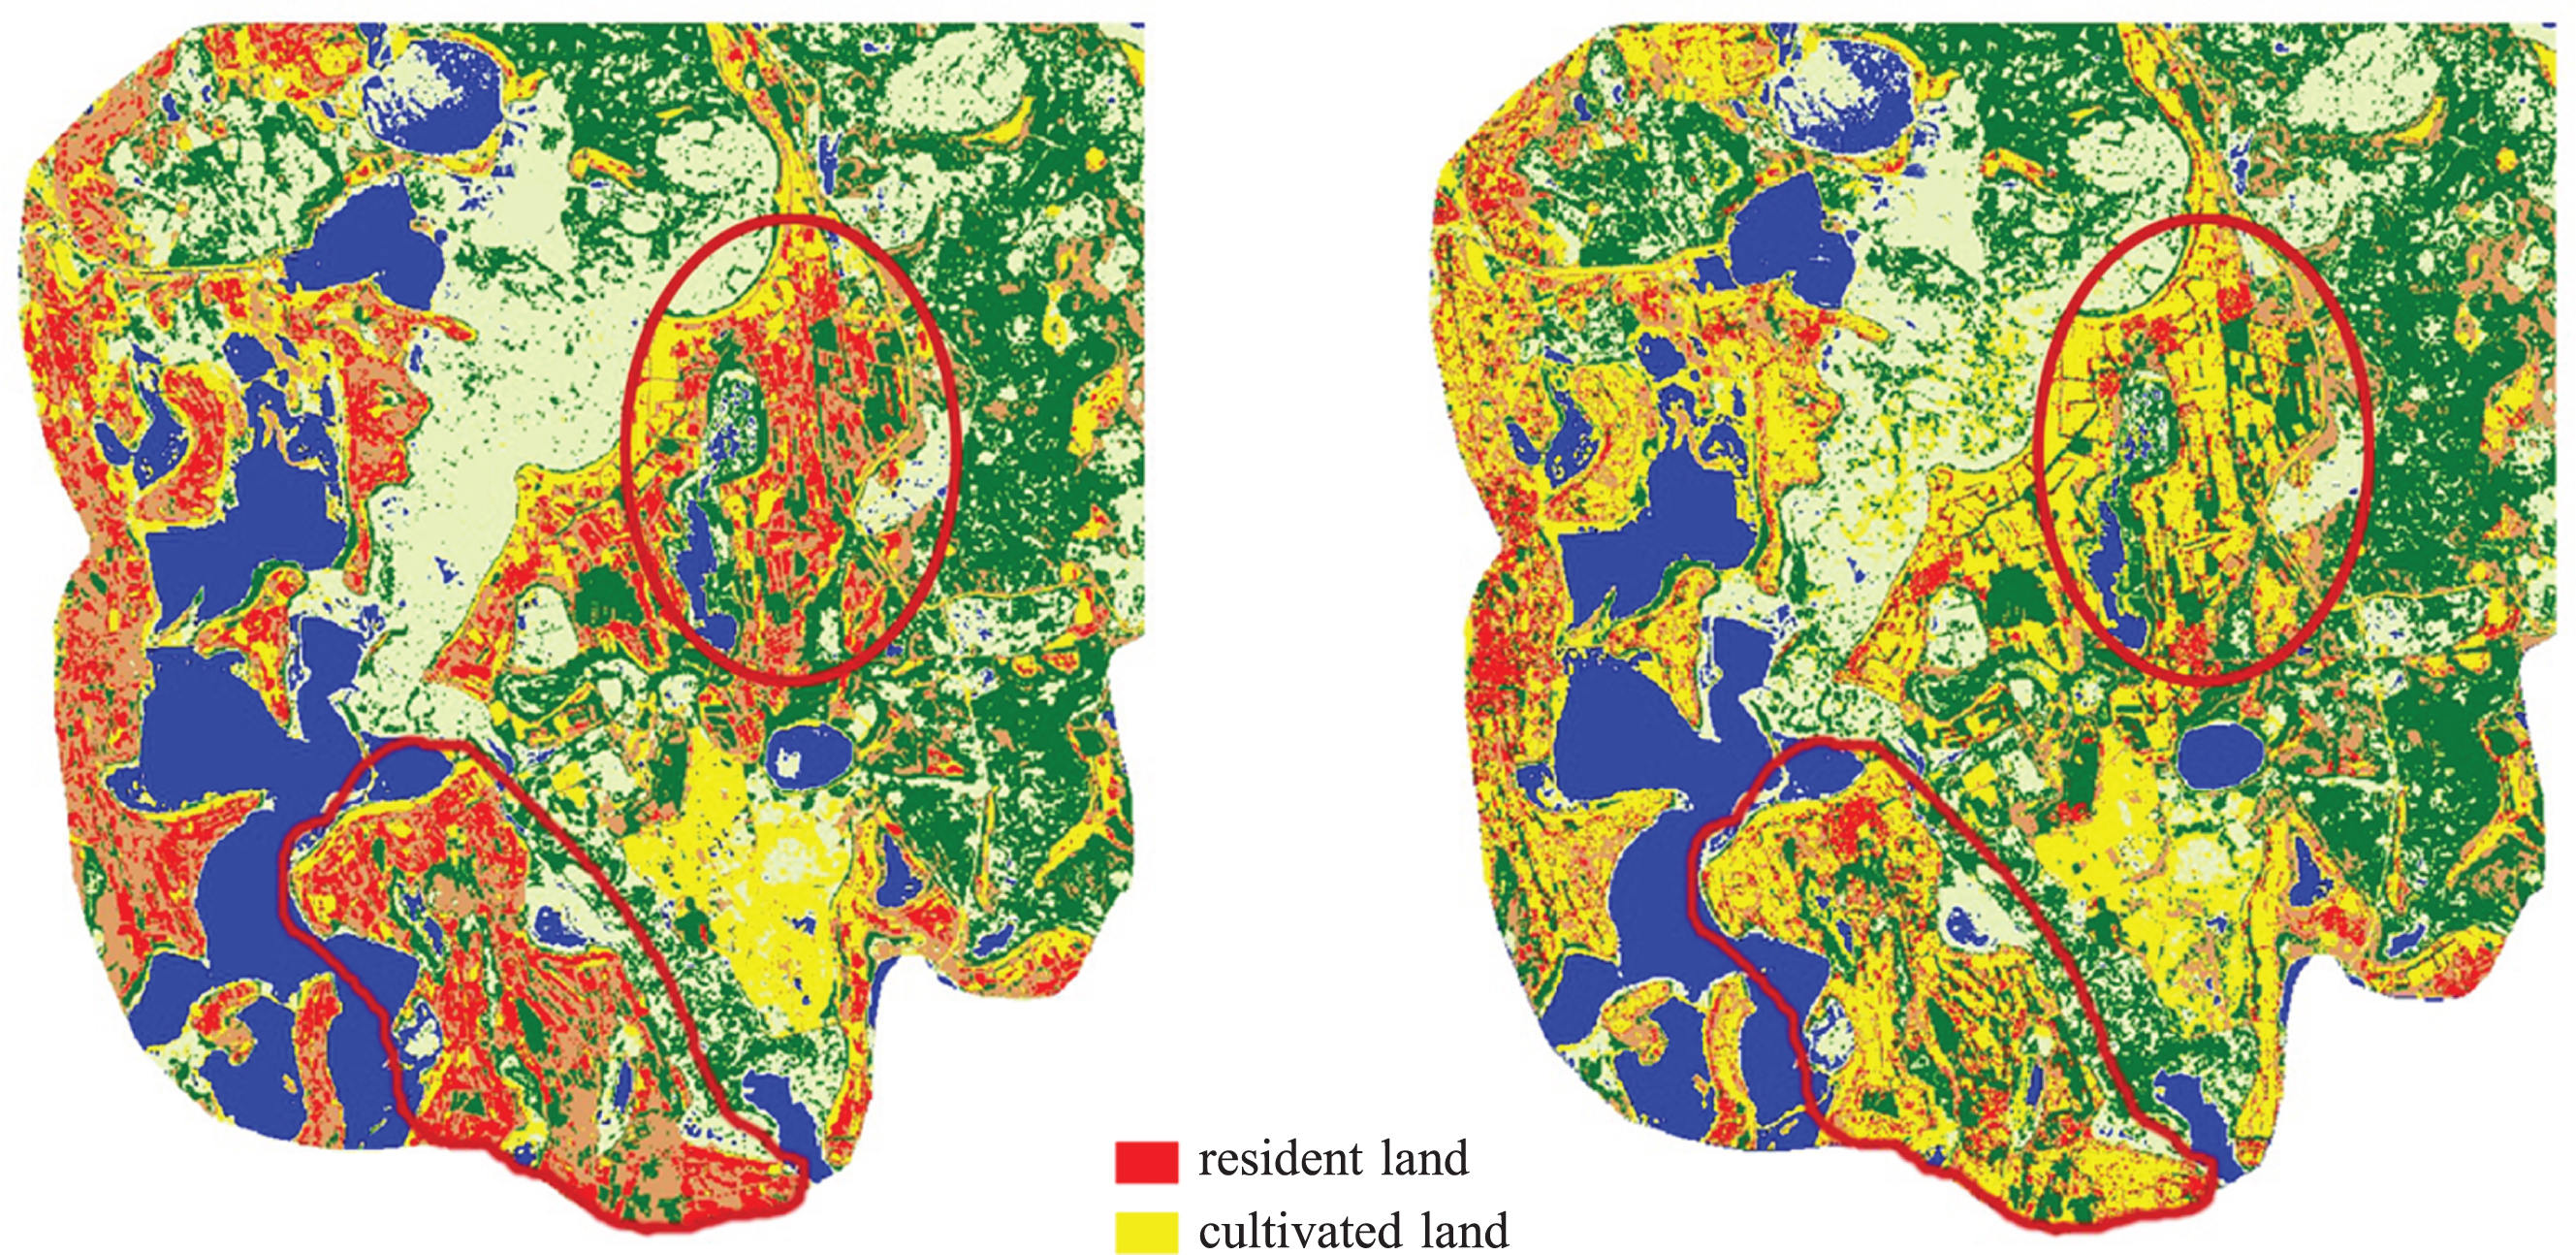
The comparison of partially enlarged classification results. (a) Partial Classification Result of SVM Optimized by Genetic Algorithm. (b) Partial Classification Result of SVM Optimized by Dynamic Co-evolutionary (PSO-GA) Algorithm.
According to the field verification, it can be seen from the red circle that the classification results of SVM Optimized by GA will most of the cultivated land is divided into residential areas, and other local areas have different degree of mixed phenomenon.
Comparing Tables 1 and 2, the dynamic Co-evolutionary Algorithm (PSO-GA) optimized SVM is compared with the SVM remote sensing classification optimized by GA. Accuracy is improved to varying degrees in different terrain, especially in grassland and cultivated land. The precision of the drawing is increased by 17% and 12% respectively, and the precision of the users is 17.5% and 10% in the residential and cultivated land.
Figure 2(b-d) and Tables 1–3 shows the comparison. The grid search optimized SVM classification cannot distinguish grassland, cultivated land, residential land between the three, the phenomenon of mixed between the serious. There are obvious mixed phenomena in the classification of SVM with the grid search optimization. In the combination of multi-source information, the mapping precision is 60% and the user accuracy is 30%. The GA optimized SVM has improved the accuracy of cultivated land classification, the mapping accuracy is 65.96%, the user precision is 77.5%. The dynamic co-evolutionary (PSO-GA) optimized SVM has a significant improvement in the classification of cultivated land. The accuracy of the mapping is 77.78%, the user precision is 87.5%, and the precision is nearly 58% higher than that of the grid search optimized SVM. It can be seen that for the complex ecological environment of cultivated land, the SVM classification of two kinds of evolutionary strategies is higher than that of grid search optimization.
Conclusions
In this paper, the dynamic co-evolution (PSO-GA) algorithm is proposed to optimize SVM parameters. The method is used to dynamically adjust the selection probability of evolutionary strategy for different characteristics of GA and PSO optimization. The experimental results show that the optimal parameters obtained by this method are better than other optimal parameters classification results. The research of this paper optimizes the SVM parameters and improves the accuracy of remote sensing image classification. In the subsequent research, we try to introduce other evolution strategies, such as artificial bee colony algorithm, combined with the existing co-evolution (PSO-GA) algorithm to absorb the evolutionary advantages of each algorithm and form a multi-strategy co-evolution process. At the same time, the optimization of remote sensing classification of SVM is only used as one aspect of co-evolution (PSO-GA) algorithm. For other combinatorial optimization problems, the conversion method and fitness calculation method based on problem-inspired solution need to be designed, and further verify the adaptability of co-evolution (PSO-GA) algorithm.
Footnotes
Acknowledgments
We would like to acknowledge the support from the National Science Foundation of China (Nos. 61472095, 61502116) and Heilongjiang Provincial Education Department Key Laboratory of Intelligent Education and Information Engineering, Harbin Science and Technology Innovation Talent Project (No. 2016RAQXJ032).