
Abstract
The research of face recognition began in the 70s of last century. With the rapid development of science and technology and computer technology, it has been used in the application of property management, which has become a new research direction. Based on this, the research status of intelligent property and face recognition at home and abroad was investigated. On this basis, the concept and principle of face recognition technology were analyzed, and PCA algorithm was proposed for face recognition. According to the basic theory of PCA algorithm, it was applied to face recognition technology. The principle of PCA algorithm was proposed, and the principal component analysis method was deduced and applied to face recognition. According to the performance of PCA algorithm in face recognition technology, a new wavelet transform method was used in face recognition algorithm. After extracting the facial feature vector, the wavelet transform method combined with PCA algorithm was obtained. Finally, the proposed algorithm was applied to intelligent residential property management system. The results show that the algorithm can effectively improve the recognition accuracy and can meet the design requirements, which provides a theoretical basis for the subsequent system research.
Introduction
With the improvement of the economy and the progress of society, people’s pursuit of living conditions has also undergone tremendous changes. Where housing is located and housing safety are also top priorities. And whether housing security depends on its access control system, housing security measures and residential security measures is studied [1]. In our country, access control types mainly include magnetic card equipment, fingerprint identification and password input. Although the discriminant method is different, it is necessary to make people to do the appropriate operations access to the access control system. If people do not have the space to do this series of actions, this access control system is not enough humanized [2]. Then, the loss of access control card, password forgotten and even the risk of theft reveal the security problems of this access control system. In view of fingerprint identification system, according to the spread of information on the Internet, there is a set of software to crack fingerprint lock, which makes this access control device users very uneasy [3]. The research and development of access control system which can really guard against theft and simple intelligence is expected by people, which is the promotion of this demand. A new entrance guard system “face recognition system” comes into being. Its emergence has solved a considerable part of the security problems [4]. Face recognition is a new biometric technology, which uses human face feature information to determine whether to make the next move. The uniqueness of the face and the inability to replicate allow this biometric to become a good discriminant system. This technology is applied to the access control system, which calls it the face recognition access control system. This new biometric technology uses face recognition to judge whether to perform the act of opening the door or not. It does not require any external media. It can be said that this greatly reduces losses caused by the theft of keys or key risks and also objectively reduces the manufacturing cost [5].
At present, many research institutions in the world are studying face recognition technology, and have established a lot of professional face recognition research institutions. Through decades of in-depth research, face recognition has been widely used in intelligent image recognition and intelligent image analysis field. A large number of experiments and simulations have been carried out by relevant researchers, and more recognition algorithms have been proposed. Many of these algorithms are gradually used in commercial markets, such as BioID’s face recognition products. In the world, the research of face recognition technology can be divided into the following research directions: Method of face recognition based on geometric features, face recognition method based on template matching, a method of feature face based on K-L transform, method based on hidden Markov model, Identification method based on neural network, elastic graph matching method based on dynamic link structure and method of face recognition based on dynamic image sequence number using motion and color information. Domestic research is mainly focused on the study of three major methods: Human face automatic recognition method based on geometric features, automatic face recognition method based on Algebraic Features and face automatic recognition method based on connection mechanism. So far, these research units have made some achievements in face recognition technology.
Face recognition.
Face recognition technology
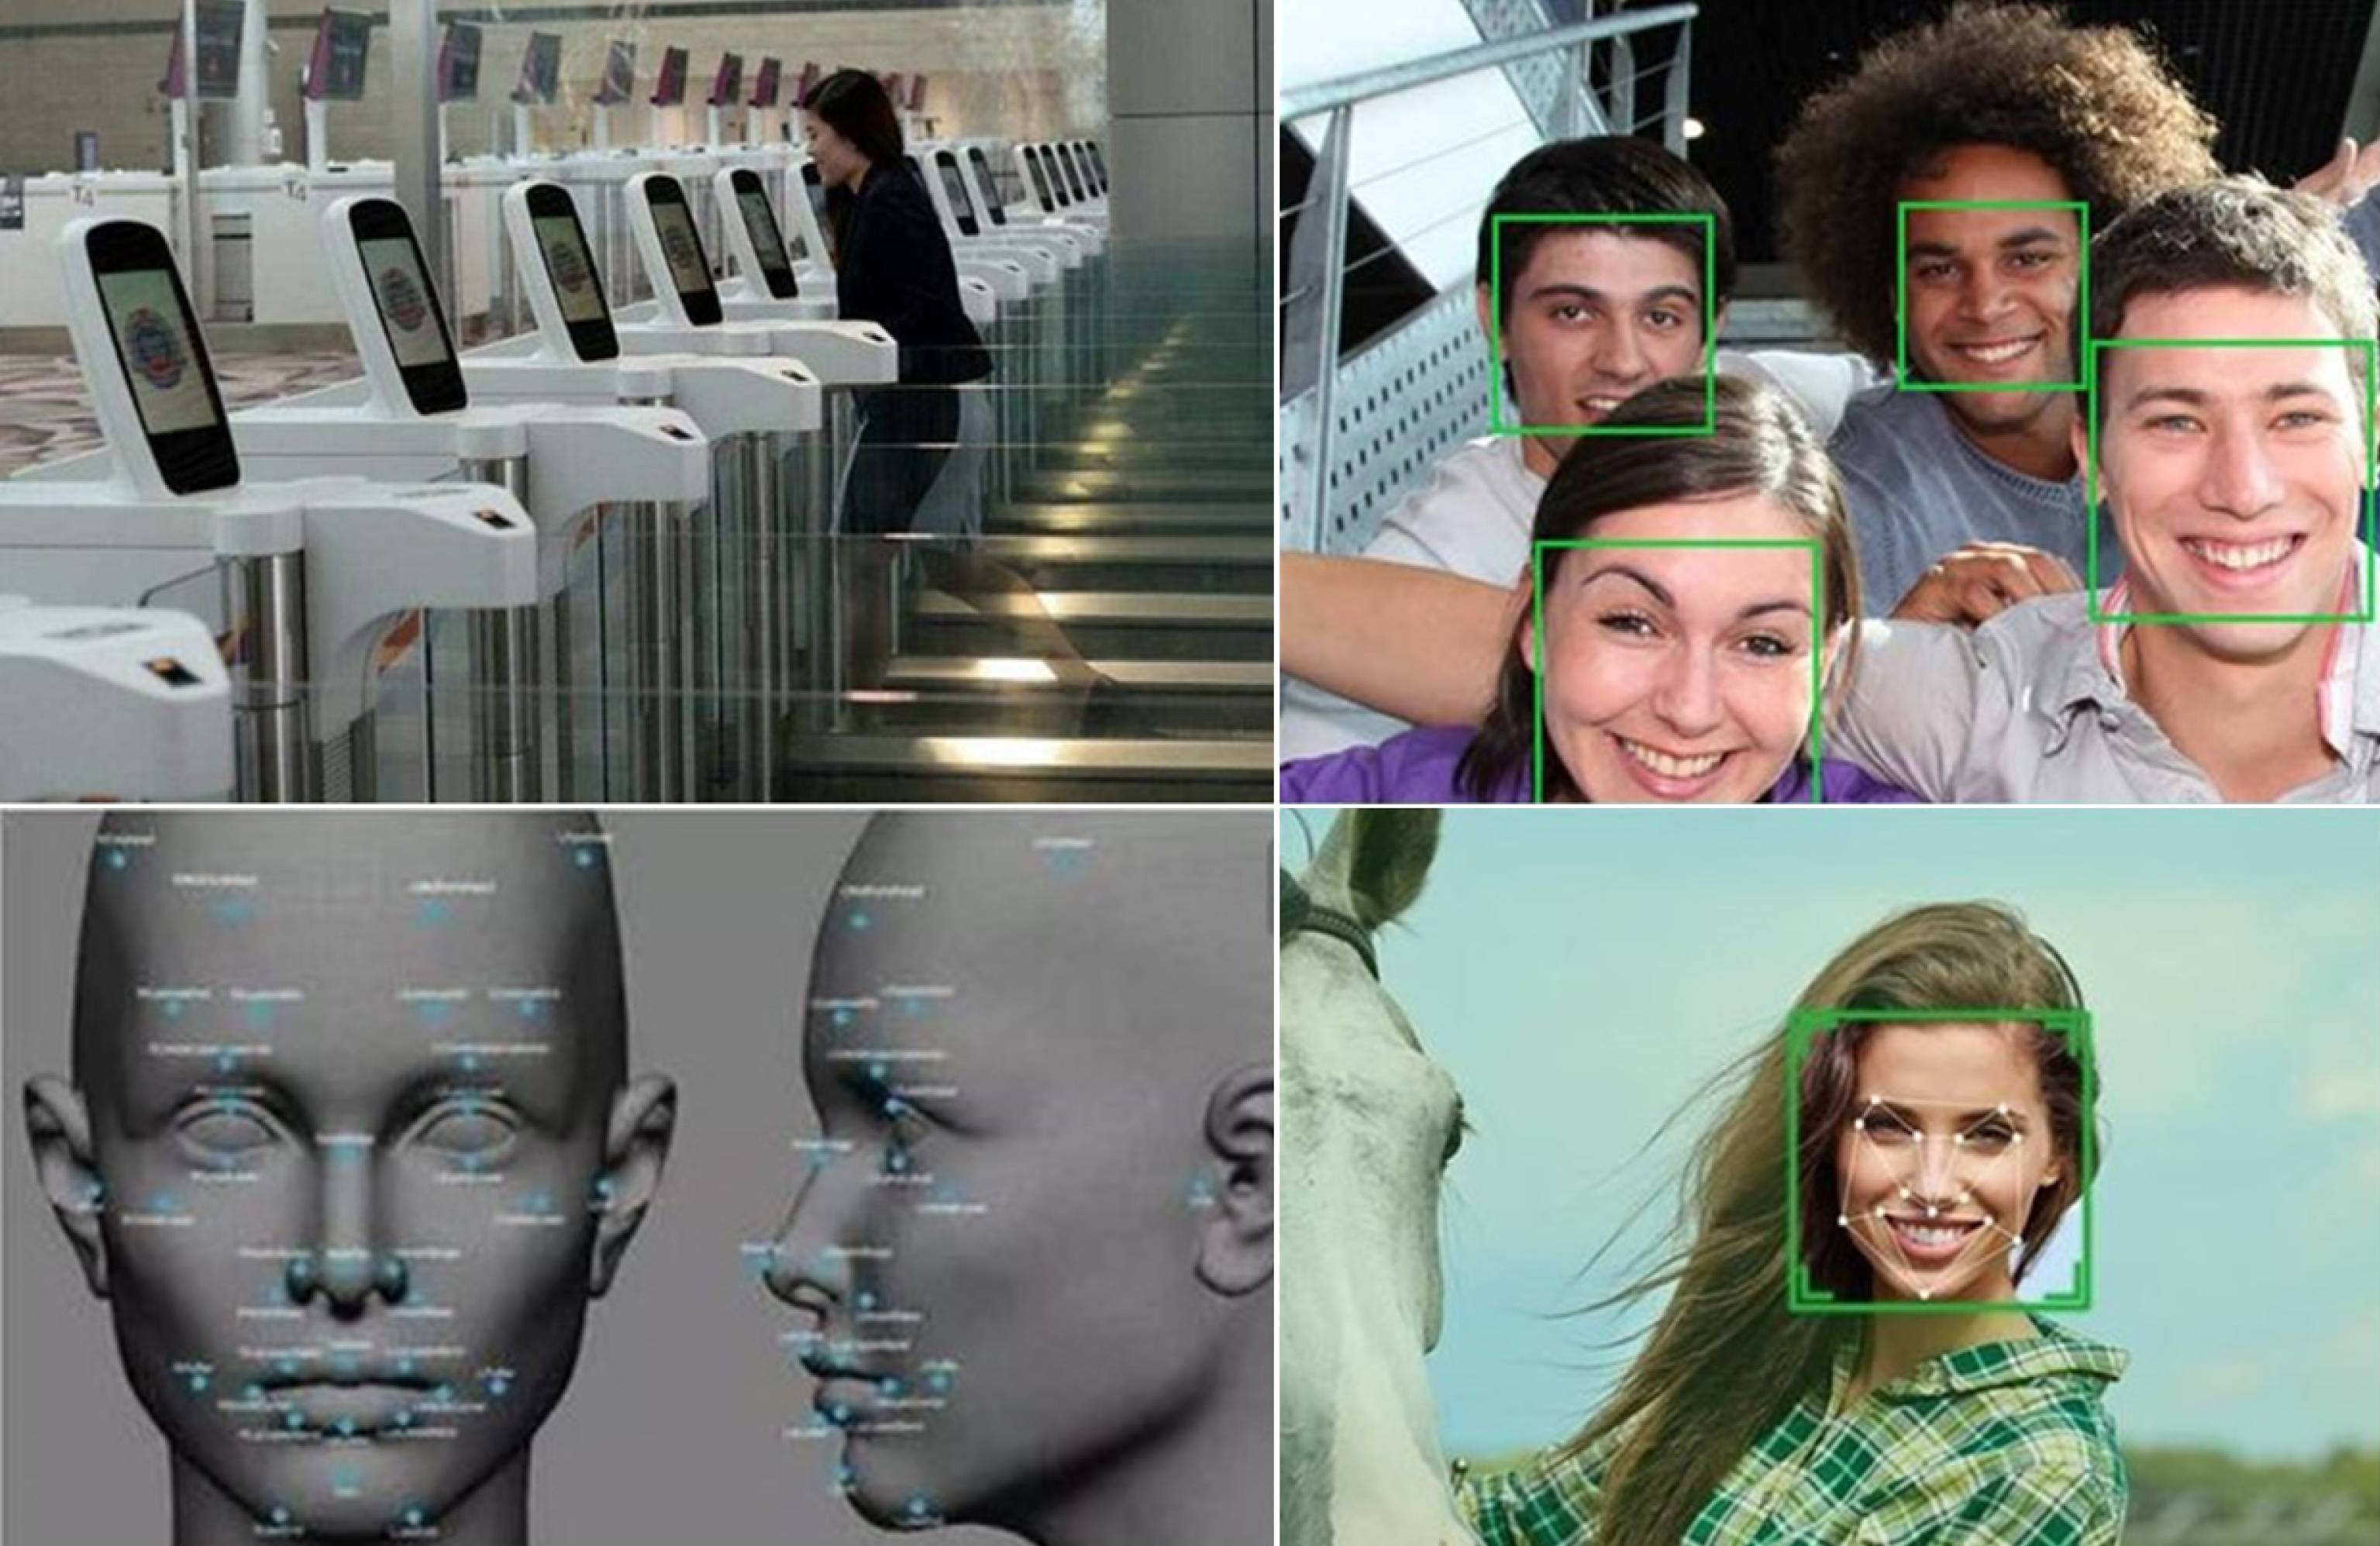
The process of face recognition technology can be roughly divided into two aspects and stages. (1) Recognition. When a human face image appears within the recognition range, the recognition system will extract the facial features of the face image, and process, transform and store these features. (2) Discrimination. In view of the facial features acquired by the previous person, it is compared with the “correct” information identified to judge whether to perform the next operation [6]. This is a simple basic process of face recognition system for human identification. To sum up, it is divided into the following sections. (1) To find the person’s face within the scope of the identification and location of facial information is conducted. (2) Features of the appropriate area of the face are collected. (3) The collected features are translated into computer language. (4) Whether the acquisition information is in the “correct” range is determined, and whether the next operation is carried out [7].
As far as the face recognition system is concerned, there are 3 kinds of recognition methods. (1) In view of the discrimination of facial image features, the main principles used in this aspect are elastic graph matching method, linear subspace class method and correlation method. (2) The collected information is classified step by step, and the main usage principles are Bayesian method and artificial neural network method. (3) The main principle of facial image reconstruction is the facial feature method [8]. But no matter which method and the principle is adopted, human face recognition is based on gray information acquisition. That is to say, by processing the feedback image of the human face in the recognition system, the gray information which is easy to identify but different from the ordinary picture can be obtained. On the one hand, it can reduce the influence of human face organs on discriminant results. On the one hand, it can speed up recognition speed [9].
PCA algorithm
Principal component analysis (PCA) is a technique for reducing dimensionality and extracting features in computer vision. It is considered to be one of the effective methods for face recognition. Sirovish and Kirby first proposed the application of Karhunen-Loeve transform to represent human faces. That is to say, the human face is characterized by the face vector which is a linear combination of weighted eigenvectors. The PCA algorithm takes the face image as a random vector, and uses K-L transform to obtain the orthogonal transformation basis of all the face space samples. These basic vectors have similar shapes to human faces, and represent the features of human faces which are different from other objects. Therefore, they are called facial vector. PCA does not collect individual features
Face recognition flow chart.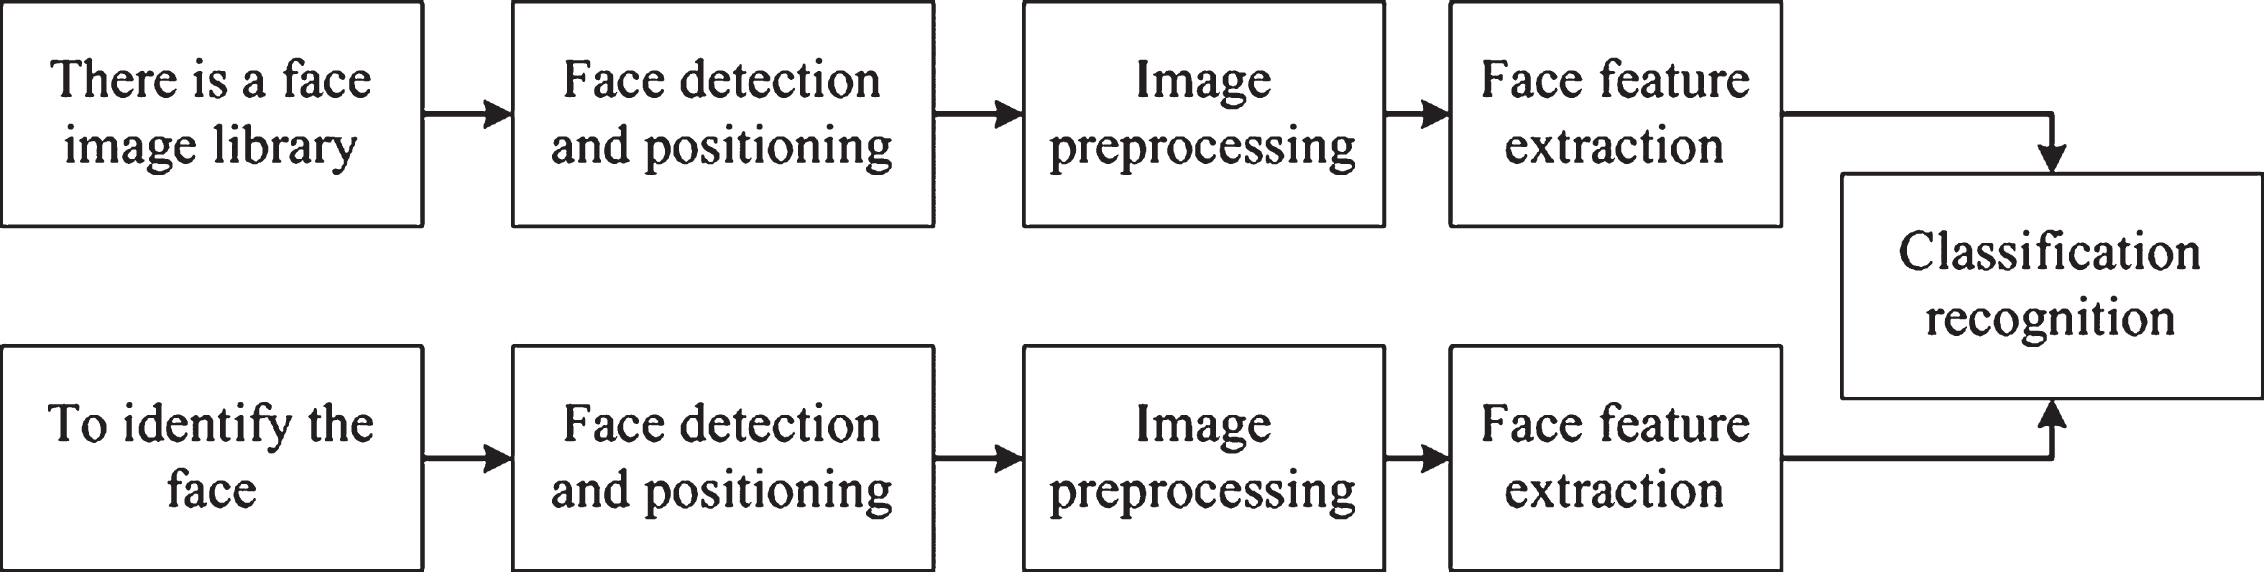
The basic principle of PCA method
In a two-dimensional space m × n, the collected face image I (x, y) is placed into gray image. Vector X is represented by N = m × n. Then the facial feature set is {X
i
|i = 1, …, M}. Among them, M represents the total. The distribution matrix S
t
of N × N based on vector feature is constructed.
μ represents the mean vector.
ω1 ⋯ ω
d
is set as the projection axis. Its arithmetic meaning is to make the function product value be the extreme value, and the physical meaning is the maximum of projection quantity.
It can also be represented as:
The Rayleig entropy and its extremum principle are calculated by the upper formula. Therefore, the optimal projection axis can be chosen as the orthogonal vector corresponding to the largest eigenvalue of S t .
The calculation process is that the eigenvector v
l
(l = 1, ⋯, M) of a small matrix M × M is computed firstly.
The eigenvector μ l (l = 1, ⋯, M) of the matrix S t is obtained by linear combination of the difference image X1 - μ (l = 1, ⋯, M) and v l (l = 1, ⋯, M).
The d eigenvectors of the largest eigenvalues of before L are computed, and d is determined by threshold θ λ .
A simple face recognition system consists of 4 processes. (1) Face database is read and written, and feature vectors and eigenvalues are recorded. (2) The samples collected were compared with the original samples. (3) The data of each feature contrast are analyzed. (4) The result is judged and whether to perform the next step operation is judged [12]. The detailed process is as follows.
Reading and writing face database. This design uses the ORL face database (Human face database of university of Cambridge Library), and the face library records a total of 40 people’s data. Each person records 10 images [13]. Acquisition requirements are as follows. In different periods, the details of the face are different, such as whether the eyes open, whether people have glasses and people’s facial expressions and so on. In addition, the shooting angle is different and the rotation angle is between 10 to 20 degrees. The resolution of University of Cambridge face database images is 112×92. In the 400 images of the library, each of the first five pictures of each person is set as our training picture. These pictures form a set of training pictures. The remaining 200 pictures are the test images, which forms a test set [14]. It is not difficult to calculate that vector value formed by these images is 10304, so the training matrix is 10304×200.

Average face.
The provisions matrix S
t
is taken the overall distribution matrix of training samples.
Among them, X i represents the vector of the first i image in the sample set, and μ is the average vector of the sample set. Since the total number of samples is too large, the computational complexity increases exponentially when the eigenvector is solved, so the SVD theorem (singular value decomposition theorem) is used as follows.
The SVD theorem is used for solving eigenvalues and eigenvectors. Definition of SVD theorem is as follows.
If there is a A ∈ Rm×n matrix, there is orthogonal matrix U = { μ1, μ2, ⋯, μ
m
} ∈ Rm×n, V = { v1, v2, ⋯, v
n
} ∈ Rm×n so that U
T
AV = diag (σ1, σ2, ⋯, σ
p
) = W, p = min(m, n). That is A = UWV
T
, and A is called singular value decomposition. Among them, σ1 ≥ σ2 ≥ ⋯ ≥ σ
p
≥ 0, σ
i
(i = 1, 2, ⋯, p) is the singular value of A, and is the square root of the value of the characteristics of AA
T
or A
T
A that is
Good stability is a major feature of the singular value vector, and this feature makes the image noise, illumination difference caused by gray change has little impact on the results [15].
This method is called the eigen face method, which means that the system uses feature vectors to represent one of its corresponding faces. So, the training picture is constitutes a feature vector diagram in the first dimension space. When the feature vectors of the test image are consistent with the training feature vector graph, it is recognized that it is successful and it is the basic principle of face recognition. The characteristic value and characteristic vector calculation methods are as follows. (1) Building the matrix according to the original gray level data. (2) The eigenvalues and eigenvectors of the matrix are calculated. (3) Eigenvalues and eigenvectors calculated are collated.
30 faces are selected, which are shown in the Fig. 4.

30 Feature faces.
Projection of feature samples and its recognition: The eigenvalues and eigenvectors obtained of each group are placed in the feature dimension space. The eigenvalues and eigenvectors of each image can form a feature point and line combination graph according to the coordinate coefficients [16–18]. The K-L transform coefficient is its weighted coefficient.

Portrait reconstruction map.
Face construction graph recognition: The simplest comparison method is to compare which eigenvalues, eigenvectors figure is closest to original gray eigenvalues and eigenvectors figure. The distance of the object is used to be identified and determine the identity of object [19]. In measuring distance, the commonly used methods are: Ming’s measurement method, European measurement method, Markov measurement method and absolute value measurement method [20]. In the feature space, the distance between the identified feature and the original feature is compared, and a sample with the smallest distance is found out. In the selection of various measurement methods, a number of samples are used to calculate the average of each measurement method to judge which method is the most accurate and reliable. The experimental procedures are as follows. The k samples are selected, and the characteristic distance of each sample was measured by European method, absolute value method, Markov measurement method, and Ming’s method respectively. It is necessary to find out the most similar samples in the results, and according to this method to compare the distance between each group of eigenvalues and eigenvectors.
Feature extraction of human face has three main processes. (1) In order to eliminate unnecessary disturbance factors, the results are accurately calculated. In order to improve the calculation process in analysis, in the face of acquisition, effective regional analysis and calibration of acquisition are carried out. (2) According to the collected human facial images, it includes the countless facial vectors. In order to obtain the eigenvalues and eigenvectors, the face feature can be obtained from the facial feature without the popularity of the face, and the face can obtain a planar dimension map about the eigenvalues and eigenvectors. (3) Through the comparison of the different dimensions of scale plane graph, the smaller variation values are selected as the original gray data.
According to scientists’ research on facial geometric features, the proportion of the main features of the face is shown in Fig. 6. In the graph, the o point is the middle point of the human eye. It is stipulated that the lower boundary of this point to the image is 1.5 d, and the distance between the point and left and right boundaries of the image is d, and the distance to the upper boundary is 0.5 d. The image is cut into squares (2d, 2d). These simple rules and procedures allow computers to reduce the computation time of later data. The cut of face structure proportion also reduces the extraction of the raw data of the face, and objectively reduces the influence of external factors on the collected data. In a survey of biometric facial recognition, there are three gray features in the face that are not clear, including human eyes, nose and mouth. Therefore, in the collection of data, the nose parts do not make the corresponding feature vector extraction, but the corresponding data acquisition and analysis are carried out for the eyes and mouth area as the analysis sample. The facial scale diagram is shown in Fig. 6. According to the gray entropy and gray values and other related theoretical knowledge, the collected eye and mouth characteristics are collected and analyzed.
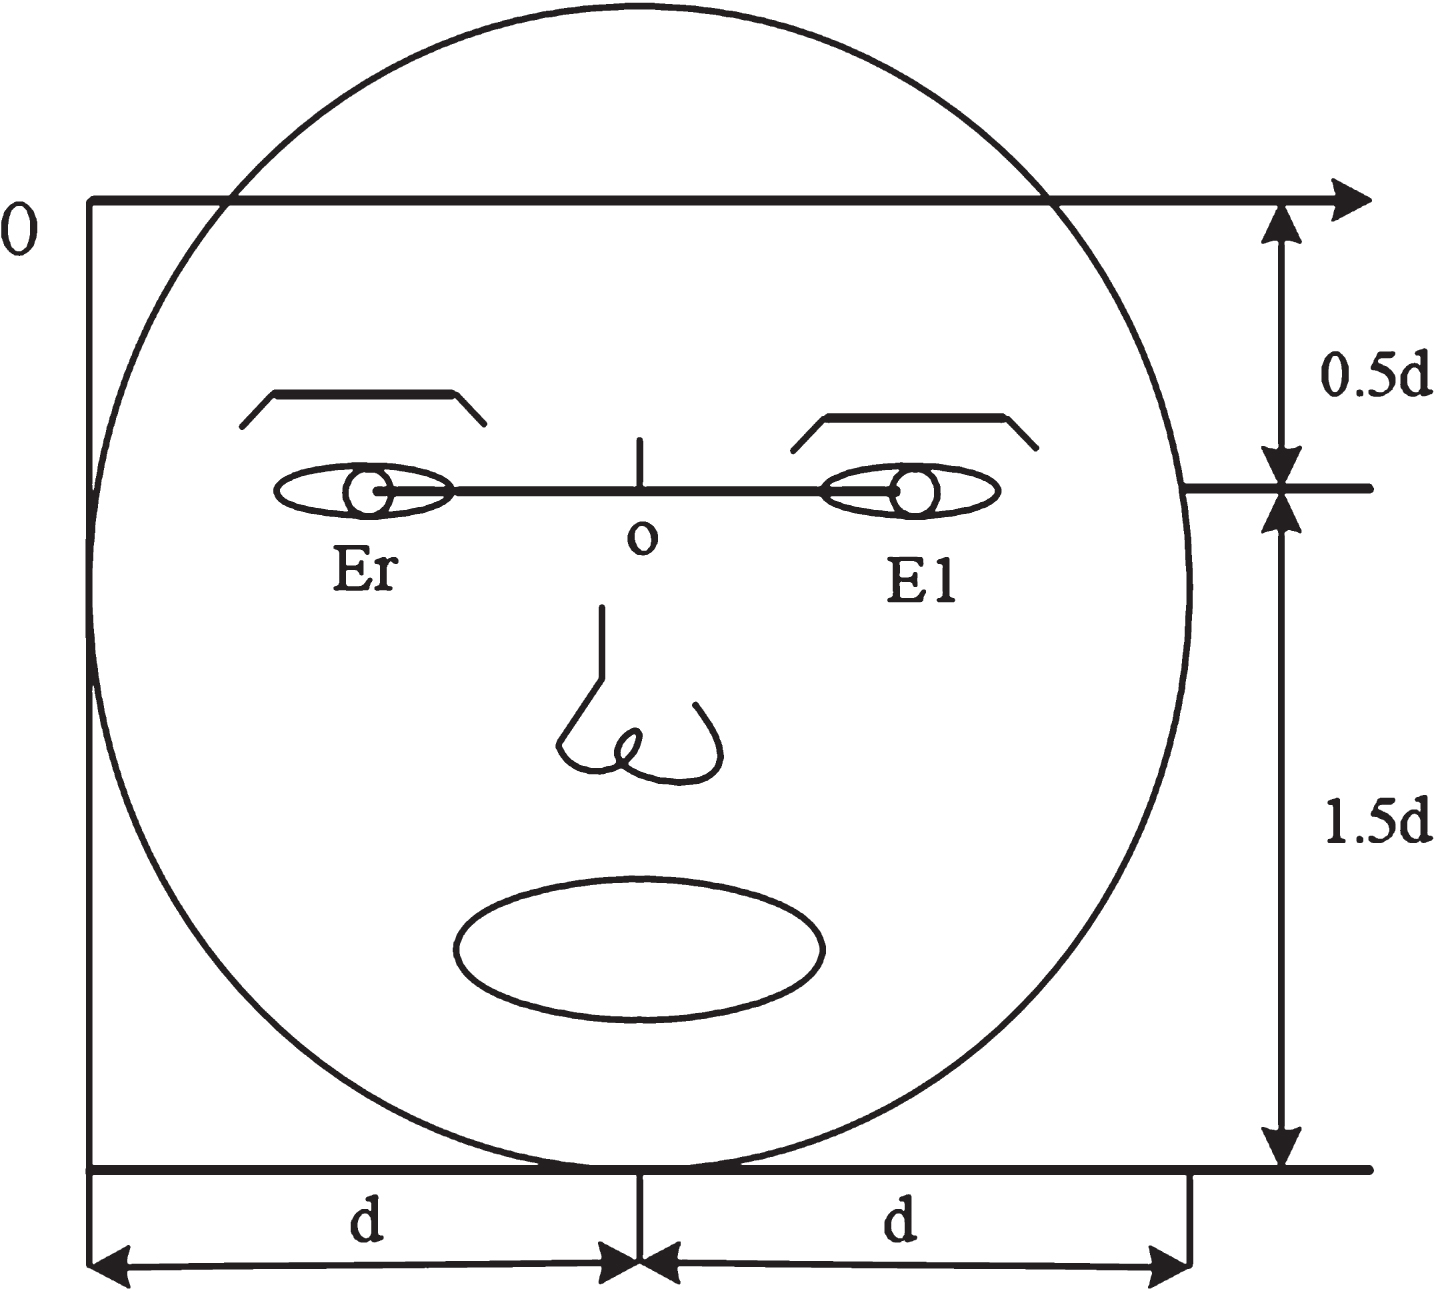
Face cut ratio.

The original image is decomposed by the image.
As far as an original face image is concerned, its high pixel will inevitably lead to a larger pixel matrix. Each pixel occupies a certain amount of memory, and participates in the calculation in the latter part of each step. It will lead to large space occupation, which is not conducive to subsequent calculation and a series of problems. Before the extraction of image features, if the wavelet transform is used to do some simple processing of the picture, it can effectively solve these problems. A picture is divided into four different frequency pictures, which is called a wavelet transform. After image and wavelet transform, each sub graph has its own recognition ability. If in the subsequent analysis, calculation, only one of the pictures is considered, detail characters are rejected. Compared with the original picture, although clarity is relatively low, there still has a higher degree of recognition. But losing three images is bound to reduce the amount of memory used by the picture and simplify the subsequent computation process. If one sub graph is decomposed into four different frequency images, it is the two-level wavelet transform, which has the same characteristics as the first level wavelet transform. For each picture, n decomposition is carried out, and the sub image obtain is only of the original image.
To sum up, the wavelet transform method was used in the primary image processing in face recognition in this paper. The basic content of the wavelet transform method is that the original image is decomposed into four sub graphs with different frequency (if necessary, multiple decomposition) according to the first level wavelet transform. The sub graph is used as the sample to get average distribution matrix and obtain the optimal projection matrix. The average value of training samples is compared with the optimal projection matrix, and the difference is projected to the optimal projection matrix. Using the same method, the same operation is performed to test samples. Finally, four characteristic matrices of training samples and four matrices about the test samples are got. According to the distance method mentioned above, the pictures are compared and classified, and the final result is the weighted sort to judge whether it meets the recognition condition. The calculation method is as follows:

Application of wavelet transform in face recognition system.
A total of C individual face categories are ω1, ω2, ⋯, ω
c
. Subscript represents that the number of people in category i is n (i). It also represents the total number of training samples
The distribution matrix is obtained, and the face is evaluated for each decomposition matrix.
Among them, i = 1, 2, ⋯, C ; j = 1, 2, ⋯, n (i) ; k = 1, 2 ; l = 1, 2. n (i) is the capacity of class i samples, and
Then the total scatter matrix is:
It is easy to prove that G t is a nonnegative definite matrix. The optimal projection matrix is obtained by calculating, and the detailed calculation method is as follows. The n maximum eigenvalues are found in G t distribution matrix. The eigenvectors of the n eigenvalues are calculated respectively. These eigenvectors are formed by X1, X2, ⋯, X r . P = [Z1, Z2, ⋯, Z r ] is set, and P is the optimal projection matrix obtained.
Features are extracted from training sample set.
Firstly, the training sample image is calculated, and the average face is obtained. Its calculation method is as follows.
Among them, i = 1, 2, ⋯, C ; j = 1, 2, ⋯, n (i) ; k = 1, 2 ; l = 1, 2
The training sample A
ij
is processed by wavelet transform, and the feature matrix of four sub graph
As mentioned above, the original images are transformed into four sub graphs (where the first level transform is taken as an example), and all of which have some degree of identification results. According to relevant research reports, the low frequency sub-graphs have the highest discrimination rate in the four sub-graphs. The discrimination rates are followed by vertical sub-graphs and horizontal sub-graphs. Identify rate is the lowest in the diagonal map. In practical applications, the discrimination process is a comparison of four sub-graphs. Therefore, the main information of low frequency sub-graph and the detail information in high frequency sub plot make the discrimination rate greatly improved.

ORL Face Bank (Cambridge University Face Library).
Experimental environment and face database
The PC operating system used in the experiment is Windows 7 and the computer CPU is Intel (R) Core (TM) i3-2350M, and the computing memory is 2 GB. The virtual computing software used is MATLAB. In the face recognition effect detection and verification, database extracted still uses the ORL face database (University of Cambridge Library of human face). There are 40 people data in the database, and each person has 10 different pictures. Its pixel unity is 92×112. The main difference between the pictures is the difference of the shooting time and the shooting angle. The photographer also has different facial expressions.
Comparison between improved algorithm and classical algorithm
In the experiment, five pictures of random training samples are randomly selected of each person from ORL face database, and the remaining 5 images are unified as test samples. Therefore, the number of training samples and the number of test samples are 200. In the experiment, the wavelet transform method is chosen to simplify the calculation process, and each original image is decomposed by wavelet. As far as one of the original images is concerned, it corresponds to a 2×2 module matrix, and then features are extracted. Four characteristic matrices of the sub-graph (the test sample operation process is the same as above) are obtained. At last, the sub-graph is classified and weighted sort according to the nearest distance method. The wavelet transform mainly includes four kinds: wavelet base Haer, wavelet base series Daubachias, wavelet base series Bierthogenal and wavelet base series Symlats. The sym4 wavelet performs best when testing each wavelet base. Therefore, in the article, the wavelet transform used in the calculation method was also sym4. Each sub-graph is calculated 10 times and its average value is calculated. The results are compared by M2DPCA and CA-M2DPCA respectively. A broken line diagram drawn is shown in Fig. 10.
Compared with the experimental results, it is not difficult to analyze the performance of the algorithm proposed in this paper is better than other algorithms in the calculation. The author thinks the wavelet transform is used in the algorithm and the M2DPCA algorithm is used in the calculation are the main reasons for the outstanding result. In addition, in the identification, low frequency sub-graph as the main method, supplemented by high frequency sub plot method is used in this paper, which greatly improves the accuracy of discrimination, and also reduces the calculation content in computer recognition process. Experiments show that the algorithm proposed in this paper should be used in practical applications.
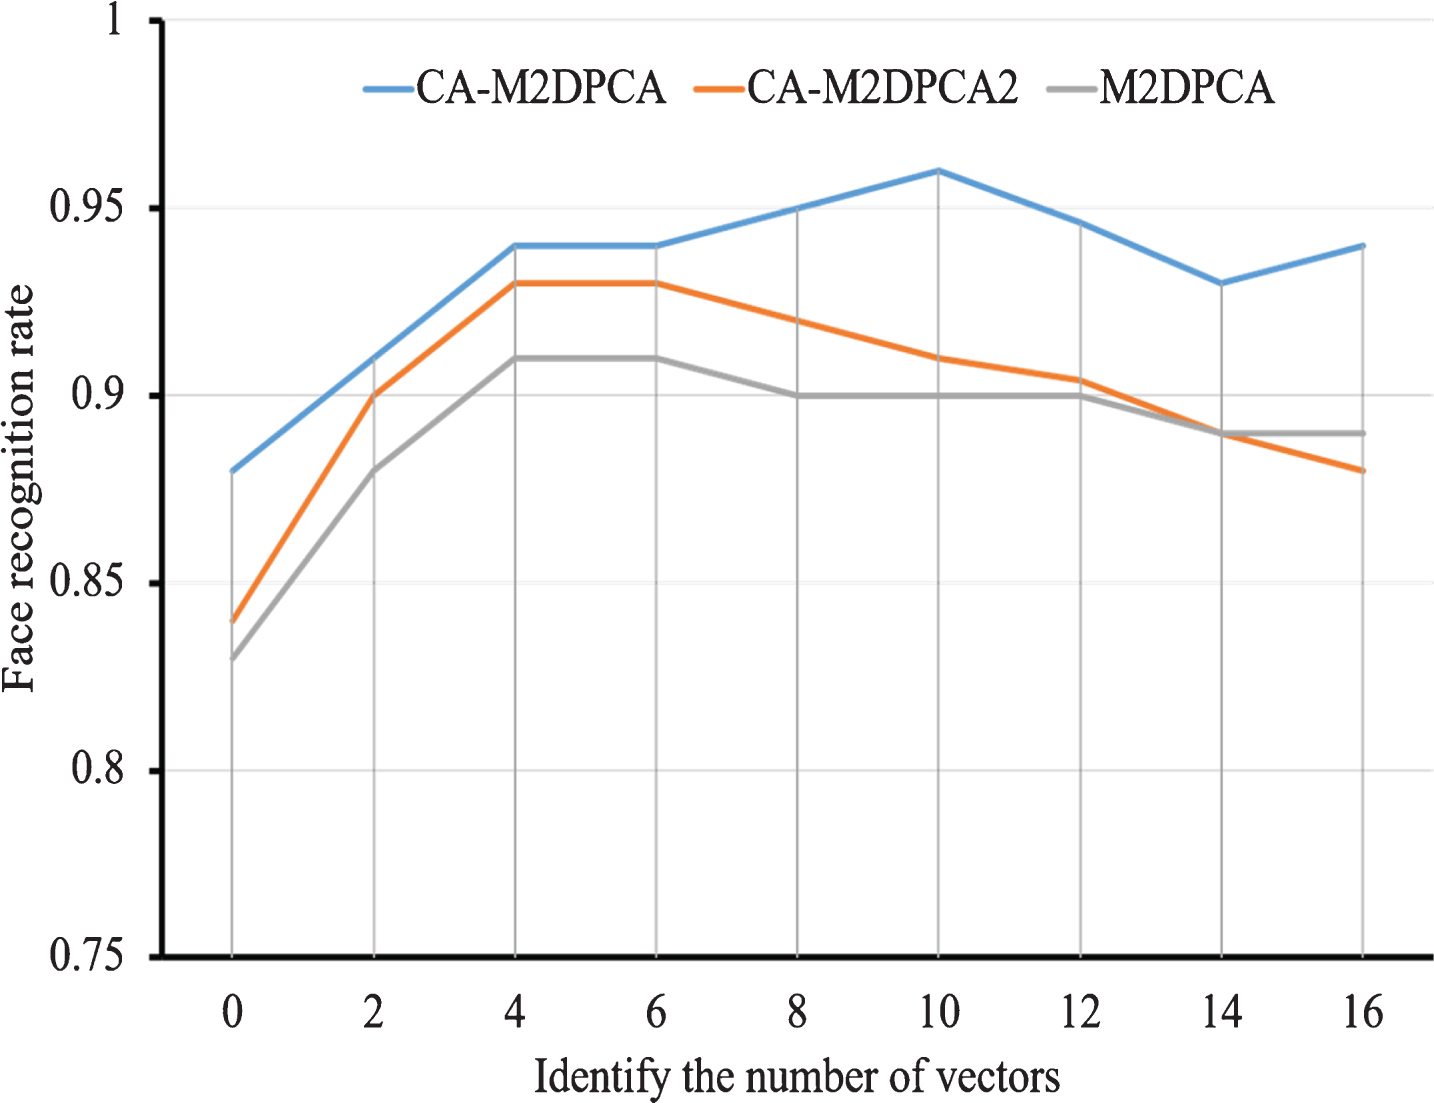
Comparison of Face Recognition Rates of Different Algorithms under Different Authentication.
According to the analysis of the distribution matrix and sample set, it’s not difficult to obtain that as the number of training samples increases, the more features you can get. This indicates that the recognition rate increases, so the recognition rate increases. The following is the experiment about the influence of training sample number on recognition effect. In this experiment, k (k = 2, 3, ⋯, 8) face images are extracted from each sample to form a training sample set, and the remaining pictures are the set of test samples. The wavelet transform used in the experiment is sym4. The algorithm is simulated by using Matlab software. In the test, the average value of each set of data is chosen after 10 calculations. The broken line diagram is shown in Fig. 11.
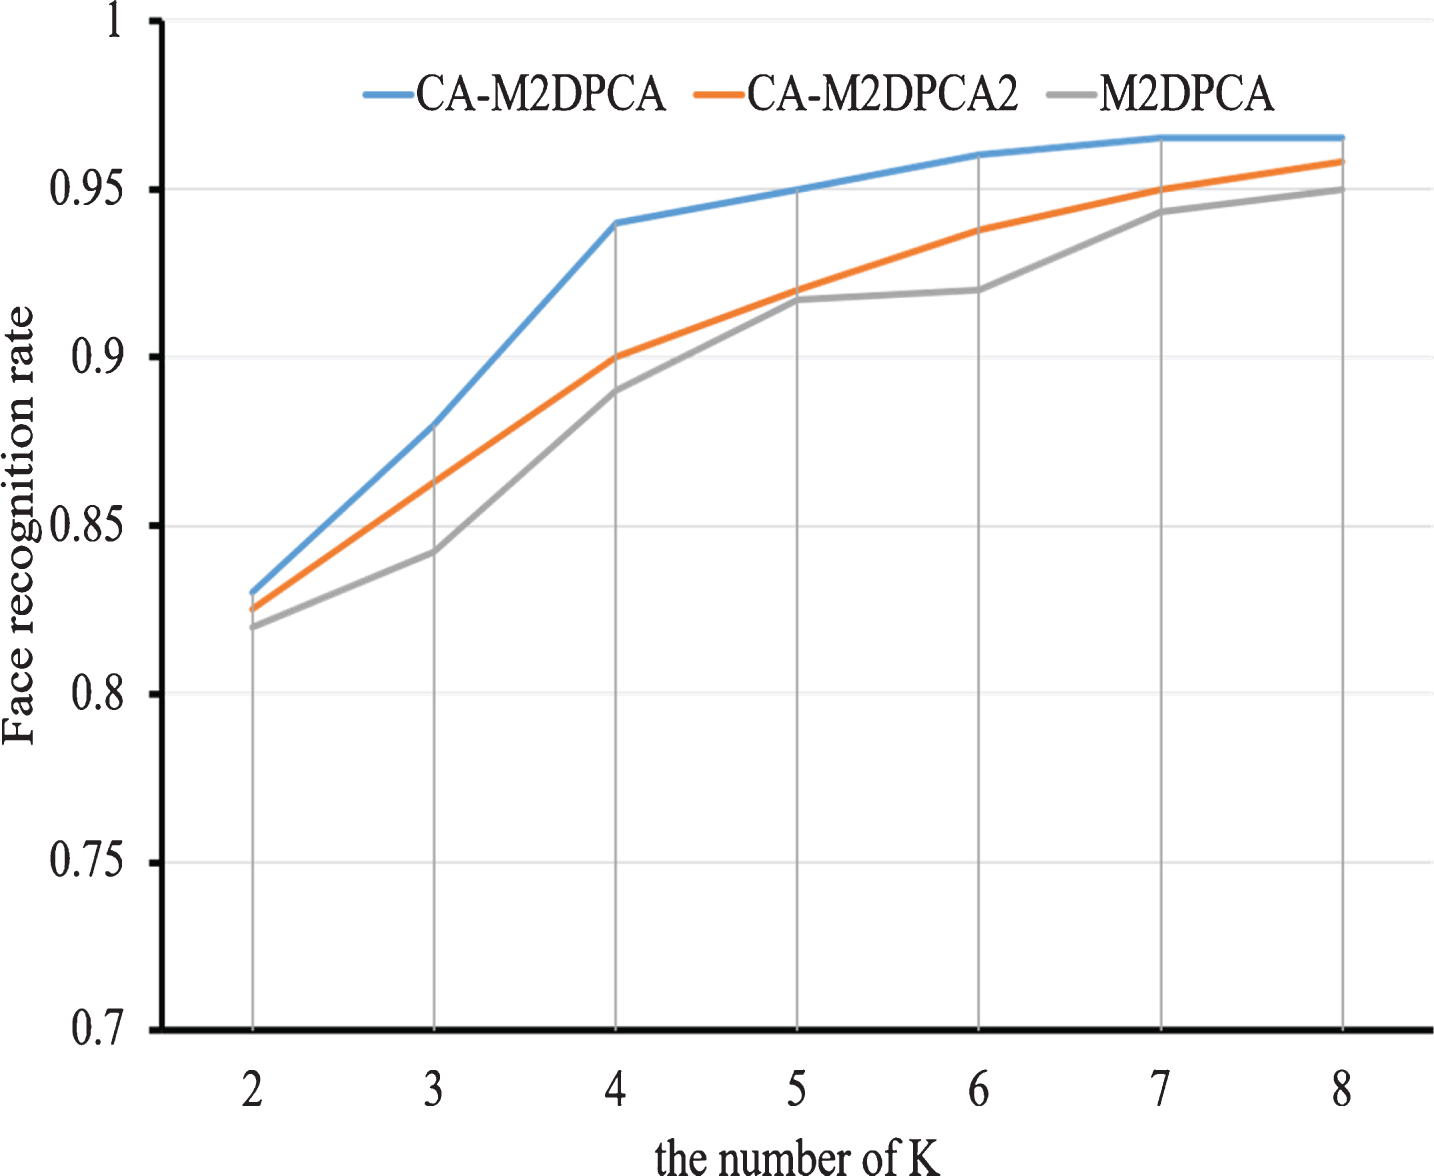
Number of different training samples in the ORL database recognition rate.
It can be seen from the experimental results in Fig. 11 that the face recognition rate obtained by the three algorithms is increasing with the increase of training samples. Therefore, the number of samples will affect the recognition effect, and is positively correlated with the recognition effect. The test results of wavelet transform and CA-M2DPCA algorithm mentioned above mentioned above are obviously superior to the other two algorithms. When the number of samples is higher than 5, the recognition rate of wavelet transform and CA-M2DPCA algorithm is 0.955.
The research of face recognition has been successfully applied in many fields, especially in the field of intelligent image recognition and intelligent image analysis. Therefore, the application of face recognition to modern residential property not only can effectively save time and resources, but also make the district more secure. Therefore, in this paper, on the premise of fully understanding the development status and trend of face recognition, the application of PCA algorithm in face recognition technology was proposed. In this paper, the method and process of face recognition were analyzed. Combined with its characteristics, the basic theory of PCA algorithm was established. The formula was deduced. According to the principle, the face recognition technology based on principal component analysis was obtained. In order to further improve the accuracy rate, on the basis of extracting facial feature vector, the wavelet transform method was used to improve the accuracy of PCA algorithm. Finally, the ORL face database was used to verify the experiment. The results show that the face recognition technology using the above algorithm is more accurate than the original technology, and can meet the use of intelligent residential property system.