
Abstract
Microbial activities are the indicators of soil strength. The present study explores the development of efficient predictive modeling systems for the estimation of specific soil microbial dynamics, phosphate solubilization (PS), bacterial population (BP), and 1-aminocyclopropane-1-carboxylate ACC-deaminase activity. More specifically, fuzzy c-means clustering (FCM)-FIS, Wang and Mendel’s (WM) fuzzy inference systems (FIS), adaptive neuro-fuzzy inference system (ANFIS), and subtractive clustering (SC) and have been implemented with the objective to achieve the best estimation accuracy of microbial dynamics. Experimental measurements were performed using controlled pot experiment using minimal salt media. Three experimental parameters, including temperature, pH, and incubation period have been used as inputs of FCM-FIS, SC-FIS, ANFIS, and WM-FIS methods. The SC-FIS method has the best estimation accuracy for the PS (R2 of 0.99) and BP (R2 of 0.94) than the rest three FIS methods.
Keywords
Introduction
The soil supports all forms of life. Soil condition is the result of continuous conservation processes and represents its continued capacity to vital living ecosystems [1, 2]. The activity of microorganisms assists in maintaining an appropriate configuration of physical, chemical and biological components of soil [3]. Microorganisms also raise the nutrients and water containing capability of the soil, assists in nitrogen-fixing, and controls the insects and infection of crops [4, 5]. The biological constituents of soil are mainly formed by the microorganisms; moreover, the physical and chemical constituents of soil are influenced by the activity of microorganisms [6, 7]. The activities of microorganisms are responsible for a change in the condition of the soil. Therefore, the fitness of soil can be determined by measuring the activity of microorganisms [8]. The precise evaluation of the activity of microorganisms in order to define the capability of the soil is a significant issue currently [8, 9]. The bacterial population (BP), and 1-aminocyclopropane-1-carboxylate (ACC) deaminase activity and phosphate solubilization (PS) are the significant indicators of soil quality. The conventional methods result in low estimation accuracy for the prediction of BP, PS, and ACC activity. The artificial intelligence (AI) methods have been used widely in the classification and prediction of soil-related factors since last few years, due to their better accuracy, reliability, and efficiency [10–18].
Literature survey and objective of study
Some of the latest studies related to the application of statistical and AI methods in soil parameter modeling applications, include performance comparison of regularized vs. non-regularized artificial neural network (ANN) in the water content estimation of soil [10]; back propagation neural network (BPNN) in the prediction of traction force in soil [11]; ANN, support vector machine (SVM), gene expression programming (GEP), and neuro-fuzzy (NF) methods in soil cation exchange capacity prediction [12]; and ANN, GEP, NF, SVM, random forest (RF), model tree (MT), and multivariate adaptive regression spline (MARS) in soil water capacity prediction [13].
Moreover, the statistical and AI methods have been also used in the prediction of activities of microorganisms in soil, like microbial diversity prediction using the statistical approaches [14]; BPNN, genetic algorithm (GA), ANN-GA and statistical regression methods in the prediction of lipase production by a soil microorganism (R2 of 0.99 for BPNN) [15]; ANN and multiple linear regression (MLR) methods in prediction of soil enzymes activity (variability of 37% –61% of MLR, and 96% –98% of ANN) [16]; ANN in the prediction of biosurfactant yield produced by microorganisms (R2 of 0.99 for few observations) [17]; and ANN and MLR in the prediction of Azotobacteria population in soil (R2 of 0.36–0.63) [18].
ANN is the commonly used method in the soil parameters modeling and activity prediction of microorganisms. Though ANN generates complex connection in between the dependent and independent parameters and the output is not stable due to the correction of weights and bias of neurons. Besides, the Fuzzy logic based method uses simple if-then rules in data modeling. The improved performance of the combination of ANN and fuzzy method is discussed in Ref. [12, 13].
Fuzzy inference systems (FIS) have been implemented in predictive modeling, in microorganisms connected applications, including fuzzy c-means (FCM)-FIS for the identification of lactic acid bacteria (better performance of FCM than k-nearest neighbor) [19], Wang and Mendel’s (WM)-FIS in the classification of anti-tuberculosis herbs [20], adaptive neuro-fuzzy inference system (ANFIS) in the prediction of antimicrobial peptides (accuracy of 96.7% and correlation coefficient of 0.936) [21], and subtractive clustering (SC)-FIS in water treatment modeling [22].
Though we have not noticed any comprehensive study based on the implementation of FIS methods for the estimation of activity of soil microorganisms collectively. With this motivation, we have implemented four FIS methods, including the FCM-FIS, WM-FIS, ANFIS, and SC-FIS in the prediction of BP, and PS, ACC activity. Three evaluation metrics, including root mean square error (RMSE), and coefficient of correlation (ρ) and determination (R2) have been used in performance evaluation of FIS methods. The better predictive performance of the SC-FIS and ANFIS methods has been achieved.
Fuzzy inference systems
Fuzzy logic based methods determine the partial truths than complete true or false, thereafter combines all partial truth into a higher truth. In order to find out a relationship between the dependent and independent variable, FIS assigns a partial membership to each independent variable, and then if-then rules were used to determine the complete membership by combining all partial memberships [27]. Clustering methods like FCM, SC, and mountain clustering, etc. have been used in finding the if-then rules of FIS methods. In the present study, we have implemented four types of FIS methods, including FCM-FIS, Wang and Mendel’s (WM)-FIS, adaptive neuro-fuzzy inference system (ANFIS), and SC-FIS. A short summary of four FIS methods is as follows.
Fuzzy c-means clustering based fuzzy inference system (FCM-FIS)
In Fuzzy c-means clustering, a data point is assigned to all clusters to some degree according to its distance from the center of clusters (high degree for low distance). The basic steps of the FCM method [28], includes (a) selection of c data points as the cluster centers (for a data set (Dm×n)
T
={ x1, x2, x3, ……, x
n
} of n data points), (b) calculation of membership value
Wang and mendel fuzzy inference system (WM-FIS)
Wang and Mendel (WM) fuzzy inference system is one of the fundamental type of FIS based on Wang and Mendel’s rules. The method function in following steps (a) splitting of input and output spaces into fuzzy regions, (b) deciding the degrees of input-output pairs to fuzzy regions, (c) finalizing one if-then rule for each input-output pair, (d) declaring a degree to each if-then rule, in order to discard the inconsistent rules, (e) formulating a combined if-then rule, and (f) prediction of the output of a test input based on a combined if-then rule. Further detail of the method can be seen in [29]. WM-FIS method is implemented in the R [30] using the frbs package [31].
Adaptive neuro-fuzzy inference system (ANFIS)
Adaptive neuro-fuzzy inference system uses least squares and BPNN in defining the fuzzy rules [32]. A five-layer structure of ANFIS has been implemented in MATLAB for the determination of if-then rules. Specifically, it contains two adaptive layers (first and forth) with three adjustable premise parameters, and three adjustable consequent parameters, respectively. The first layer calculates membership for input, the second layer produces the firing strength of membership, the third layer normalizes the firing strength generated by the previous layer, the fourth layer calculates the output rule, and the fifth layer generates the final output by combining the outputs of the previous layer. The adjustable parameters are tuned using the least squares and gradient descent method based BPNN methods with the objective to obtain the optimal performance of ANFIS method.
Subtractive clustering fuzzy inference system (SC-FIS)
In the subtractive clustering, firstly a potential of each data point is calculated by using the Gaussian measure, then the cluster is formed on the basis of the potential of data points (maximum potential data point as the first cluster center). Data points within a defined radius of the first cluster center create the first cluster. The consecutive clusters are created by removing the data points associated with the previous clusters [33]. After generating clusters, fuzzy if-then rules are created in the succeeding steps: computing the degree of each fuzzy rule for clusters and membership function of data points to fuzzy rule, and finally estimation of the output value of a test input variable using combined if-then rule. A further detail of the method is available in Ref. [33]. The method is implemented using in R the frbs package [30, 31].
Materials and methods
Rhizospheric soil sampling
The Rhizospheric soil was collected in polyethylene bags from the wheat plants after uprooting them at tillering stage. The agitating process was used to detach the non-rhizospheric soil from the roots of wheat plants. The rhizospheric soil samples were used in the preparation of a composite sample WRS (wheat root rhizospheric samples). The Taguchi design is used to measure the BP, PS, and ACC activity at varying experimental conditions (temperature, pH, and incubation time). The basic statistics of experimental conditions and activity measurements of microorganisms are summarized in Table 1.
Basic statistics of measured value of experimental conditions, phosphate solubilization (PS), bacterial population (BP), and ACC deaminase activity
Basic statistics of measured value of experimental conditions, phosphate solubilization (PS), bacterial population (BP), and ACC deaminase activity
PS-phosphate solubilization, BP- bacterial population, CFU- colony-forming units, ACC-1-aminocyclopropane-1-carboxylate.
The spread plate method based on Marine Agar (121°C, 1 atm for 20 min) was used in the counting of the rhizospheric population of microorganisms. The sterile sodium chloride (34 g l–1) was used in the dilution of Marine Agar medium. The Marine Agar medium was poured on different sterile Petri plates and stored for 3–12 days (at 25°C-40°C). The BP was measured in colony-forming units (CFU) ml–1 [23]. It varies in between 1.0E+02 to 4.0E+07 (Table 1). The PS activity of microorganism was measured in μg mL–1 using the NBRIP broth media (glucose 10 g, rock phosphate 5 g, MgCl2.6H2O 5 g, MgSO4.7H2O 0.25 g, KCl 0.2 g, (NH4)2SO4 0.1 g L–1) [24]. Firstly, the 0.1 g rhizospheric soil was dissolved into Tryptic soy broth and stirred at 100 RPM, thereafter stored at 28C for an incubation period of 18 hrs. The development of microorganisms was observed using the turbidity method. Thereafter, 20μL of inoculums was added in 50 ml NBRIP broth (incubation time 72 hrs) then the latter was separated. To end with, the PS was measured at 410 nm [25]. The ACC deaminase activity of microorganisms was measured according to the procedure described in Ref. [26]. It was measured in nM α-ketobutyrate mg–1 h–1 and signify the quantity of α- ketobutyrate produced by the cleavage of ACC. To start with, a standard solution of α-ketobutyrate was prepared using the Tris-HCl (0.1 M, pH 8.5) at 4C. The quantity of α-ketobutyrate was determined by comparing two absorbance curves (first of trial sample and second of α-ketobutyrate 0.1-1 nmole) at 540 nm. The demonstration of FIS methods predicted values of BP, PS and ACC deaminase activity vs. their actual values are shown in Figs. 1–3, respectively. The performance evaluation metrics of FIS methods, includes (a) root mean square error, and coefficient of (b) correlation coefficient (ρ) and (c) determination (R2) [34].
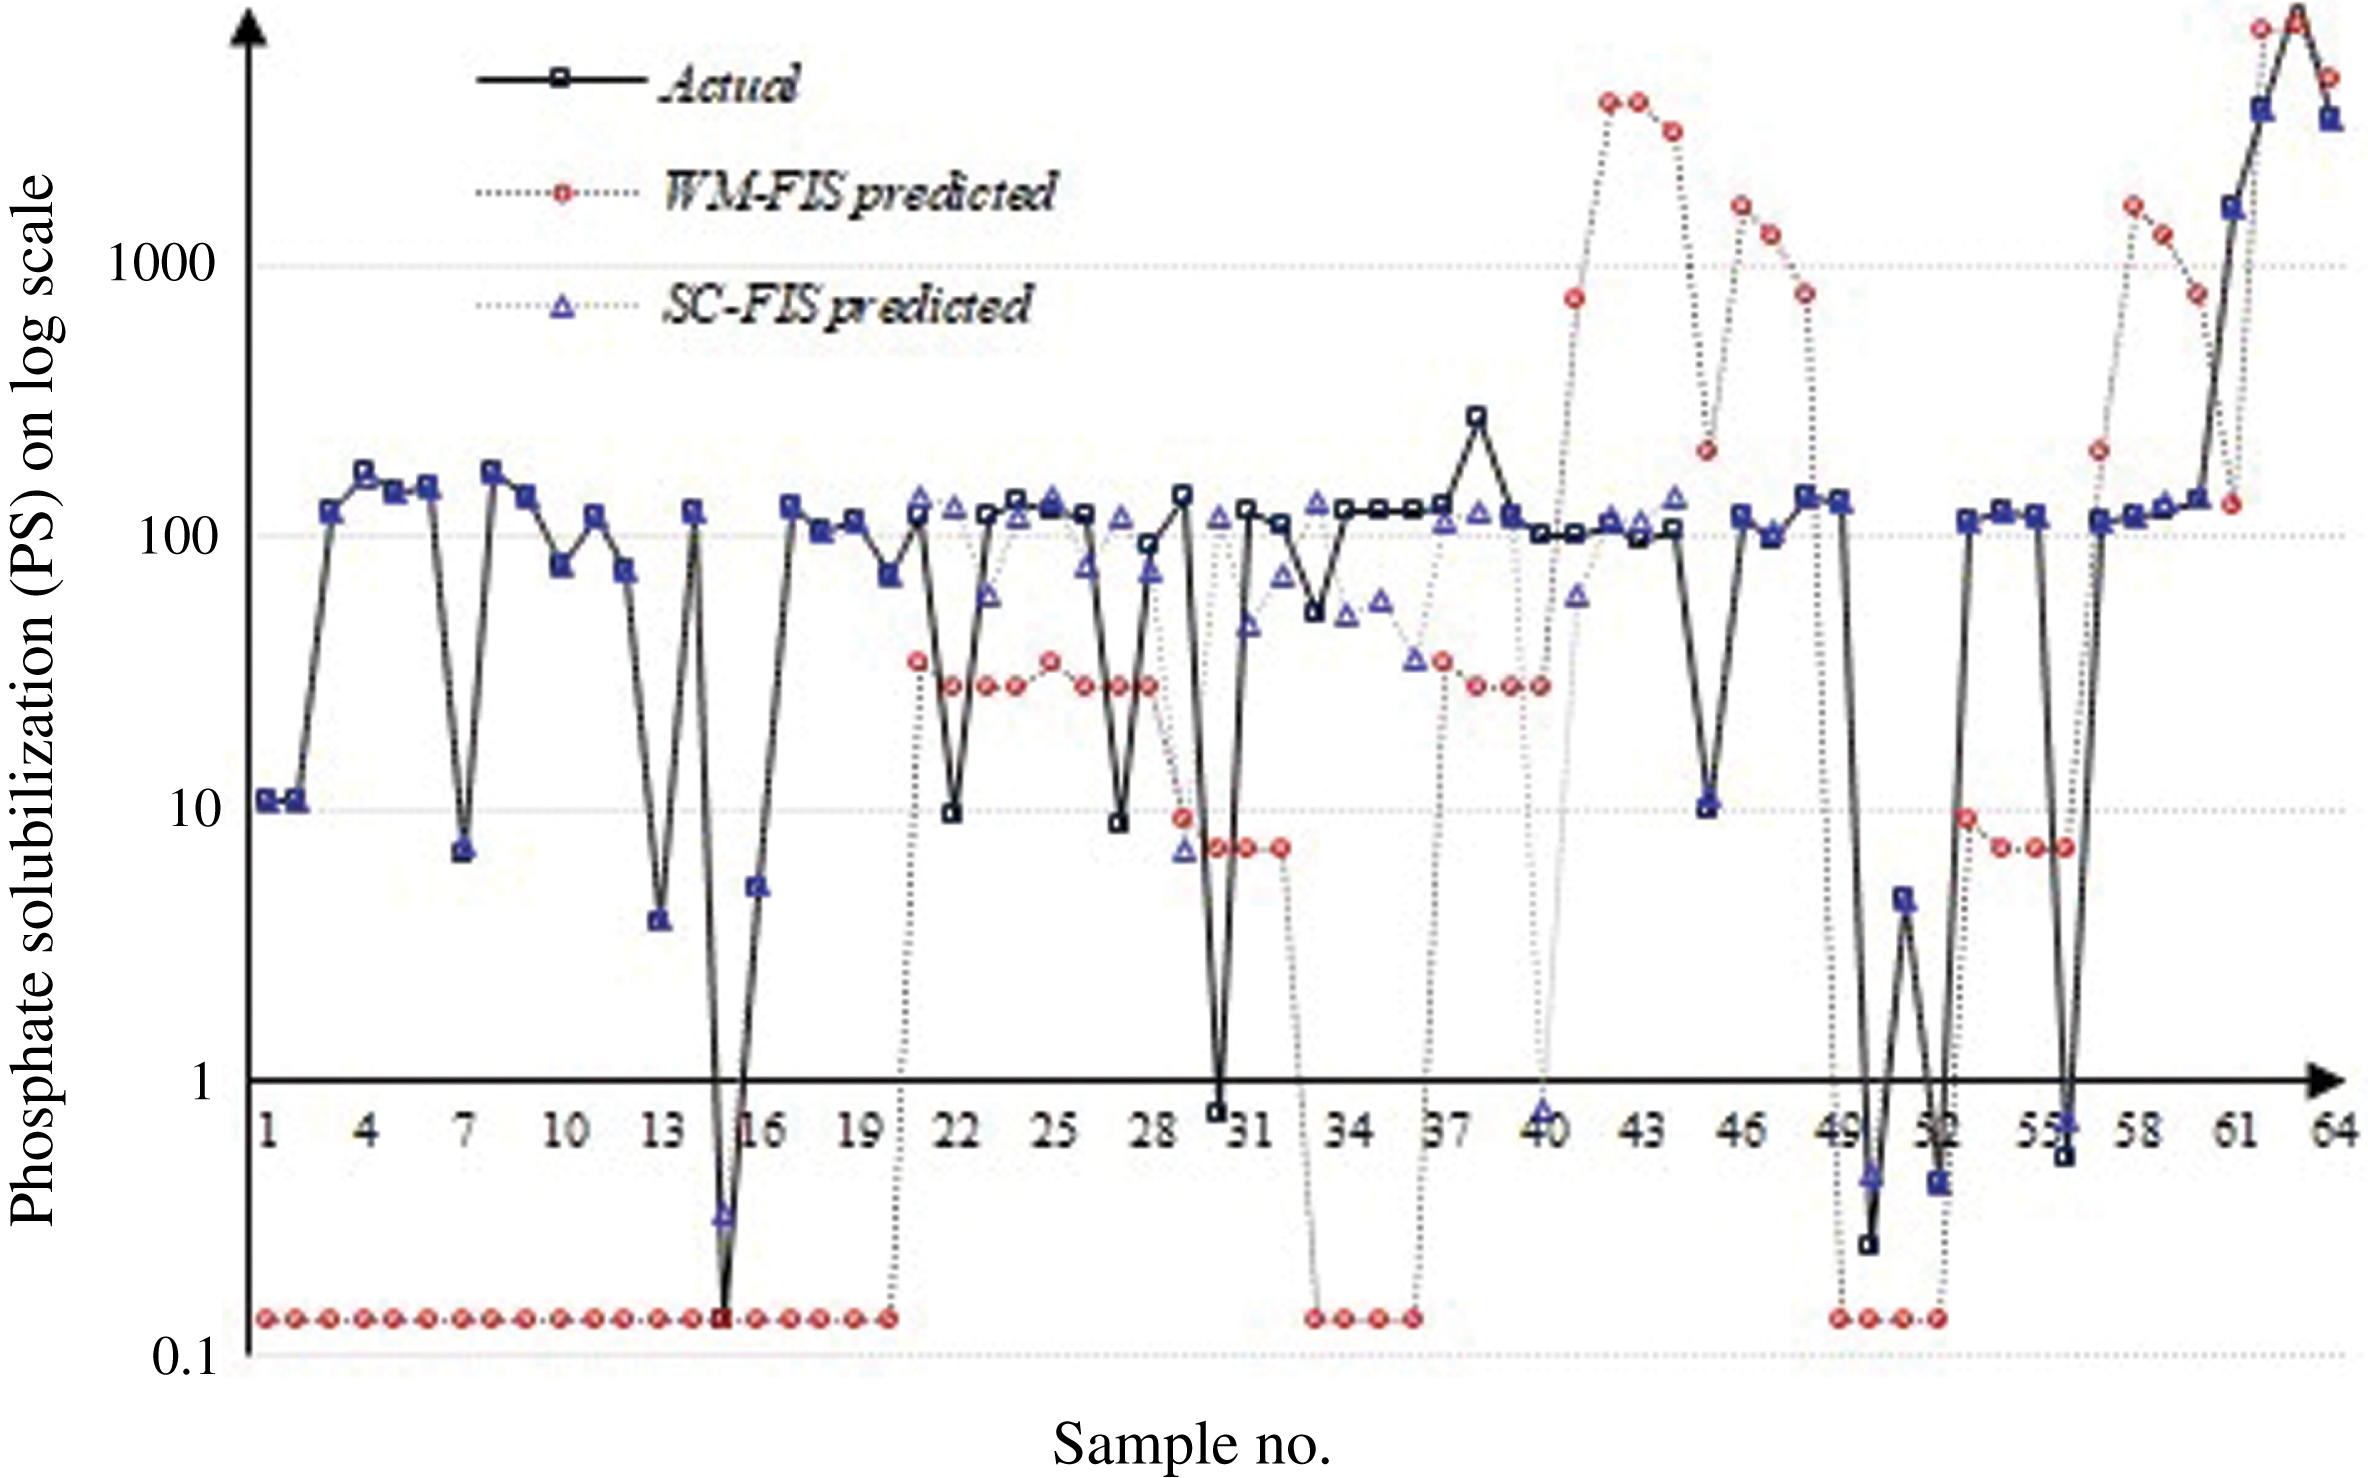
Actual vs. FIS methods predicted phosphate solubilization (PS).

Actual vs. FIS methods predicted microorganism population (BP).
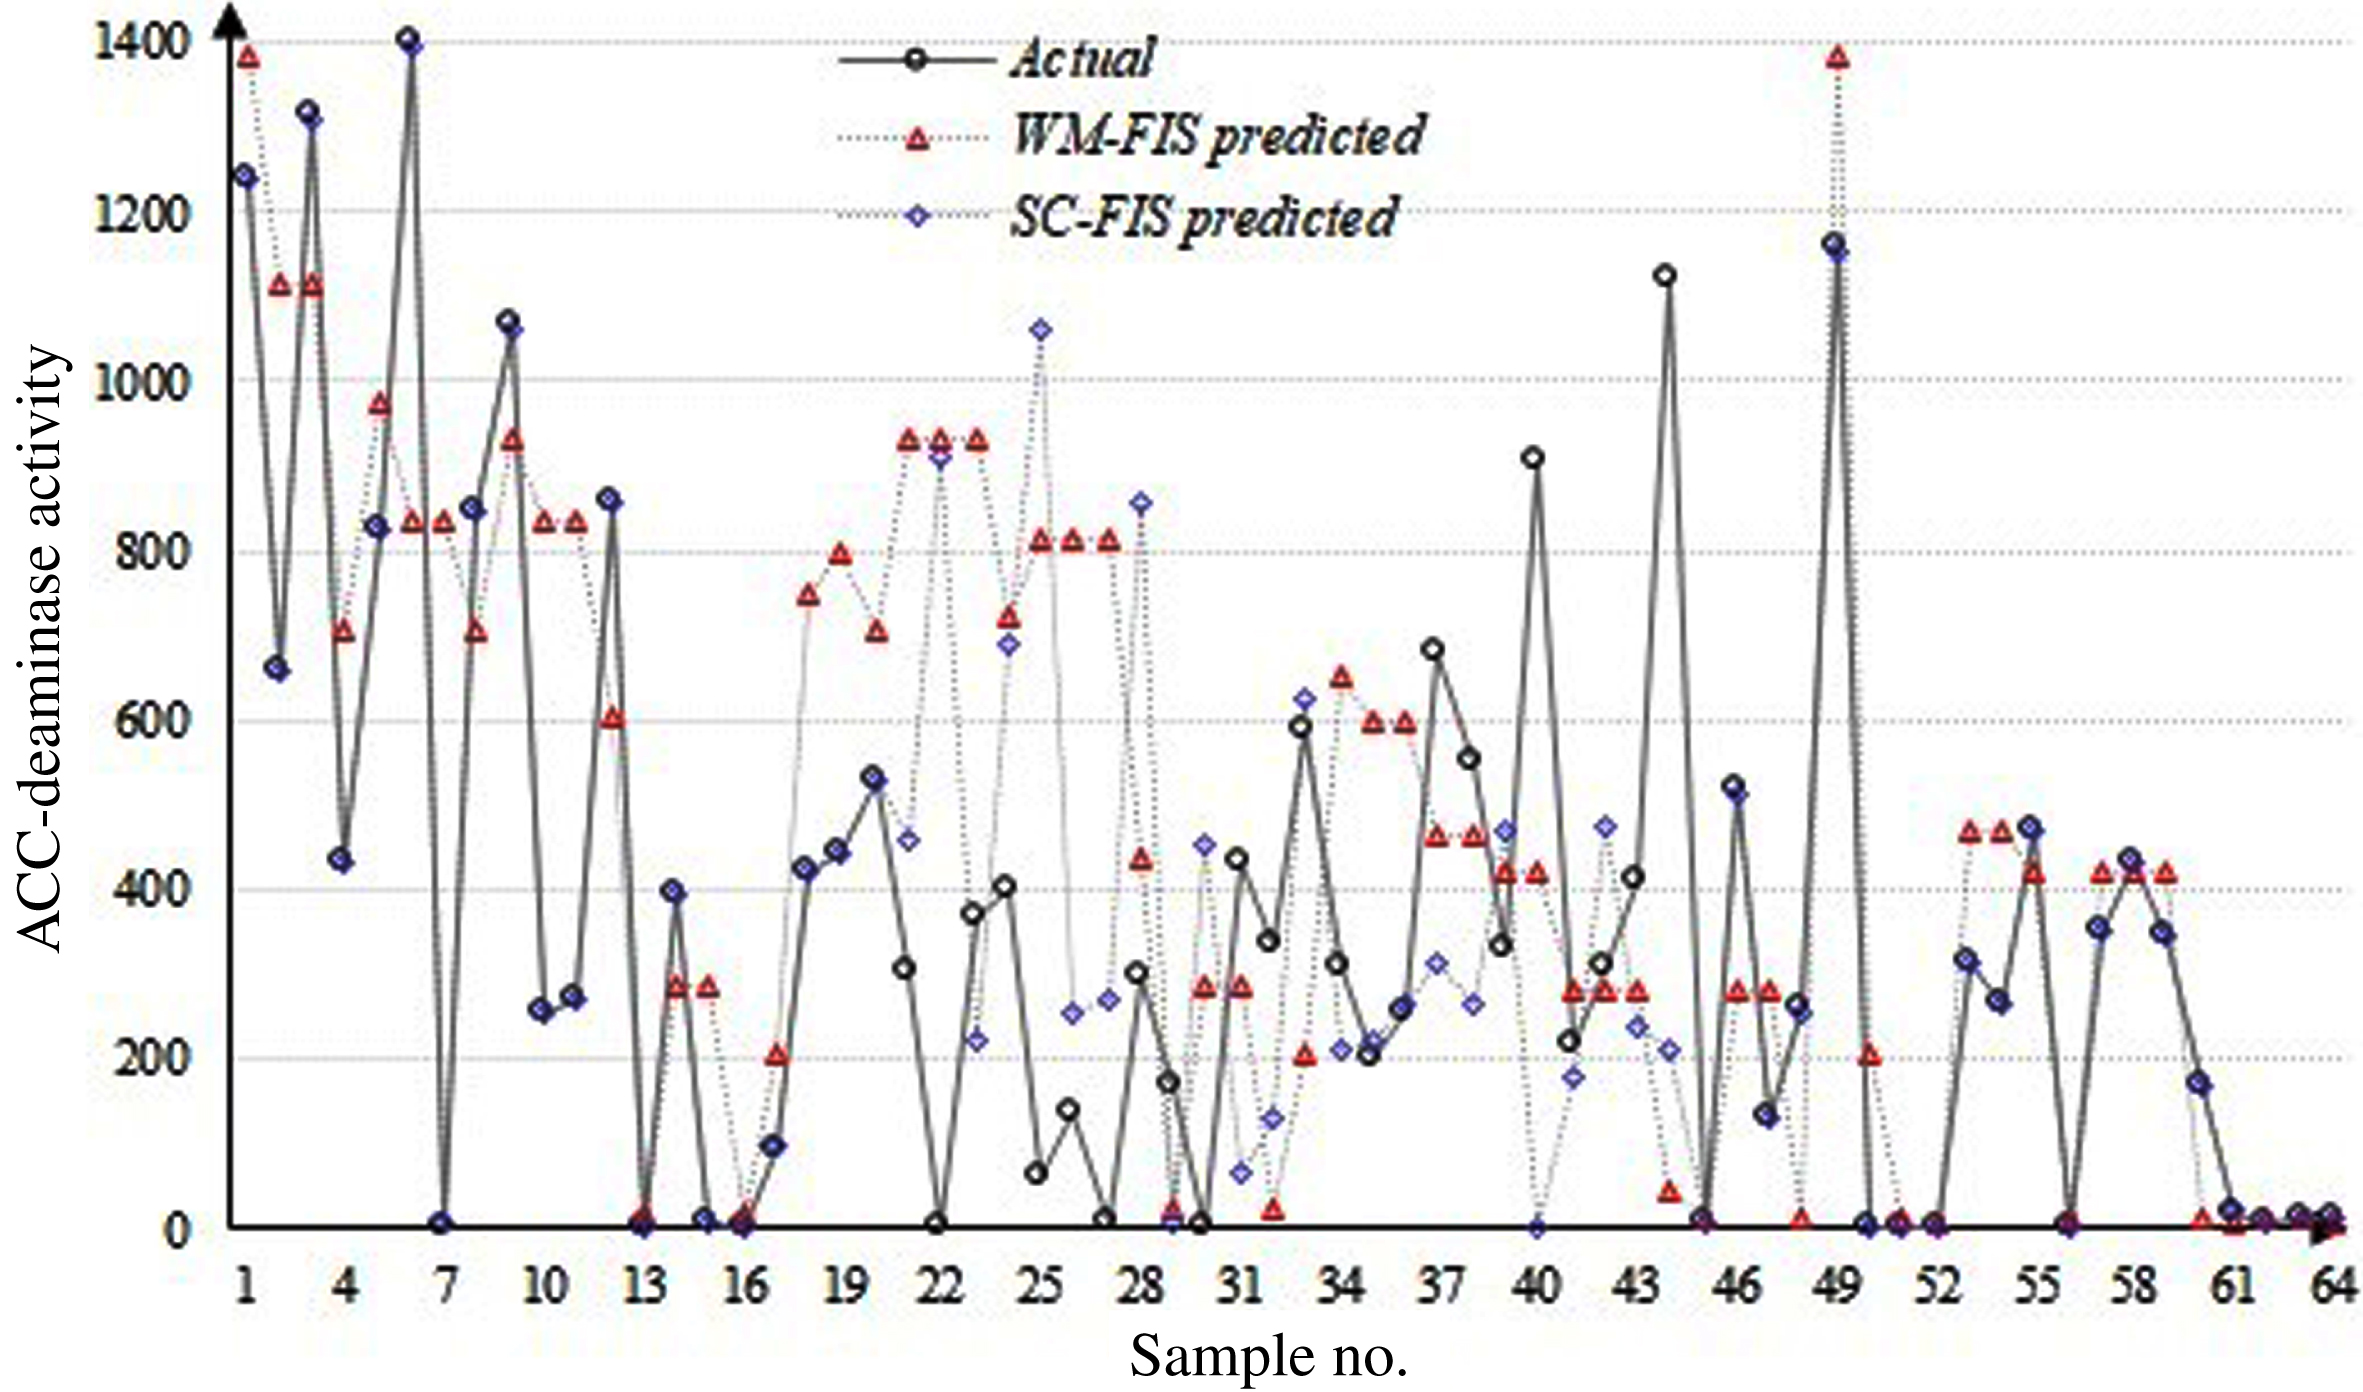
Actual vs. FIS methods predicted ACC activity.
A correlation matrix between the experimental conditions and activity measurements of microorganisms is summarized in Table 2. This is done in order to understand the relationship in between the experimental conditions, activities of the microorganisms, and in between conditions and activities.
The RMSE is defined as
Discussion
Figure 1 presents plots of measured values of PS and their predicted values using two FIS methods (WM-FIS, and SC-FIS). It is obvious that the predicted values of PS using the SC-FIS method are almost equal to their actual values. The ANFIS method predicted values have a larger variation than the SC-FIS method predicted values (especially for the sample number 2, 15, 36, 44, 47, 51, 59). The most difference is observed for the actual and FCM-FIS predicted values of PS. The WM-FIS predicted values of PS show less variation than the FCM-FIS predicted values and more variation that the ANFIS and SC-FIS predicted values.
The maximum variation is noticed for the WM-FIS predicted value of PS for sample number 43. The quantitative predicted results of four FIS methods in terms of evaluation metrics (Table 3) further support the visual demonstration shown in Fig. 1. The maximum value of ρ= 0.99 and R2 = 0.99, and the minimum value of RMSE = 45.3 exhibits the best performance of the SC-FIS method than the rest three FIS methods. The FCM-FIS method has the minimum value of ρ= 0.40 and R2 = 0.16, and a maximum value of RMSE = 1196.5. The predicted value of BP using two FIS methods is presented in Fig. 2. Like the PS, the SC-FIS method has better performance in the prediction of BP. Most of the SC-FIS predicted values of BP are approximately equal to their actual values except for a few samples (Fig. 2). The ANFIS predicted values of BP are less close to their actual values than the SC-FIS predicted values. Particularly, a large difference can be seen in the sample number 4, 7, 19, 24 and 33. The FCM-FIS is the least performing method while the WM-FIS has better performance than the FCM-FIS method in the prediction of BP like PS. The evaluation metrics (Table 3) also verify the best performance of the SC-FIS method (maximum value of ρ= 0.97 and R2 = 0.94, and the minimum value of RMSE = 135000) and the least performance of FCM-FIS method (the minimum value of ρ= 0.23 and R2 = 0.05, and a maximum value of RMSE = 5167522.1).
Correlation between the experimental conditions and measurements
Correlation between the experimental conditions and measurements
INC-incubation time, T-temperature, Var-variable.
Performance comparison of FIS Methods
The actual and FIS methods predicted values of ACC deaminase activity is shown in Fig. 3. A different situation is observed in the performance comparison of SC-FIS and ANFIS for the prediction of ACC deaminase activity. It is obvious from the visual inspection that the ANFIS method predicted ACC deaminase activity is closer to their actual values than the SC-FIS predicted values. This fact is further established with the maximum value of ρ= 0.78 and R2 = 0.61, and the minimum value of RMSE = 225.1 of the ANFIS method than the SC-FIS method (Table 3).
Again, the FCM-FIS predicted values has the maximum difference than the actual value of ACC deaminase activity (the minimum value of ρ= 0.45 and R2 = 0.20, and a maximum value of RMSE = 320.8). The correlation coefficient ρ⟶1 represent a perfect linear relationship between the actual and the method predicted values and better performance of a predictive method, like for actual values and SC-FIS predicted values of PS (Table 3). The coefficient R2⟶1 denotes the improved performance of the predictive model and high confidence of strength between the actual and method predicted values (SC-FIS predicted value of PS and BP, Table 3). The R2⟶0 represent the poor performance of the predictive model and the irregularity of dependent variable (FCM-FIS predicted value of BP, Table 3). The minimum value of RMSE indicates the higher precision of the predictive method (SC-FIS predicted value of PS). The comparison of the visual demonstration of actual and four FIS methods predicted values of PS, BP and ACC deaminase activity in Figs. 1–3 and evaluation metrics (Table 3), suggest that the SC-FIS method has the best performance in the prediction of PS and BP while the ANFIS results in the best prediction of ACC deaminase activity than the rest FIS methods.
The SC-FIS methods predicted values are exactly equal (accuracy 100%) to the actual values of PS, BP, and ACC deaminase activity at certain experimental conditions, like PS actual = 113.6 and PS predicted = 113.6 for incubation 6 days at 25C and pH 8; BP actual = 500000 and BP predicted = 500000 for incubation 9 days at 25C and pH 7; BP actual = 20000 and BP predicted = 20000 for incubation 12 days at 25C and pH 6; ACC actual = 269.8 and ACC predicted = 269.8 for incubation 3 days at 35C and pH 8; ACC actual = 422 and ACC predicted = 422 for incubation 6 days at 25C and pH 7, and ACC actual = 0.99 and ACC predicted = 0.99 for incubation 12 days at 25C and pH 9. The SC-FIS method controls the ambiguity in the experimental conditions and measured values of activity of microorganism, therefore, result in better prediction of the latter. The better performance of the SC-FIS method is also due to the fact that it uses a minimum number of if-then rules created on the basis of similarity in the data. The superior performance of the SC-FIS method is also discussed in a related study [35] (prediction of cation exchange capacity of soil). We have not noticed any study based on the prediction of activity of microorganism using the FIS methods, therefore a direct comparison of results is not possible. Though, in an evaluation of related applications [15, 18], the comparable performance of the SC-FIS method is obvious.
A comprehensive performance analysis of FIS methods, including the FCM-FIS, WM-FIS, ANFIS, and SC-FIS has been presented in the prediction of activity of microorganism measured at diverse experimental conditions. The study concludes the better performance of the SC-FIS method in the prediction of PS and BP, and ANFIS method in the prediction of ACC deaminase activity. Besides, some best combinations of experimental conditions have been explored in which the SC-FIS method has 100% accuracy. That can be used in the monitoring of soil quality and growth of the plant in a better way.
Footnotes
Acknowledgments
This work is supported by The Startup Foundation for Introducing Talent of NUIST. The authors acknowledge anonymous reviewers for their valuable suggestions.