
Abstract
Voice activity detection (VAD) identifies the presence/absence of human speech in a frame of a given speech signal. Presence/Absence of human speech can easily be identified in clean speech signal but its accuracy decreases with decreasing Signal-to-Noise ratio (SNR) value. Robust VAD helps to enhance the efficiency of speech signal based automated applications like speech enhancement, speaker identification, hearing aid devices etc. In this paper, a new feature of speech signal- “Peak of Log Magnitude Spectrum (PLMS)” is introduced and used for VAD. This newly defined feature PLMS along with three existing acoustic features(MFCC;RASTA-PLP and Formant Frequency) are used to train SVM classifier for VAD. Experimentally, it is found that coefficients of PLMS play most prominent role. Experimentally, it is also observed that the accuracy of the trained SVM classifier for VAD is the highest when compared with other state of the art methods (Sohn VAD and VAD G.729).
Introduction
Voice Activity Detection (VAD) is a binary classification problem because any frame either contains human speech or does not. VAD differentiates the presence or absence of human speech in a speech frame. Voice (human speech) can be easily identified in the clean (absence of noise) speech signal using simple acoustic features of speech like zero crossing rate (ZCR) and energy. Identification of voice becomes tedious when signal-to-noise ratio (SNR) is low. Due to this, robust voice activity detection is considered to be one of the most open and challenging task in speech signal processing area. An efficient and robust VAD improves SNR of existing speech enhancement algorithms by enhancing the capability of noise estimation. Several approaches for VAD like traditional algorithmic approach, machine-learning based approach etc. exist in the literature. Traditional algorithmic approach takes decision on the basis of one or two acoustic feature/features. Machine learning based VAD uses multiple features for taking its decision that makes it more resistive with noise than traditional approaches. These VADs are more applicable in other speech processing systems because they can naturally integrate with the systems like speech/ speaker recognition. Since, machine-learning based VAD fuses multiple acoustic features for taking decision therefore selection of features play crucial role. Fusion of multiple features of speech (with similar properties) may or may not increase the performance of the system. One can select large number of features to produce better result but it may take larger time in training, modelling and testing which will defeat its applicability in real life applications like hearing aid devices, online audio chat etc. Hence, features should be selected to enhance the accuracy without much affecting the time required.
As per source filter theory of speech production, human speech is produced with the convolution of excitation sequence and vocal tract filter characteristics [2]. Sounds generated by a human are filtered by the shape of the vocal tract including tongue, teeth etc [1]. Shape of phonemes in the human speech is designed by his/her vocal tract which distinguishes it from sounds(noise) generated from other sources like CAR, TRAIN, BABBLE, AIRPORT etc. Therefore, the features capturing the vocal tract characteristics will be more suitable for VAD. In the cepstral or quefrency domain, starting few values of every speech sample contain the information about vocal tract characteristics. Features like formant frequency, MFCC, RASTA-PLP etc. capture vocal tract characteristics.
Hence, motivation of this work is to select suitable set of features of human speech for VAD so training time of SVM is reduced and efficiency of the system is also enhanced. In this paper a new feature PLMS of human speech is introduced and examined for the said task. PLMS coefficients are the log magnitude spectrum values of a speech frame of duration of 15 to 20 msec. Experimentally, it is found that combining this feature with MFCC and formant frequency, overall performance (in terms of training time and accuracy) of SVM based VAD is improved.
Following are the major contribution of this Paper: A new speech feature PLMS is introduced. Appropriate reduced set of speech features for real time efficient and robust VAD is defined.
The rest of this paper is organized as follows. In section 2 Literature survey for VAD is discussed. procedures of extracting the selected acoustic features of speech are discussed in section 3 followed by section 4 where, parameters used for measuring the performance are explained. Analysis of Experiments are performed in section 5 and paper is conclued in section 6.
Literature Survey for Voice Activity Detection (VAD)
Number of researchers have been working in the field of VAD using different acoustic features like spectral correlation, energy entropy etc. In this section, a brief review of state of the art approaches for VAD scheme is presented.
Human speech signal contains two main informations: excitation sequence and vocal tract characteristics. Some researchers have used only excitation sequence features of speech [15] for VAD. Features like spectral divergence, spectral correlation, low-frequency ultrasound, single frequency filtering, energy entropy [5, 25] are also used for the same. Some researchers used long-term features or suprasegmental features like long-term spectral divergence measure (LTSDM), long-term signal variability (LTSV) [17] for VAD and claimed that they give effective performance even in the low SNR. LTSDM measures the spectral divergence between speech and noise over longer sample duration [11]. Features with spectral energy in different frequency bands and in different scales like bark-scale or MEL- Scale have been widely used for the said purpose. In MEL-Scale, spectral energy is known as MFCC [23]. Voiced sounds (Showing quasi-periodic behavior and dynamic spectral characteristic for short utterance) features have been extracted and used for VAD by many researchers [7, 9].
Statistical methods like log-likelihood ratio test [14], optimum likelihood ratio test [12], low-variance spectrum estimate [3], Laplace distribution [19], Gaussian distribution [4, 14], Gamma distribution [10] or combination of them [28] are also popular for VAD in the literature. Computational efficiency of these methods are high but accuracy of these systems decreases drastically with decreasing SNR values.
Performance of VAD system is not consistent by using traditional approaches at different SNR values for different category of noises by using few features because individual feature captures only specific characteristics of human speech. Fusion of multiple features improve the performance of VAD. Many machine learning methods like artificial neural networks [24], Support Vector Machine (SVM) [13, 23], Deep Belief Network (DBN) [27] etc. use multiple feature fusion for VAD.
One of the most popular and successful approach for VAD is machine learning based approach. This approach has been further categorized into two categories: supervised and unsupervised. When labeled speech data is used for training, it is known as supervised otherwise unsupervised. In an unsupervised method, dimensionality reduction on extracted feature is performed first. Thereafter, resultant set of features are used for training and validation of the classifier. Principle component analysis [21], non-negative matrix factorization [18], and spectral decomposition of graph Laplacian [20] are the popular methods for dimensionality reduction. Performance of such types of trained classifiers are found not satisfactorily in the presence of noise like Babble at low SNR.
Supervised trained classifiers for VAD perform well in almost all types of noises when trained with sufficient amount of labeled dataset.
Recently, deep neural network [22, 30] has been introduced for VAD. Zhang and Wu [27] have used ten different acoustic features with total number of 273 coefficients. They claimed that the performance of DBN is better than SVM in terms of accuracy. X.L. Zhang et al. proposed a new method for VAD using Deep Neural Network by boosting contextual information. They claimed that when this model is trained with many numbers of noises and wide range of signal-to-noise ratios, then its performance is good even for unknown test cases [31]. S. Shahsavari et al. also proposed speech activity detection using deep neural networks and claimed that performance of the system increases by adding context information [32]. L. Jie and Y. Datao proposed enhanced speech based jointly statistical probability distribution function for VAD. They claimed that the performance of the proposed approach is better than other the baseline methods even in non-stationary noise conditions [33]. P. Sertsi et al. proposed VAD based on LSTM recurrent neural networks and modulation spectrum. They claimed that performance of the proposed system is better than conventional baseline methods in both seen and unseen type of noises [34].
Features used
In this section, motivation behind introducing a new speech feature "PLMS" and algorithm for extracting it are discussed. Also, other features of human speech for VAD used in this paper are discussed.
Peak of Log Magnitude Spectrum (PLMS)
It has been assumed in the literature that three formant values that keep the information of vocal tract are present in any speech frame of duration 15-25 ms. We analyzed the pattern of amplitudes corresponding to each formant values of human speech and also for the noise. We observed that amplitudes corresponding to all formant values for human speech show different characteristics than the real world noises. Hence, we introduced three PLMS coefficients as the three amplitude values corresponding to the three formant values of a speech frame of duration 15-25 ms. Here, PLMS coefficients of a speech frame is shown in Fig. 1.

PLMS feature coefficient of a speech frame corresponding to formant values.
Experimentally, it is also found that this feature is useful for VAD irrespective of language. Absolute values of PLMS coefficients for a frame are found to be in increasing order.
First PLMS coefficients of Airport noise at 0 dB and 10 dB are shown in Figs. 2 and 3 respectively.
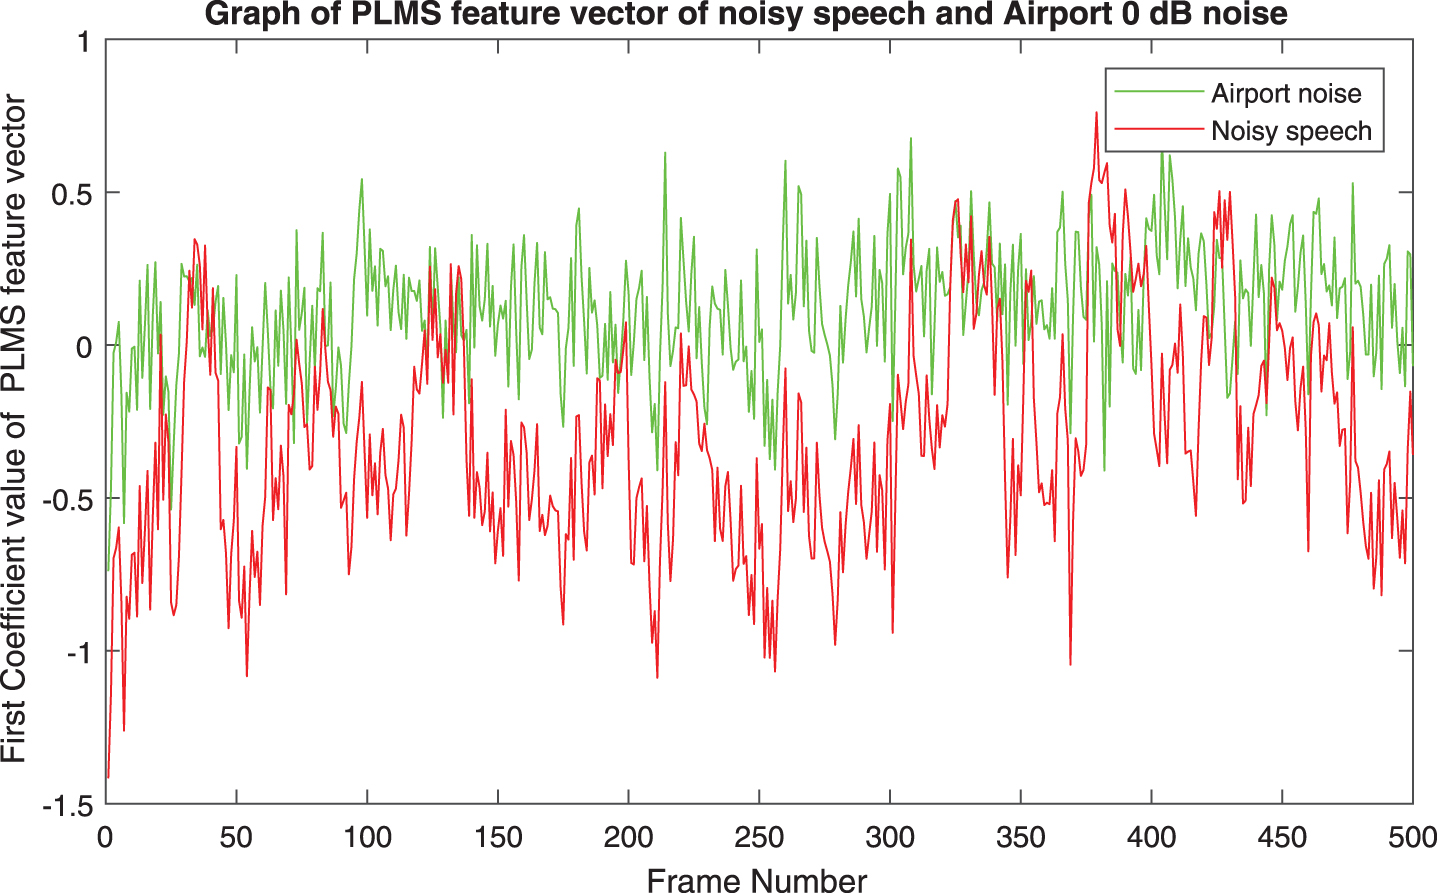
PLMS feature coefficient corresponding to first formant.
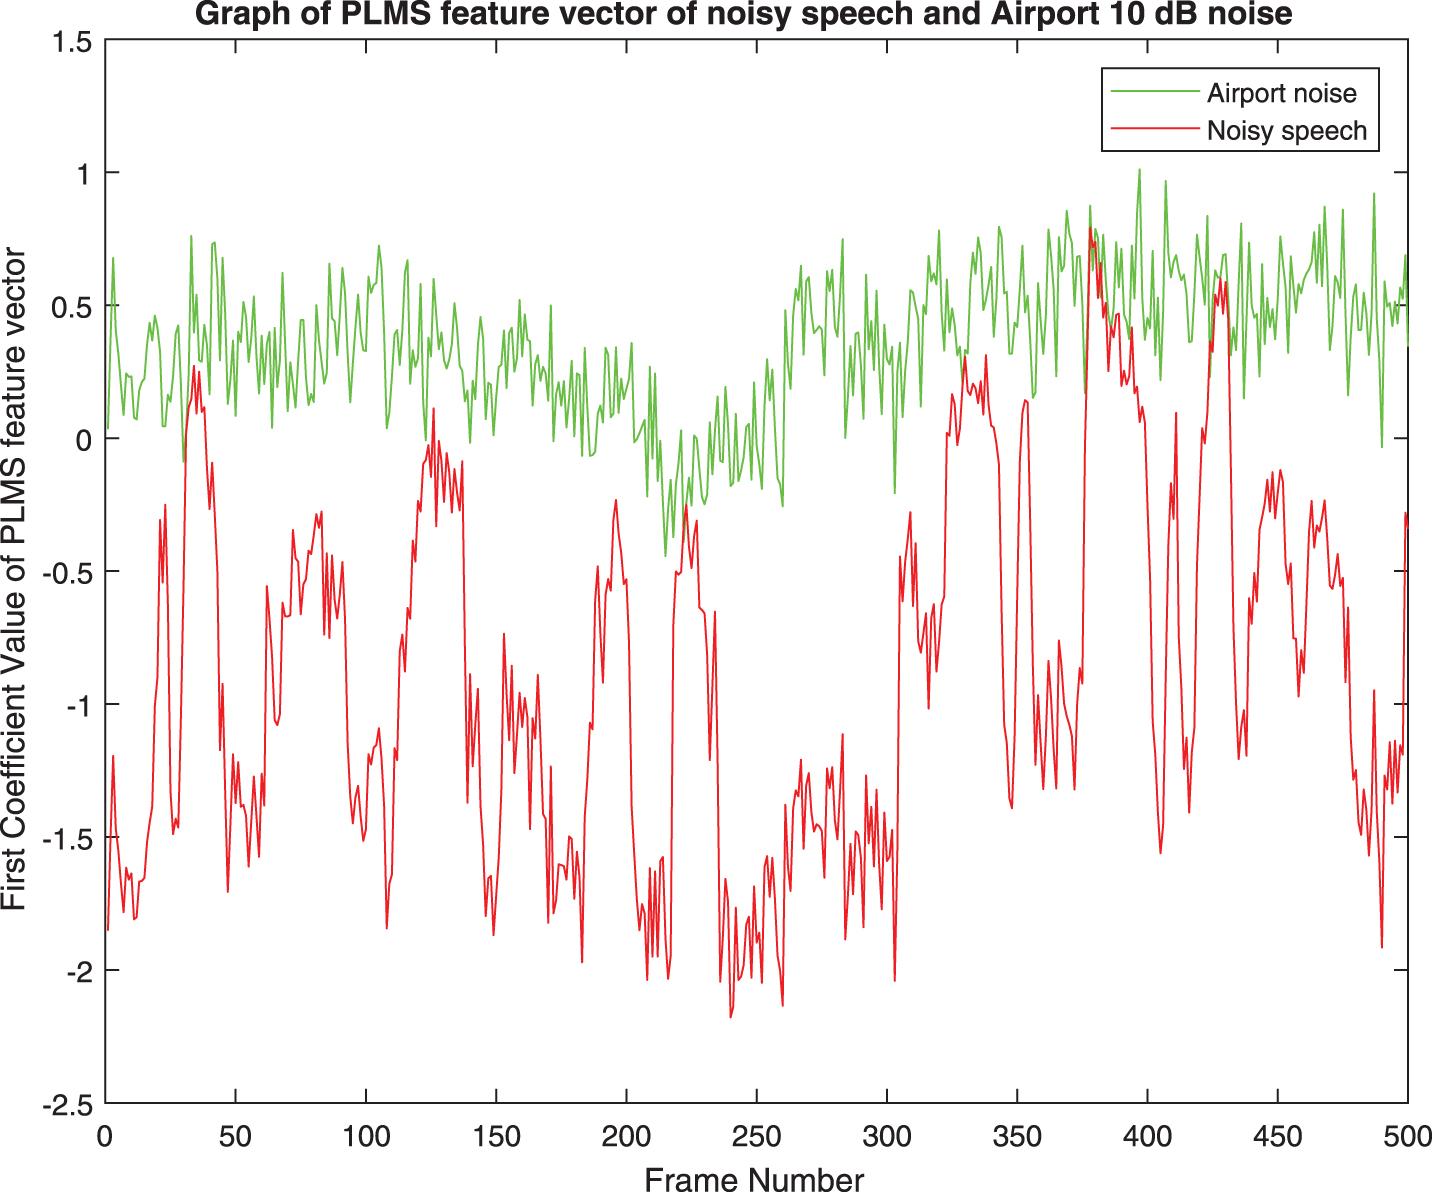
PLMS feature coefficient corresponding to first formant.
Algorithm 1 is used for extracting the PLMS coefficients of speech.
Algorithm for PLMS:
All the first coefficients of PLMS of speech signal at 0 dB SNR with noises (Babble, Car, Exhibition, Restaurant and Station) respectively are shown in Figs. 48. Gap between coefficients of noisy speech and noise is found to be almost same for all types of noises. Gap in the respective pair of coefficient vectors of PLMS increases with increasing SNR as found from Figs. 2 and 3. Same behavior is also observed with other types of noises used for experiments in this paper.
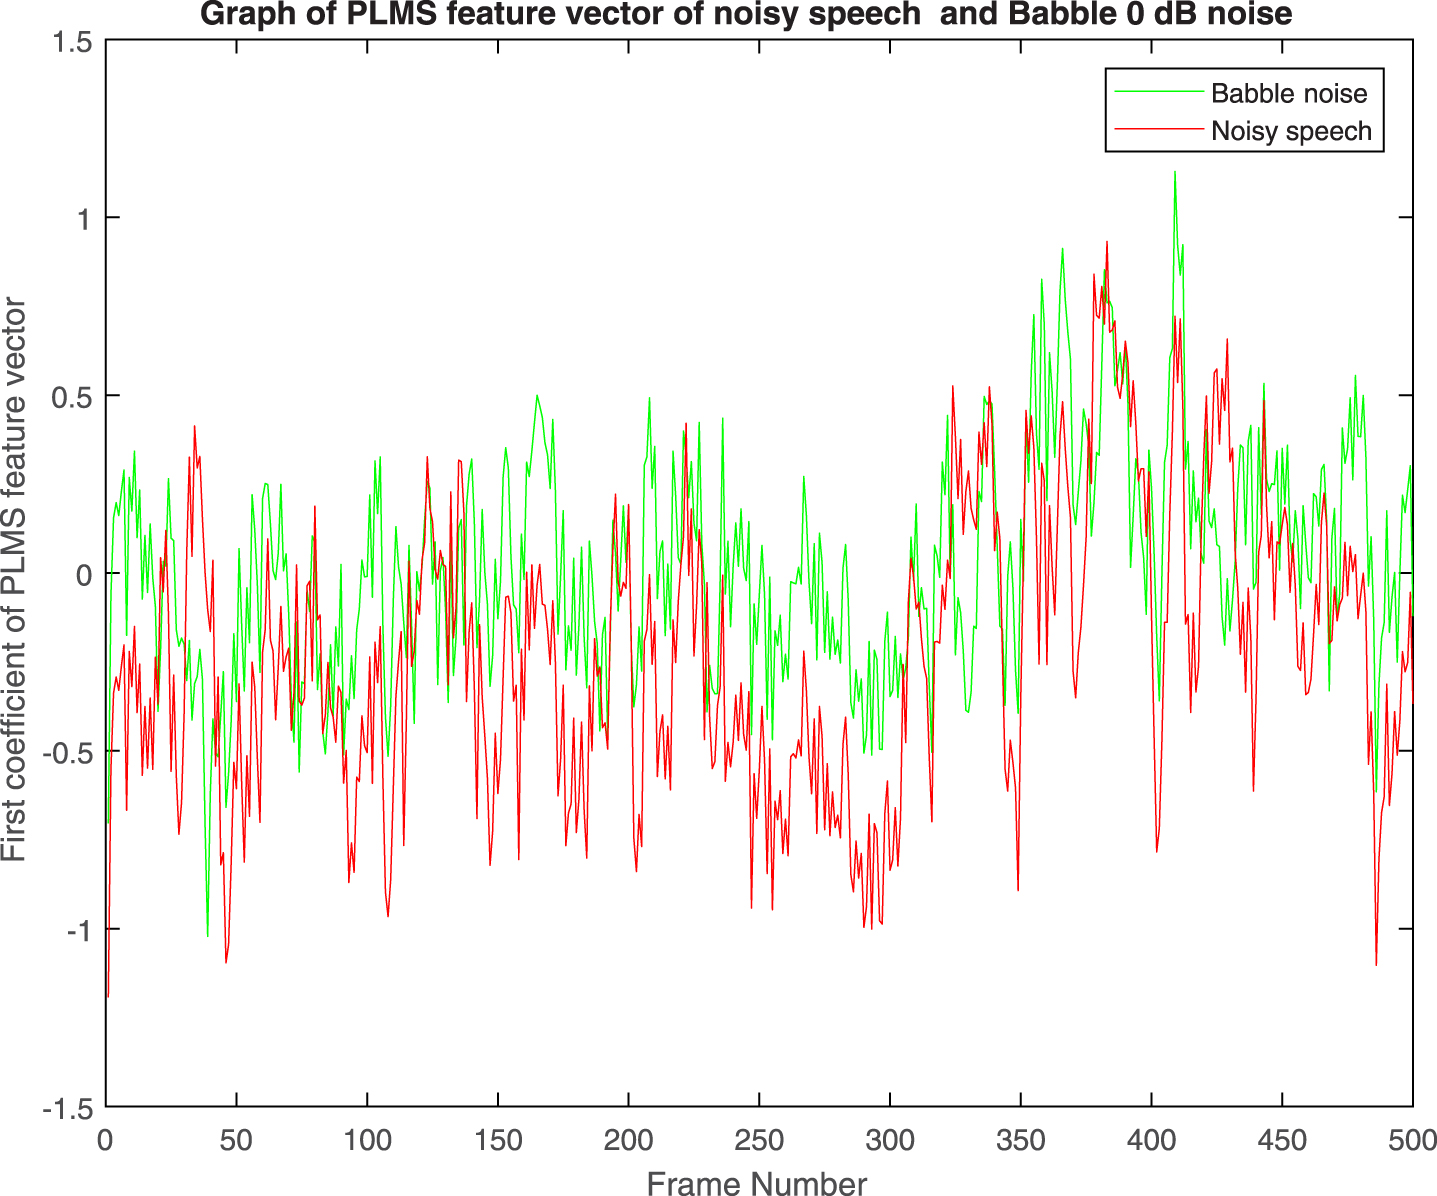
PLMS feature coefficient corresponding to first formant.
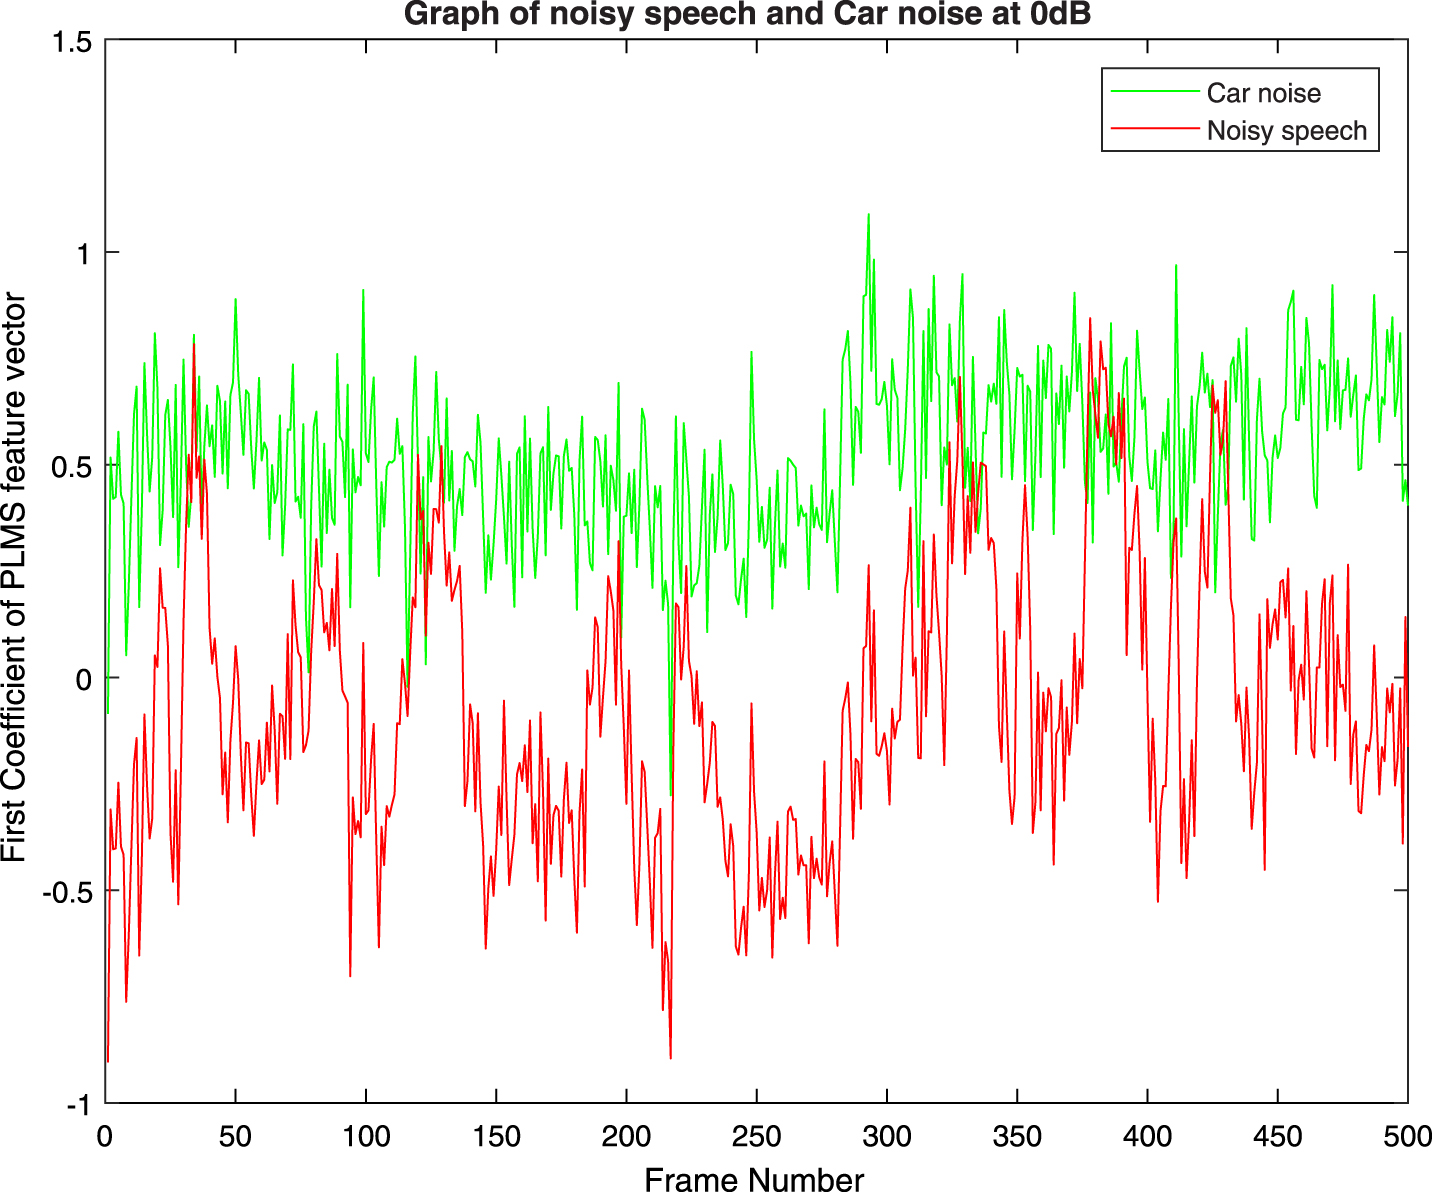
PLMS feature coefficient corresponding to first formant.

PLMS feature coefficient corresponding to first formant.

PLMS feature coefficient corresponding to first formant.

PLMS feature coefficient corresponding to first formant.
Mel Frequency Cepstral Coefficients MFCCs of speech are one of the most used features and are used for various purposes of automated speech signal processing tasks like speech/speaker recognition, speech synthesis etc. These coefficients contain the information about vocal tract envelopes that are used for representing spoken phonemes. Davis and Mermelstein [16] proposed this feature in 1980. Algorithm 2 explains the process of extracting these coefficients.
Algorithm for MFCC:
Algorithm for MFCC:
We have used the same procedure to extract RASTA-PLP and AMS features of human speech that is used by X.L. Zhang and J. Wu [27]. To calculate formant frequency same procedure as PLMS is used because PLMS coefficients are extracted corresponding to each formant value.
Parameters used for measuring the performance
False positive rate (fpr), true positive rate (tpr), average accuracy and time for extracting the features, modeling, training and testing of the classifiers are used for measuring the performance of the proposed system. Suppose in a given speech signal S, N is the total number of frames out of which N1 number of frames contain human speech while N2 number of frames do not include human speech (N = N1 + N2). Classifier classifies frames as shown in Table 1.
Classification results of classifier
Classification results of classifier
Parameters tpr, fpr and accuracy of a trained classifier are defined as per in Equations. (1), (2) and (3) respectively.
To extract the desired acoustic features of speech signal for VAD, MATLAB R.2015B has been used. All experiments are conducted in windows 8.1 on an Intel core i7 processor having 4 GB physical memory. Appropriateness of the selected features for VAD is confirmed by comparing the accuracy with two standard existing state of the art methods VAD G . 729 and Sohn VAD.
Dataset Used
NOIZEUS [29] database is used to measure the performance of the proposed approach. It contains 30 IEEE sentences (spoken by three male and three female speakers). These sentences have been mixed with eight types (Airport, Babble, Car, Exhibition hall, Restaurant, Railway station, Street, and Train) of real world noises at four different SNRs (0dB, 5dB, 10dB and 15dB) in it. Added noises have been taken from AURORA database. To verify the appropriateness of our selected features for VAD, experiments are also done using IndicTTS [35] dataset where sentences are spoken in 13 different Indian languages by male and female belonging to different regions of the country (India).
To create real life simulation environments, small sentences (size ≤10 sec) of the database are merged together to create sentences of size between 200 sec to 300 sec. Ratio of human speech and non-human speech (noise) are kept between 2:3 to 3:2 in these sentences.
SVM classifier is trained in six phases. In the first five phases, these classifiers are trained using combinations of three/four features from PLMS, MFCC, RASTA-PLP and formant frequency as shown in Table 2. Here, PLMS (3 ×1) represents 3 coefficients of PLMS per frame. Similar notations are used for other features.
Description of features used in different Phases of the experiment
Description of features used in different Phases of the experiment
Here, size of feature vector for a frame varies between 23 × 1 (In Phase 3, 23= 17 (MFCC) + 3 (Formant Frequency) +3 (PLMS)) to 43 × 1 (In Phase 5, 43 = 3 (PLMS) + 20 (MFCC) + 3 (Formant Frequency) + 17 (RASTA-PLP)). In the sixth phase of the experiment feature vector of size 273 × 1 is used to train the SVM classifier. To extract these features, input speech signal is divided into frames of duration 25 ms along with frame shift of 10 ms. To confirm the effectiveness of the approach, results are compared with two standard methods: VAD G.729 and Sohn VAD.
VAD G.729 is ITU-T standard that is applied for reducing the transmission rate during silence periods. Sohn-VAD [20] takes decision using statistical methods. Process for training of SVM classifier and to test the frame of new input speech signal is shown in Fig. 9.

Procedure to train SVM classifier and test new speeh signal.
In this subsection, experimentally obtained accuracy of trained SVM classifier is compared with the accuracy of existing state of the art approaches for VAD. Accuracy through SVM classifier in Phase1 to Phase6, VAD G.729 and Sohn VAD for four different SNRs (0 dB, 5 dB, 10 dB and 15 dB) are shown in Fig. 10 with Babble noise. From Fig. 10, it is found that maximum accuracy is obtained in Phase4, for SNR 0 dB, 10 dB and 15 dB. Accuracies for both Phase4 and Phase6 are comparable in case of 5 dB SNR. Among first five Phases of the experiments accuracy of the classifier is least in Phase2 (when PLMS coefficients are not used for training) at 0 dB, 10 dB and 15 dB SNRs. These two observations confirm the importance of PLMS coefficients for VAD.
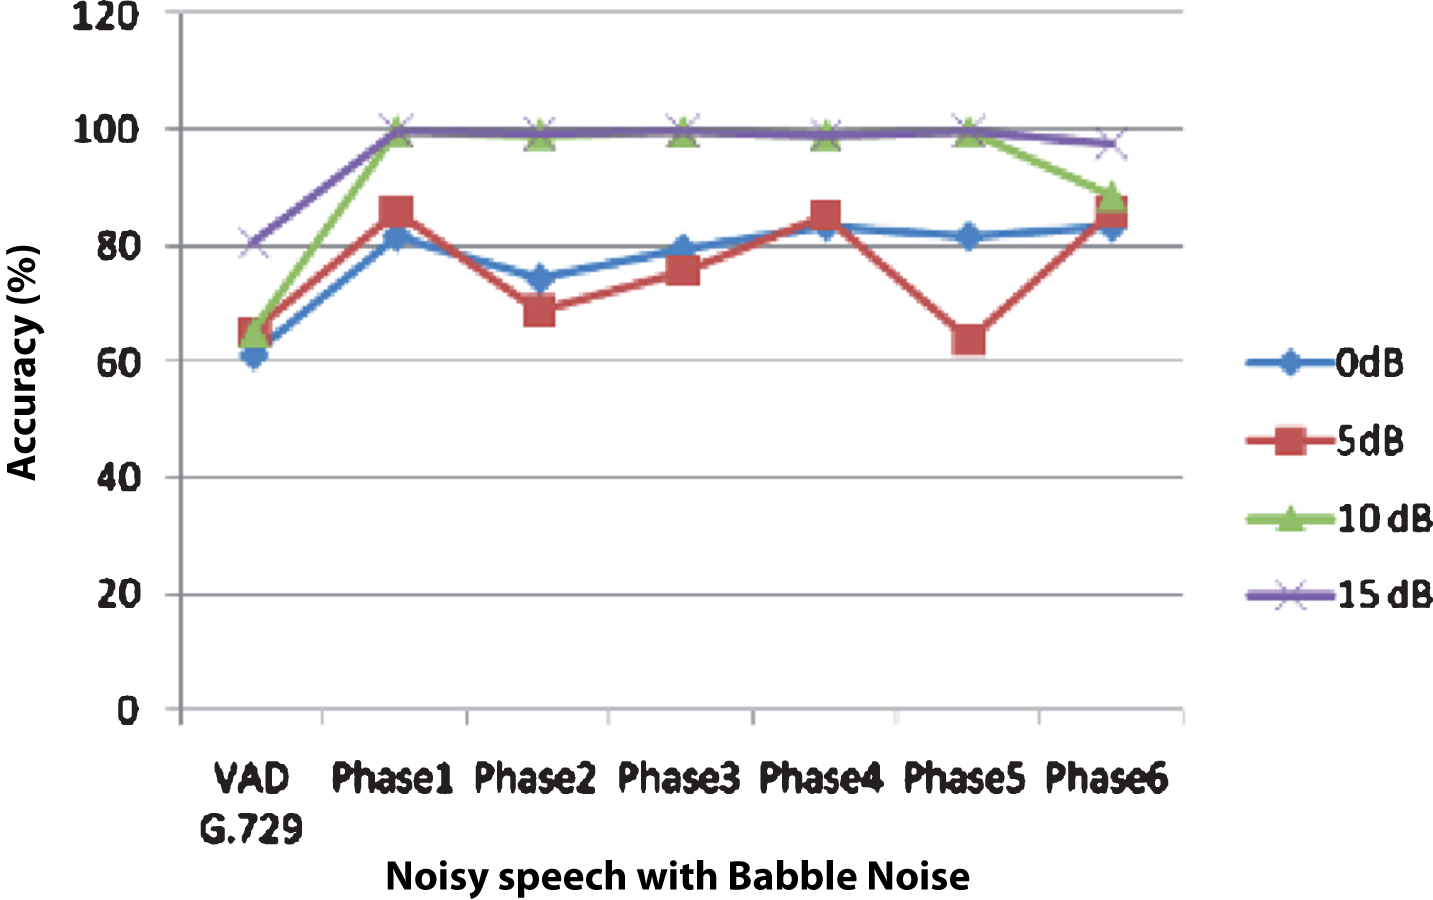
Accuracy of SVM classifier (in presence of Babble noise) in different phases of the experiment and VAD G.729.
Accuracy of SVM classifiers in all first five phases except Phase2 are almost same for noisy speech mixed with Car noise at 0 dB, 5 dB, 10 dB and 15 dB SNRs as shown in Fig. 11. It is also found that its accuracy is minimum in Phase2 where PLMS coefficients have not been used for training. These observations again support the importance of PLMS coefficients for VAD. Accuracy of SVM classifier in Phase3 is found to be highest when noisy speech contains Exhibition noise, Restaurant noise, Station noise and Street noise at 0 dB, 5 dB, 10 dB and 15 dB SNRs as shown in Figs. 1215. Among all the first five phases accuracy of the classifier is least in Phase 2.
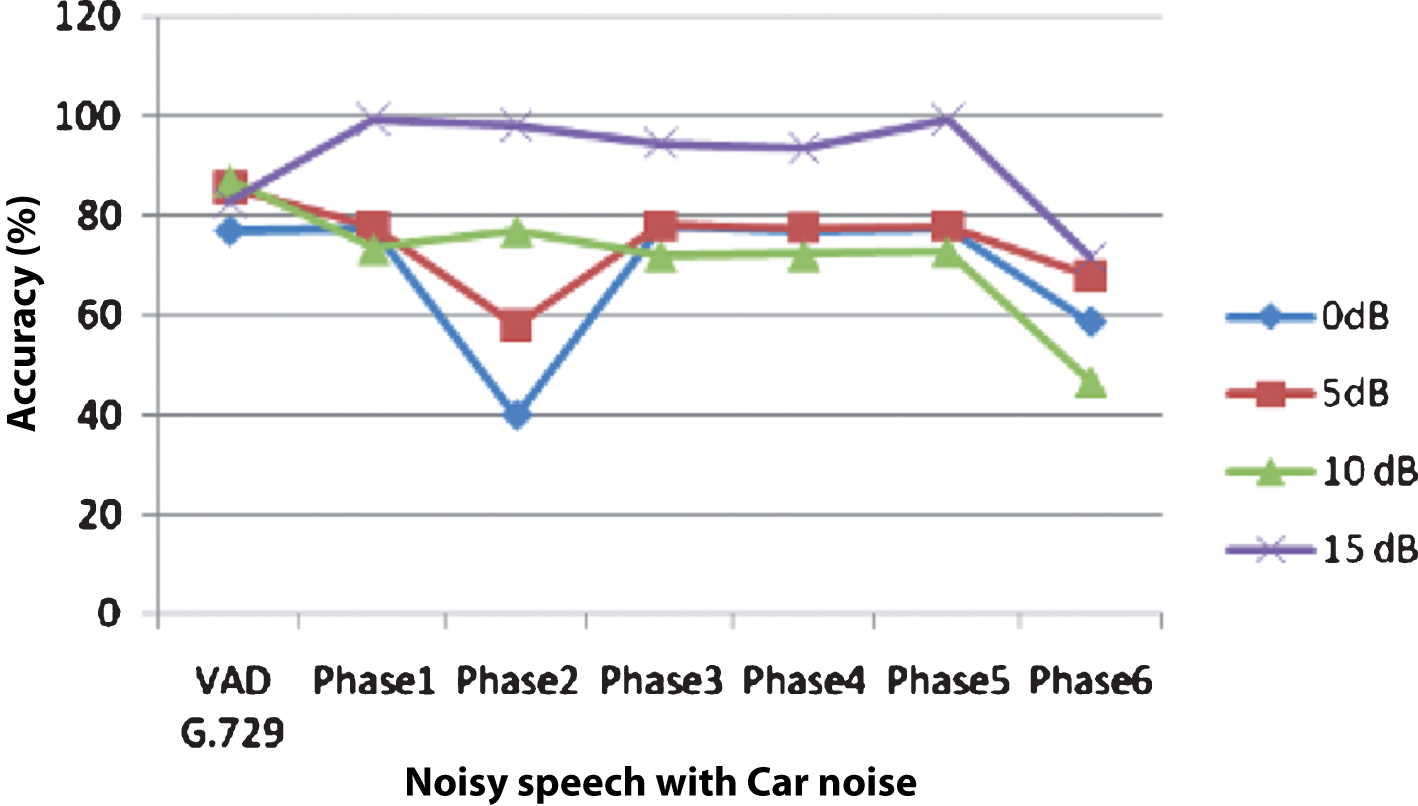
Accuracy of SVM classifier (in presence of Car noise) in different phases of the experiment and VAD G.729.

Accuracy of SVM classifier (in presence of Exhibition noise) in different phases of the experiment and VAD G.729.
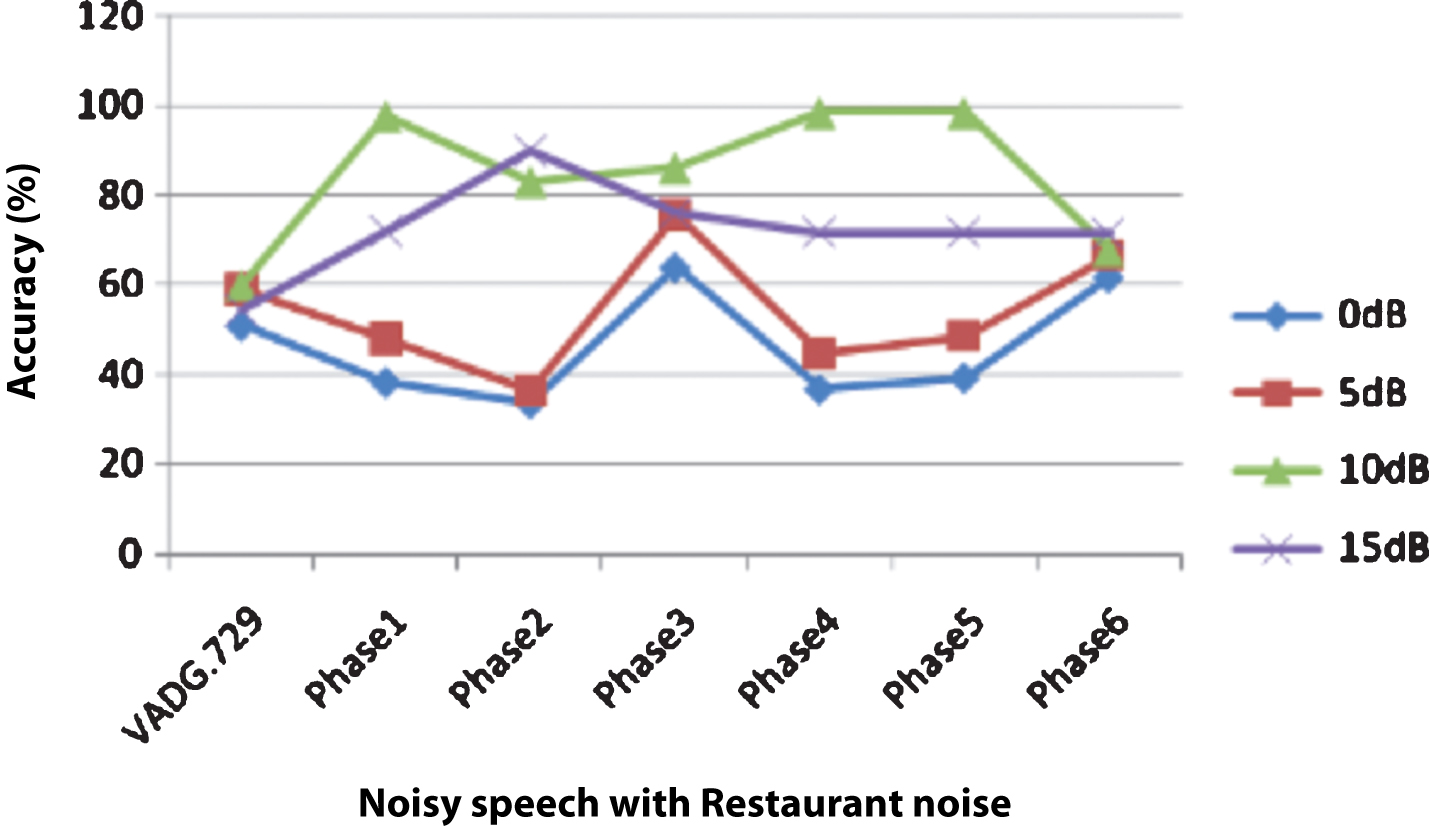
Accuracy of SVM classifier (in presence of Restaurant noise) in different phases of the experiment and VAD G.729.

Accuracy of SVM classifier (in presence of Station noise) in different phases of the experiment and VAD G.729.
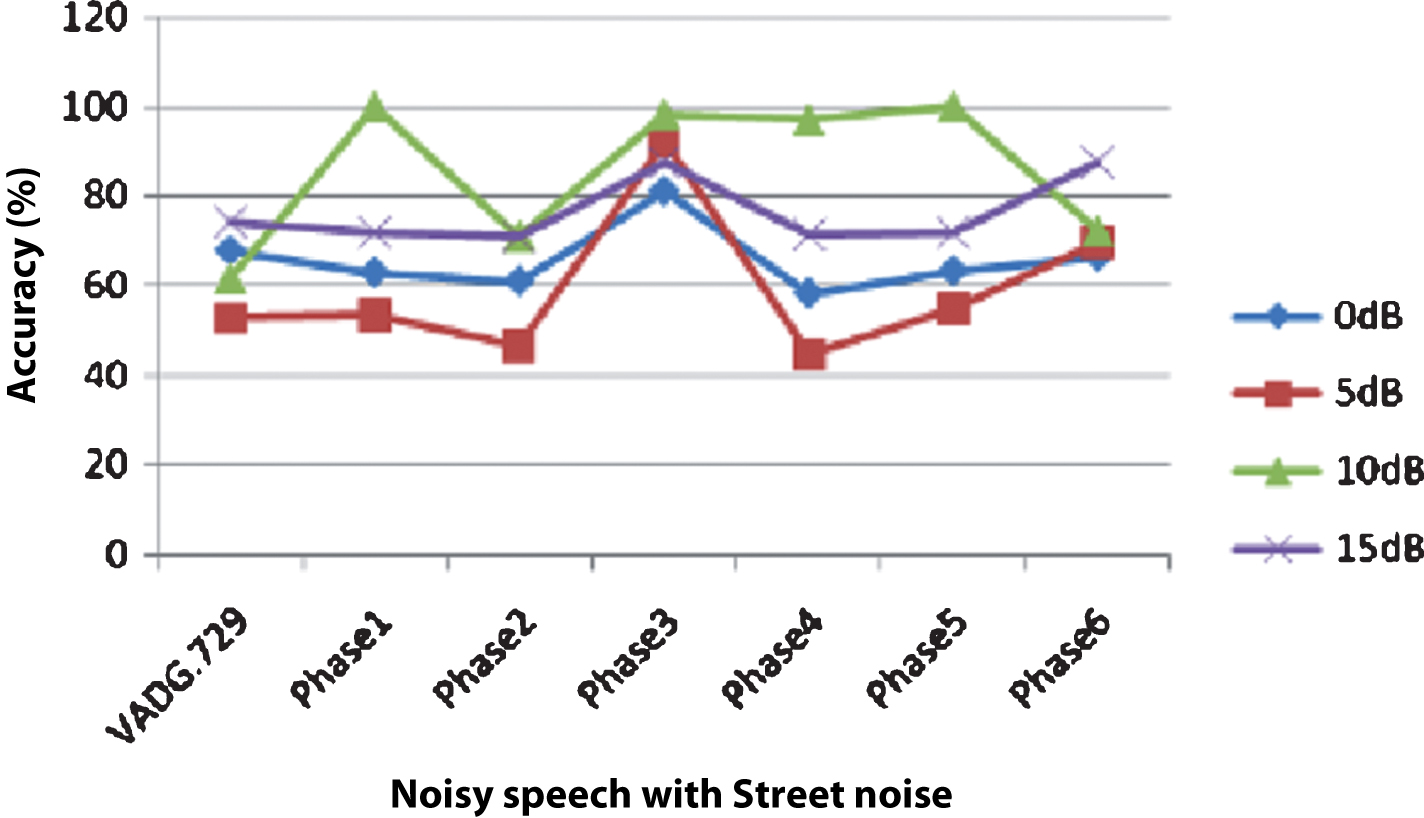
Accuracy of SVM classifier (in presence of Street noise) in different phases of the experiment and VAD G.729.
Accuracy of SVM classifiers in all first six phases except phase 2 are almost same while minimum in Phase 2 for noisy speech mixed with Train noise at 0 dB, 5 dB, 10 dB and 15 dB SNRs as shown in Fig. 16. It is concluded that higher accuracy is obtained of VAD through SVM classifier when trained with selected features of speech in first five phases except phase 2 in comparison to other state of the art methods (VAD G.729 and Sohn VAD). This proves appropriateness of the selected features. It is also observed that average performance of SVM classifier is least in Phase 2 (when PLMS coefficients are not used for training). Hence, it can be concluded that newly proposed PLMS feature plays a prominent role in VAD.
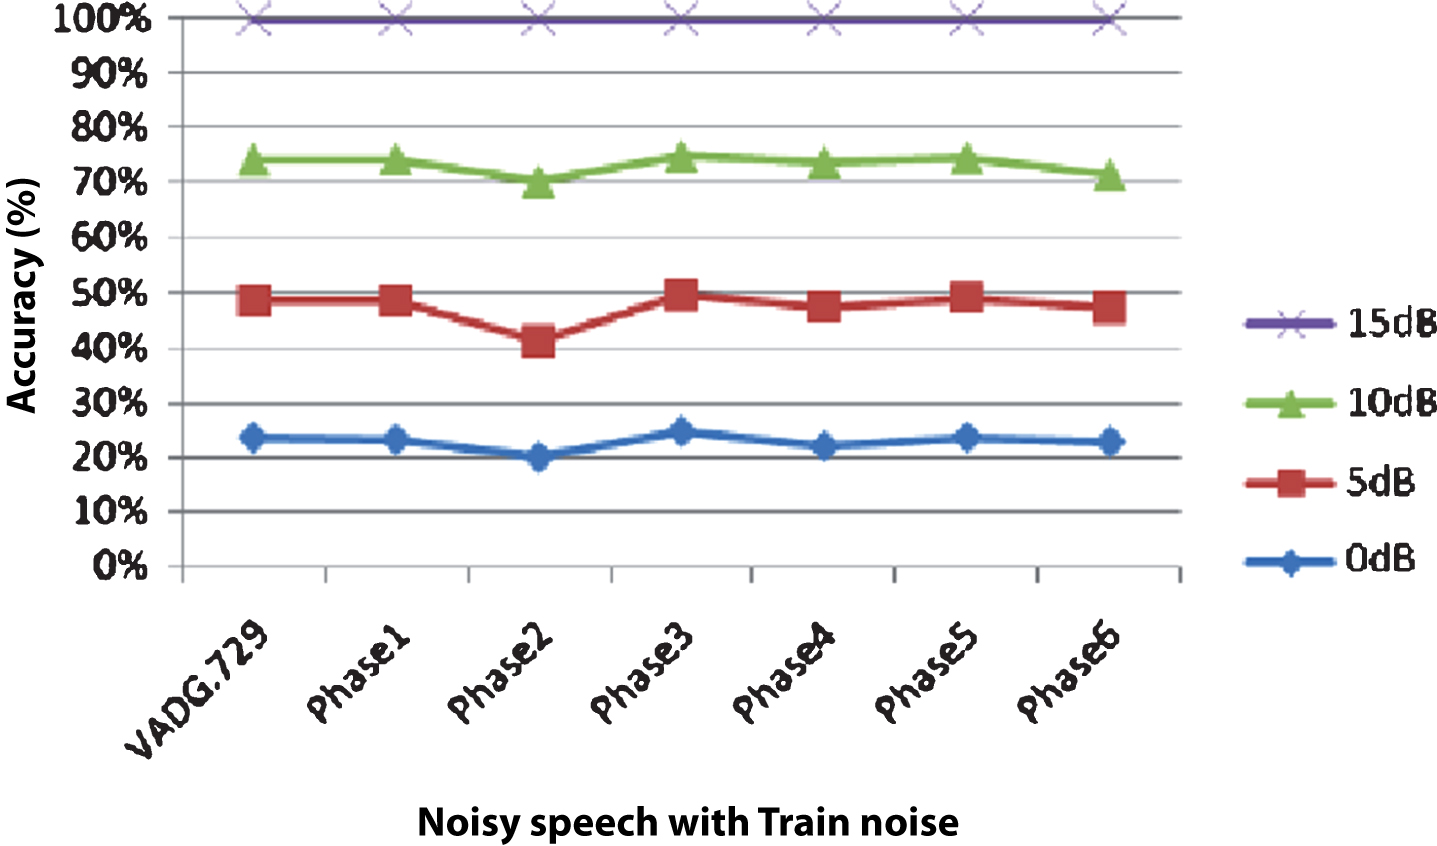
Accuracy of SVM classifier (in presence of Train noise) in different phases of the experiment and VAD G.729.
Comparison of accuracy for different phases of the proposed SVM based VAD and state of the art methods (G.729 and Sohn) for real world noises (Babble, Car, Exhibition, Restaurant, Station, Street and Train) are listed in Table 3. From the Table 3 it can be observed that accuracy is least in Phase 2 among first five Phases for most of the noises with SNR 0 dB which again confirms the effectiveness of PLMS coefficients for VAD. It can also be concluded from the Table 3 that PLMS coefficients are effective even for low SNR values.
Accuracy(%) comparison of referenced VADs (Sohn and G.729) with proposed SVM based VADs in different Phases
Comparison of true positive rate (tpr) and false positive rate (fpr) for different phases of proposed SVM based VAD and state of the art methods (G.729 and Sohn) for real world noises (Babble, Car, Exhibition (Exh), Restaurant (Rest), Station (Stn), Street and Train) are listed in Table 5. From the Table 5 it can be observed that tpr is least in Phase 2 among first five Phases for most of the noises. It again supports the effectiveness of PLMS coefficients for VAD.
tpr and fpr comparison of referenced VADs (Sohn and G.729) with proposed SVM based VADs in different Phases
Average CPU time (in sec) comparison in different Phases of the experiment
Time required to (i) extract selected features of speech signal (ii) training time required for SVM classifier (iii) testing of the SVM classifier and (iv) total time required for complete process are shown in Fig. 17. Feature extraction (F.E.) time, training time, testing time and total time are almost same in first five Phases and higher in Phase 6 of the experiment as listed in Table 4. In Phase 6, more time is required due to the larger size of feature vector for each speech frames.
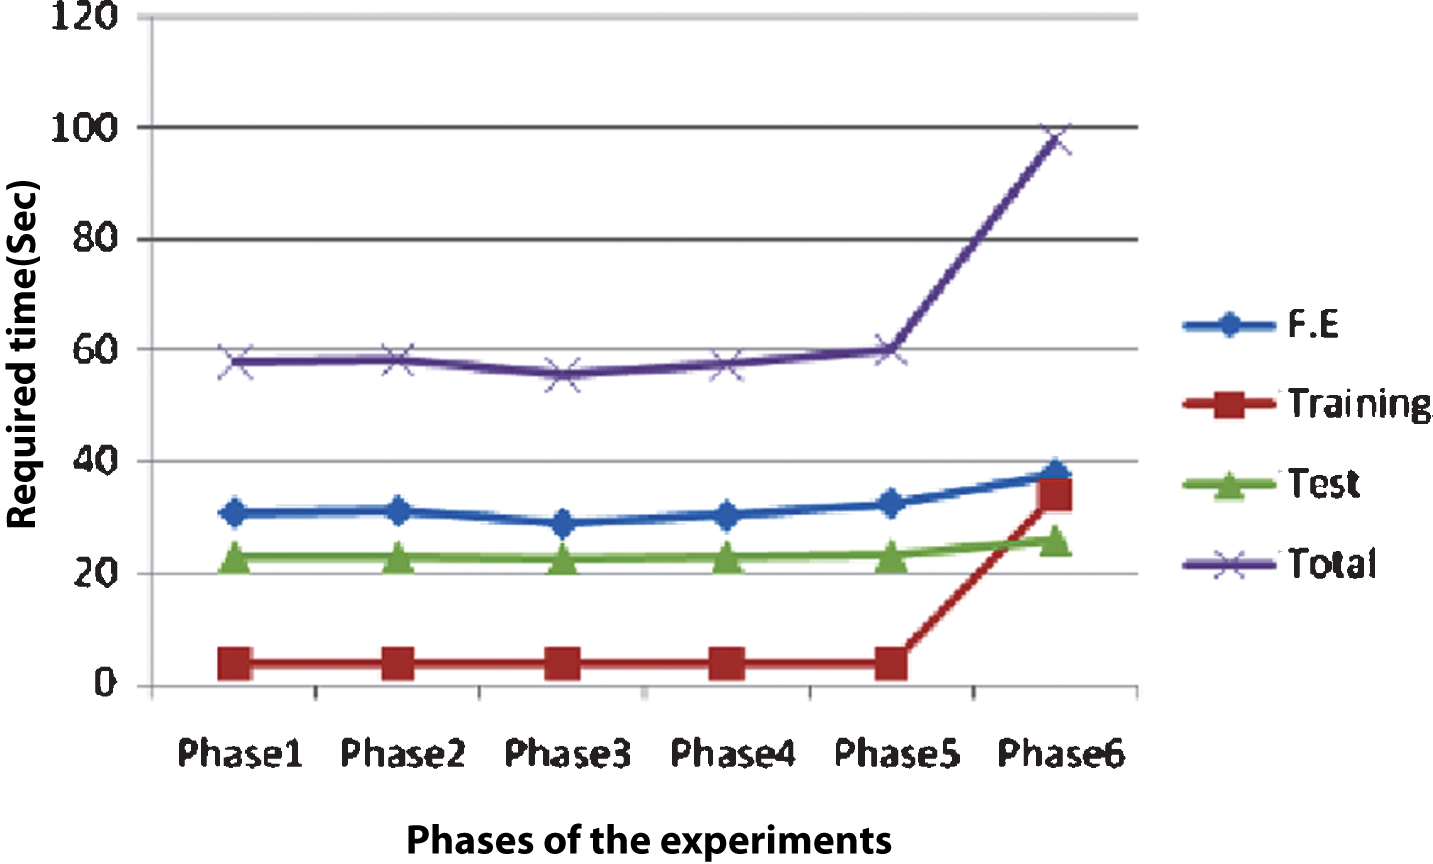
Time required in feature extrction (F.E.), training of SVM classifier, testing time and total time for different phases of the experiment.
From Table 4 it can be concluded that total time required for VAD in all first five phases is less than total time required in Phase 6. Hence, it can be more useful for real life applications like Internet telephony, hearing aid devices etc.
Applications of VAD depends upon total time taken by classifier to distinguish speech frames with or without human speech. Hence, selection of features play important role for robustness of Machine-learning based VAD. In this Paper, a new feature of speech PLMS is introduced. Experimentally, it is verified the effectiveness of this feature for VAD. Here, experiments are performed in six phases for selecting the appropriate combination of features for VAD. Experimentally, it is found that features: PLMS, RASTA-PLP and Formant Frequency (Phase 3 as shown in Table 2) is the best combination for the proposed SVM-based VAD. It is also found that features: PLMS, MFCC and Formant Frequency (Phase 4) is the best combination for Babble noise. The proposed set of features in both Phase3 and Phase 4 take smaller time comparison to time taken in Phase 6 which makes it appropriate for real life applications like hearing aid devices, online audio chat etc.
In future, applications of the new proposed feature PLMS can be applied in other speech processing areas like speech recognition, speaker identification, language identification etc. for increasing the accuracy and reducing the computational time required.