
Abstract
There exists a huge amount of ECG data available in heart disease diagnosis which is found difficult in handing. Recently, many researchers focused on mining disease diagnosis to innovate the hidden patterns and their relevant features. Mining bio-medical data is one of the predominant research areas where clustering techniques are emphasized in heart disease diagnosis. But few people deal with large heart disease datasets and then classify disease data sets according to heart disease feature. We propose a method of anomaly threshold based on multiple classifiers can be well suited to datasets containing abnormal data, and use XGBoost algorithm as a sub-classifier to process massive ECG data. This research focuses on the heart disease classification problem. The data set is divided into two categories, and then it was classified into more specific categories, experimental results show that this method can improve classification accuracy. The experiments are conducted on massive instances of different heart disease obtained from the hospital actual cases and two data sets of UCI. In fact, we compared SVM, C4.5, Naive Bayes, Logistic, RandomForest and XGBoost algorithms, and found that tree-based model classifier is the best fit to predict arrhythmia. The method proposed in this paper is of great significance to the processing and forecasting system of large medical data sets, and promote the development of wisdom medical care.
Introduction
Nowadays, the aging of the population, chronic cardiovascular and vascular diseases and unhealthy lifestyles exacerbate the incidence of heart disease. So, it is of great significance to find an effective way on heart diseases detection and prevention, and what is important is heart disease classification; that is to obtain the data of heart disease, analyze and classify it and get the effective information.
The data is usually from the electrocardiogram (ECG), which is the process of recording the electrical activity of the heart over a period of time using electrodes placed on the skin. These electrodes detect the tiny electrical changes on the skin that arise from the heart muscle’s electrophysiologic pattern of depolarizing and repolarizing during each heartbeat [11, 15]. As a very commonly performed cardiology test and the main analysis tool recording the changes of human heartbeat in the biological potential, it provides valuable information of cardiac rate and cardiovascular system functions. However, since the ECG heartbeat processing is a kind of biological signal, the reflection may appear randomly. In addition, it is common to meet a large amount of data and multiple patients situations. So there needs a long time to observe the ECG signal pattern and heart rate variation to diagnose heart disease [2]; especial when it is doctors that manually analyze the waveform, which not only make medical staff constrained, but adversely affecting the treatment of other patients. As we all know, it is the trend of the society to establish an automatic system to reduce the workload of humans, and it is applied likewise to the medical fields called wise information technology of 120(WIT120), which is a combination of bioscience and information technology [14, 16]. It aims at making real-time and reliable prediction and detection of diseases, achieving the effect of intelligent matching biosphere, building interactive platform for information sharing through the review of the previous electronic health records. The medical service model of WIT120 is centered on patient data, and it is the data classification and knowledge discovery technology that mainly support that [19].
So in order to increase efficiency of the ECG data analysis, we should at first know about data analyzing and knowledge discovery tools to find a better way for the medical applications. The machine learning method, a data-driven discipline, is the main analysis method in recent researches of classification, and it consists of two important steps: feature extraction and classification model training [1]. There appears all kinds of models these years for data mining and heart disease classification. The classification methods in use are mainly artificial neural network(ANN) based methods, support vector machine(SVM) relevant methods, associative methods and tree-based models, and they sometimes are not used alone. For example, the classification methods based on artificial neural network, like a hybrid method using fuzzy weighted prep-processing and artificial immune recognition system (AIRS) showed an effective performance on machine learning benchmark problems and medical classification problems [13]. It used k-fold cross-validation method and confusion matrix [9] to obtain a high accuracy. Others like REF neural network and BP neural network have their advantages. However, the obvious drawback of this kind is the complexity, which makes it difficult to train [1]. About the vector machine relevant model, the relevant vector machine (RVM) as a time-frequency analysis to classify, and combining with the rough k-means to form a hybrid recognition method can get good performance, but it neglected the data reprocessing which is very important in machine learning fields. Associative classification as a recent rewarding technique which integrates association rule mining and classification is a pretty good model for prediction [9], but it is n’t suitable for a large data set. The use of tree-based methods offers good performance. Regression trees for predicting and classifying HF sub-types in a population-based sample of patients from Ontario, Canada proved valid [10]. XGBoost model, a kind of gradient tree boosting method, we use in the paper is a tree-based method as well. It has been proved to produce state-of-the-art results on multiple machine learning problems [7, 12] and as a scalable machine learning system for tree boosting and an effective and extensible gradient framework implementation, it includes an efficient linear model solver and tree learning algorithm [3, 8], which makes it converge faster than deep belief network (DBN) [5], and have a better performance in different datasets. Those make it outstanding over other tree-based models. What else, the user can modify the package according to their needs to customize their own goals. It is widely used in data mining fields and machine learning projects nowadays, and the impact of the system has been widely recognized in a number of machine learning and data mining challenges. For example, in the machine learning competition hosted by Kaggle site in 2015,17 solutions used XGBoost among 29 winners. Among them, eight solely used XGBoost to train the model, while most others combined XGBoost with neural nets in ensembles. And the second popular, deep neural nets, was only used in 11. It achieved a greater success in KDDCup 2015, where was used by every winning team in the top-10 [17]. In this research, a large dataset which consists of different types of attributes is used to train the classification model. For complicated situations, we make experiments for several times, and in order to find a better solution, we propose multiple schemes to deal with that, and finally get a fine model and pleasure results both in training and testing stage.
The experiment data materials
Question definition and algorithms
This paper constructs a multi-classifier classification task based on threshold data, according to the characteristics of the bit value (such as quartile) as C4.5 split points.They are used to divide the ranges of data into different parts, each of which used to construct a sub-classifier, and then the average classification accuracy of those standard sub-classifiers are computed to evaluate the whole.This article uses different algorithmic models as sub classifiers for comparison.
Why is XGBoost the best classifier as a sub-classifier? Regularization upgrade; Parallel processing (multi-threaded stand-alone CPU, support for GPU acceleration, support for distribution) A high degree of flexibility(Allows users to customized optimization goals and evaluation criteria); Pruning(Split to the specified maximum depth and then prune it); Support multiple language interfaces
The accuracy of the model was verified by 10-fold cross-validation.
Model and algorithm
XGBoost (eXtreme Gradient Boosting) is based on gradient descent to combine a weak learner/model to become a strong learner. Actually refers to the engineering goal to push the limit of computations resources for boosted tree algorithms [6].
Regularized learning objective
Given a data set D (D = {(x
i
, y
i
)} (|D| = n, x
i
∈ R
m
, y
i
∈ R)), and n is the count of samples and m the count of features. To predict the output, we introduce a function called K additive function as follow:
We will use a set of functions in the model, and the first step is to minimize the regularized objective.
Where
The tree ensemble model in Equation (2) includes functions as parameters but how to optimize that? The traditional optimization methods are used for the Euclidean space. So we should find another way to train our model. Let’s look at the improvement of Equation (2) as follows:
We expand the regularization term Ω here, so the Equation (3) can be rewritten as:
Define l
i
= {i|q (x
i
) = j} as the instance set of leaf j. Use it and improve right part of the equation above. Here is what we get:
For a fixed structure q (x), we can compute the optimal weight
Equation (6) is the scoring function. We use it to measure the quality of the structure q. This score is like the impurity score for evaluating decision trees, except that it is derived for a wider range of objective functions [4]. The tree structure q is usually too hard to enumerate one by one. So we instead use the greedy algorithm which starts from a single leaf and iteratively adds branches to the tree. The instance sets of left and right nodes after the split, which we use I
L
and I
R
to respectively represent, are extracted, and combined as another set I (I = I
L
∪ I
R
), then the loss reduction after the split can be quantized by the three sets. That is:
This formula is usually used in practice for evaluating the split candidates [4].
In our experiments, a large heart disease dataset with 202594 instances are collected from the database, and all the original data of our research are collected from the real cases.
We used three data sets. The first data set we use is from first people’s hospital of Yunnan province new kunhua hospital. The task is to predict the likelihood of heart disease of patients’. The Dataset of ECG contains the heart rate, the wavelength, the wave width, and the leads of the limbs and the leads of the chest. QT, PR are different waves, Rv1 and SV1 are leads, and P_width is the wavelength of p-wave. And all attributes are continuous. In this experiment, we simplified the task to a binary classification, which is heart disease represented by ‘–1’, and analysis by ‘1’. It contains 13 cardiac attributes provided by the data set the minimal and maximal value listed, and the average and standard deviation calculated in Table 1.
Datasets of Binary classification
Datasets of Binary classification
To further classify these data for different risk factors. We extracted the ‘1’ data from the first data set, and produce the second, and divided it into six categories by experiments. They respectively are:’1’ for sinus rhythm,’2’ for Sinus bradycardia, ’3’ for Sinus arrhythmia, ’4’ for Pacing rhythm,’5’for Right bundle branch block, ’6’ for atrial flutter.
The third one is a UCI dataset from the UCI official website, which is one of the most commonly used benchmarks of data acquirement. They are ecoli dataset and spectf data set. The uci data set will be used for the data imbalance problem by SMOTE algorithm, which would be described later part of this paper.
We conduct the experiment to evaluate the algorithm proposed before. Because of issues such as errors caused by the experimental instruments, inconsistent measuring by individual differences and unreliable diagnosis that is for inferences only, there are many abnormal instances in the ECG data from First people’s hospital of Yunnan province new Kunhuna hospital. If we just simply delete the abnormal ones, it would definitely cause sizable quantities of instance loss, and make the classification model useless for the new abnormal instances. The ECG data from the hospital is binary classified, and after comparing part of the attribute values, we visualize them as Fig. 1.
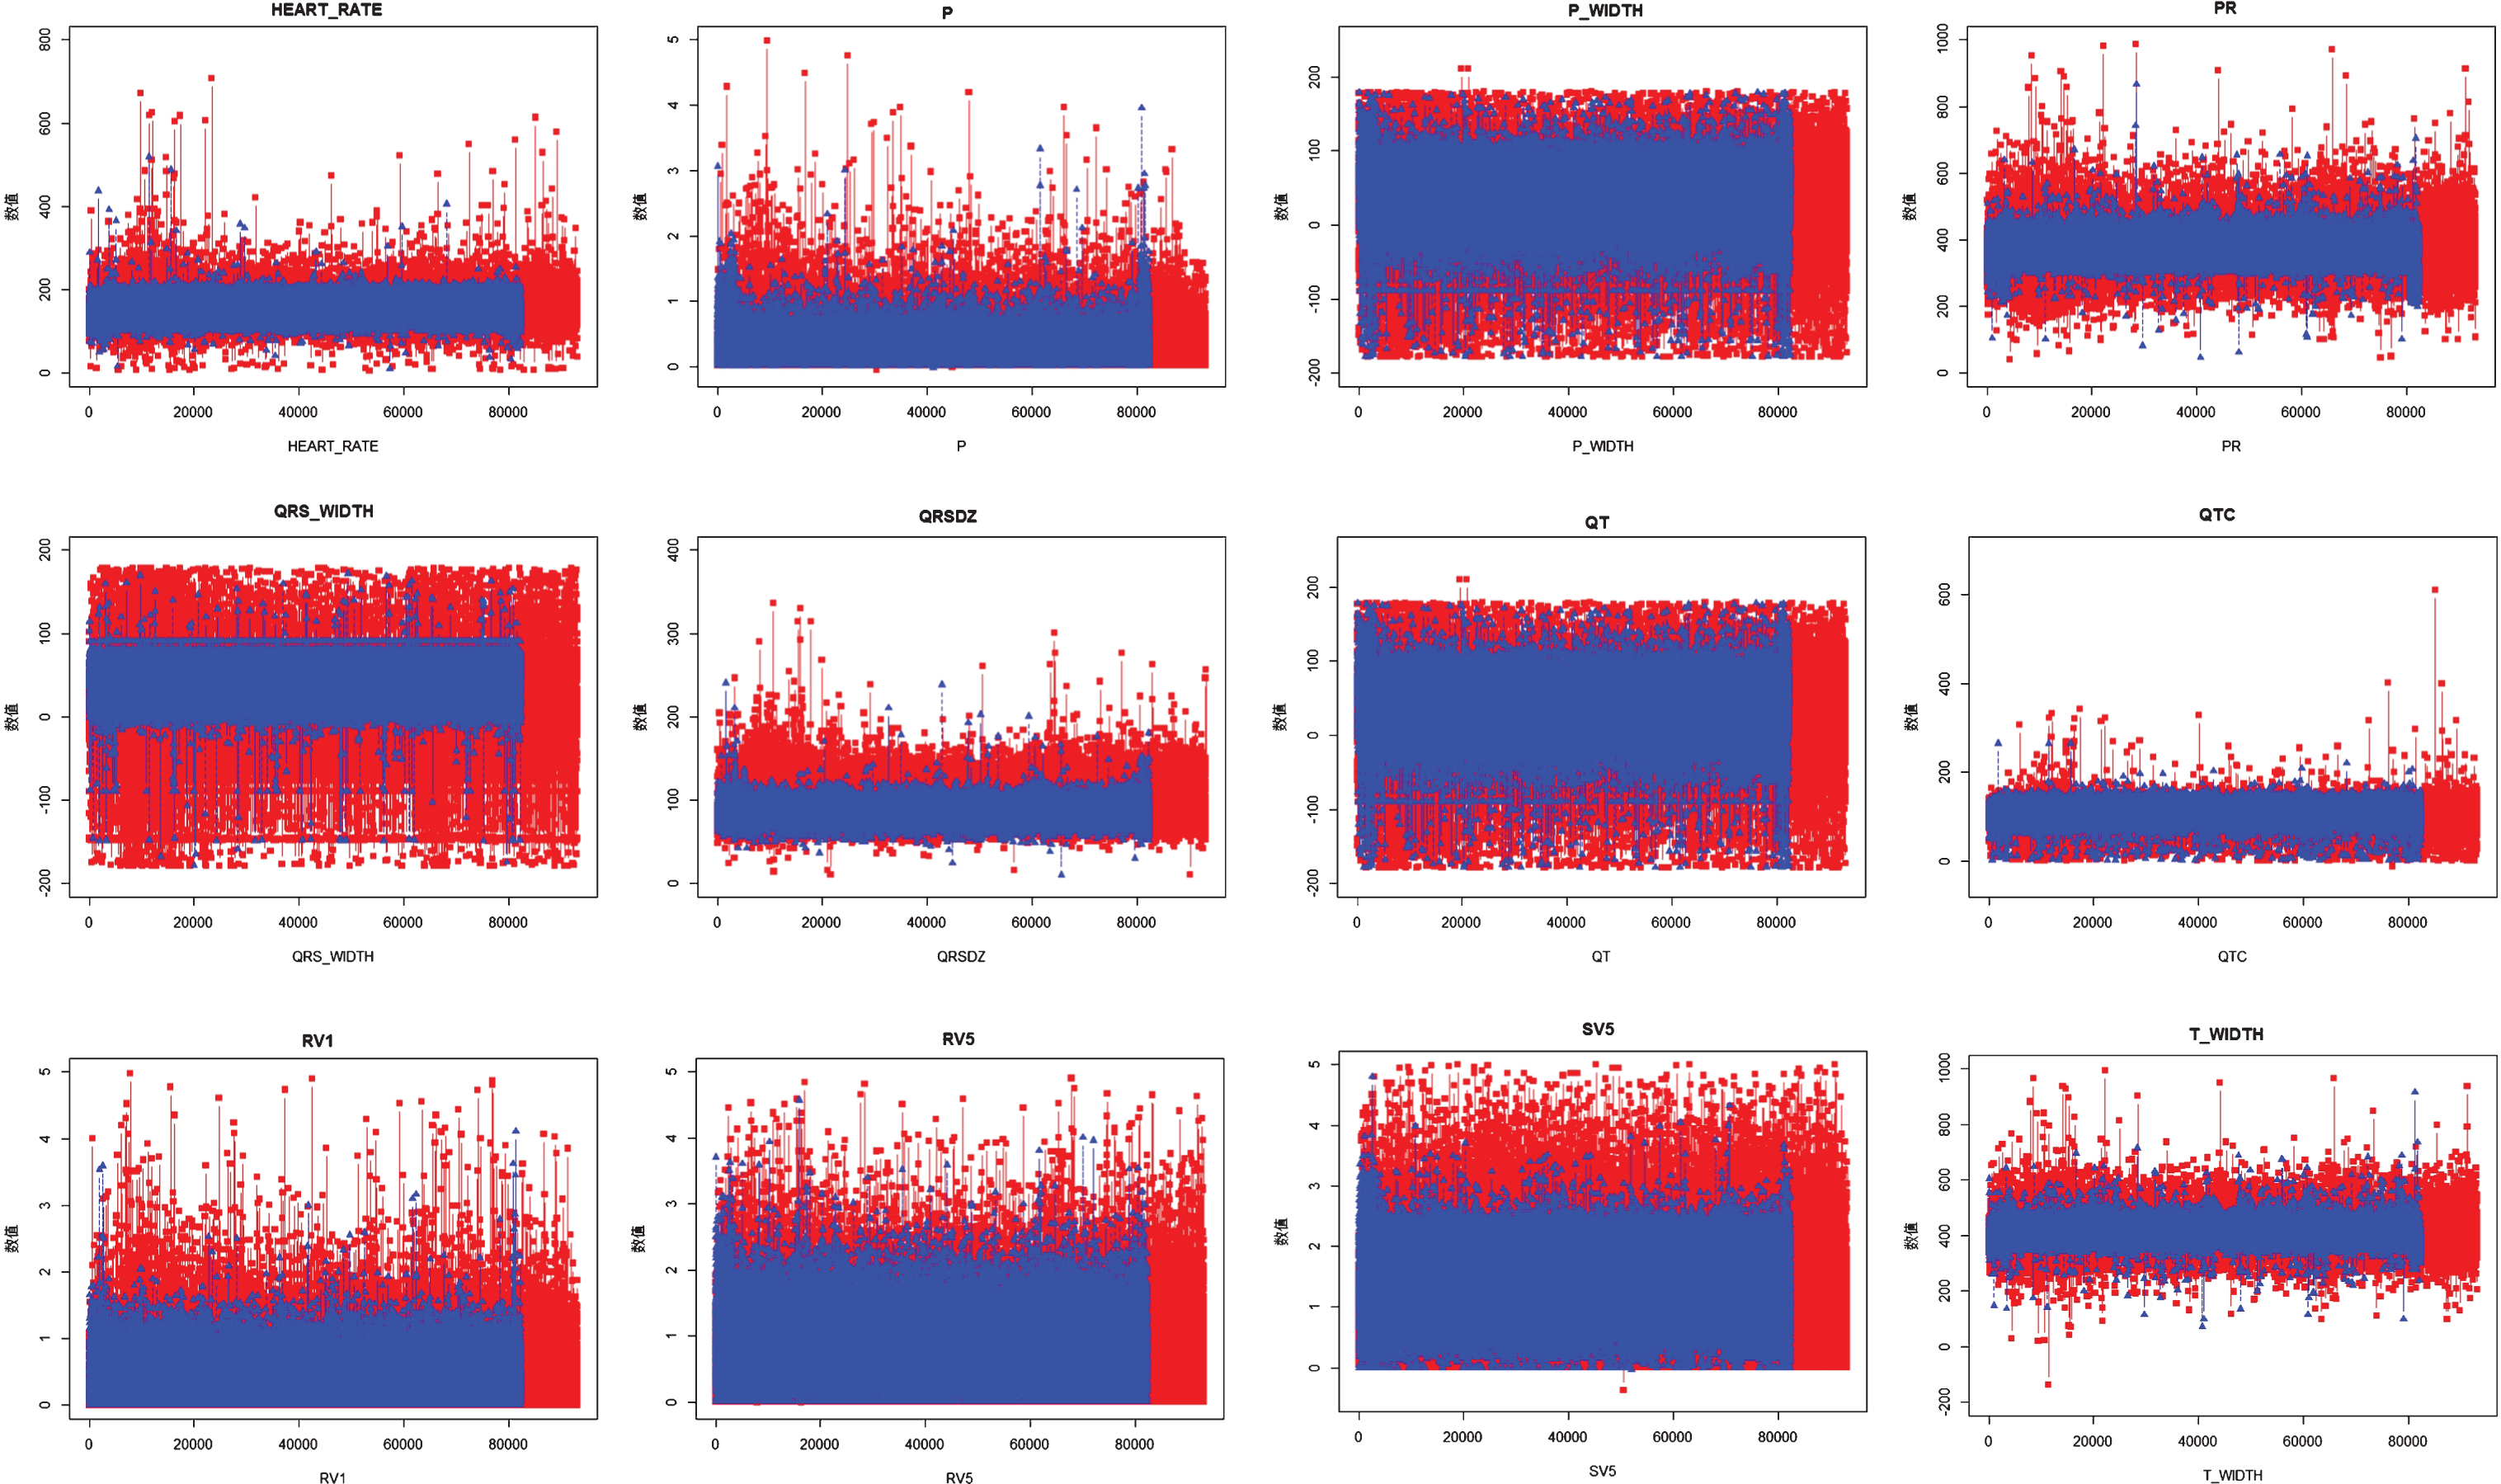
Comparison of attribute values.
The red part in the figure stands for the features of normal instances, and the blue part is cardiac arrhythmia. The arrhythmia region is larger from Fig. 1, and abnormal thresholds of both kinds frequently appears in particularly huge and tiny data.
Instead of pre-processing the data, we analyse them with medical knowledge, and find many abnormal attribute values. We classify the non-pre-processed data with XGBoost, SVM, C4.5, Naive Bayes, Logistic and Randomforest classifiers.
It shows the highest data accuracy is from the XGBoost classifier, with 76.68% by 10-fold cross-validation.
The built-in feature selectors of XGBoost show the weight of every feature to the model’s training by scoring, namely, the features are chosen by the scores. The scores of not pre-processed data are shown in Fig. 2.
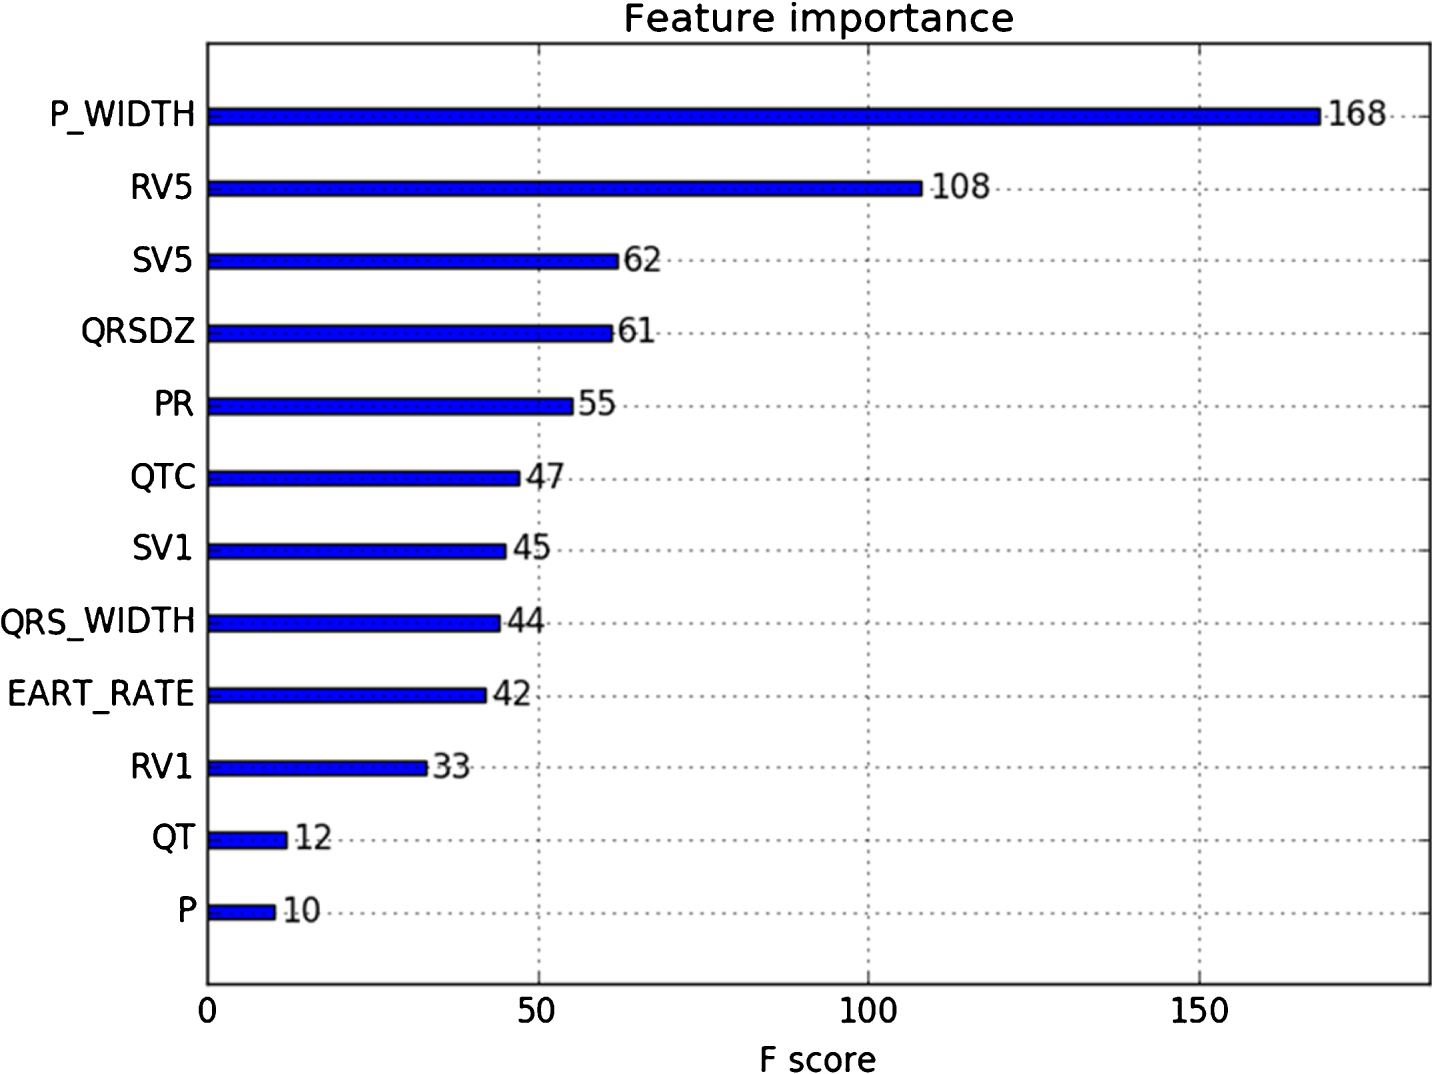
Feature score.
The pre-processing of the massive data is mainly for those abnormal instances.There are two ways for that: one is to directly delete the abnormal instances, and the other is an interpolation.
The former one, which can be called the outliers deletion(interpreted in Table 2), is used for the unimportant absent variants and attributes with abnormal characters when the amount of instances is large. The method is usually used for clustering and classification. While when the amount is small, the missing values are exactly the key, or regular variation is shown in the instances with time, it is non-trivial to interpolate. The common-used interpolation is shown in Table 2.
Abnormal interpolation method
Abnormal interpolation method
We use the method called outliers deletion to deal with the instances, namely, to delete the ones with a column of abnormal attribute values. And there are 80758 instances left after the deletion.
It is easy to find from the improvement of classification accuracy after the instance deletion, and the XGBoost classifier performed the best, with 85.58%.
Interpolation
As is shown in Table 2, there are multiple methods for the abnormal attribute values. We choose three of them in this experiment, which are fixed value replacement, mean value and Calorie interpolation.
We determine the outliers based on the medical knowledge and the peak value of the instrument. The classification accuracy of the three interpolation methods did not increase much, fluctuating around 75%. The best algorithms one of them, however, is still the XGBoost.
Multi-classifier based on abnormal thresholds
To deal with the data, we specially establish a multi-classifier for the instances within the abnormal thresholds. The entries are firstly divided by the decision tree into two parts according to the thresholds, and to build two classifiers respectively. The overview of the model is illustrated in Fig. 3. The experimental results produced from the 202594 instances shows a better classification accuracy through the threshold partition than constructing one classifier, with up to 80% for data 1, and 79.5% for data 2. And it performs the best when the data is divided into 8 parts and 8 classifiers respectively built for them simultaneously.
What the decision tree model we used for the threshold partition is C4.5.Data 1 and data 2 are processed from the instances after the C4.5 classification. In the same way, the two data sets are respectively split by the C4.5 to produce data 3, data 4, data 5 and data 6. We would finally get 8 parts after the partition, and build 8 sub-classifiers with different algorithms. We may obtain a higher accuracy with more classifiers, but it easily causes the over-fitting problem that way. So we should specifically do the analysis for the given cases and balance the classification accuracy and over-fitting issues. The C4.5 algorithm uses data quantiles for the threshold partition.
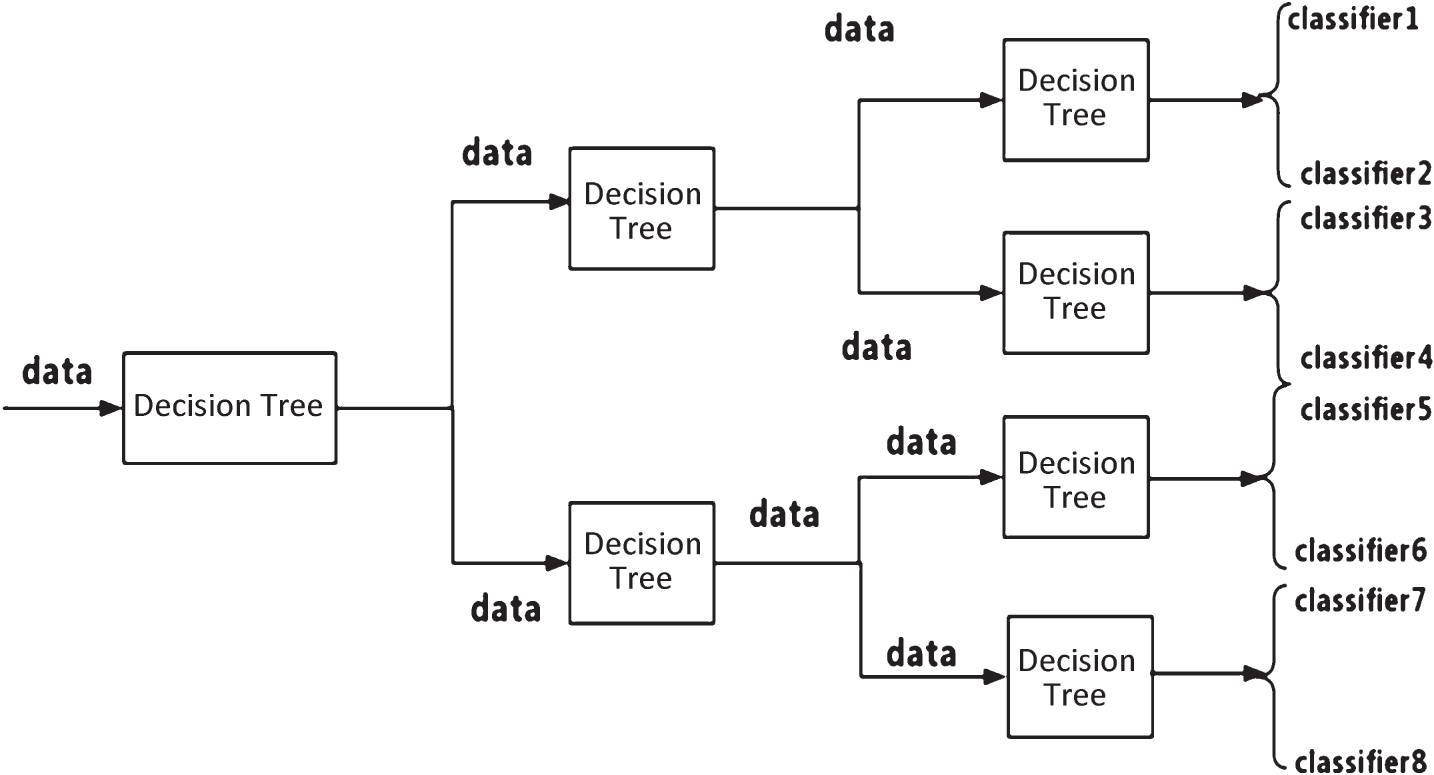
Threshold classifier.
To take an example for further explanation, we can use the quantile of every column to split the threshold. We firstly set the quantile at 0.05 and 0.95. That is to say, the instance with attributes values between 0.05 and 0.95 will be classified into a threshold space, and otherwise into another threshold space if not within the range. More division could be made in this way. The initial intention of the quantile partition is to filter the threshold range with C4.5, and inversely modify the threshold range according to the average classification accuracy of those 8 sub-classifiers.
The operation, however, hasn’t totally automatically realized. The classification accuracy of the algorithms of the sub-classifiers can be seen from Table 3. We perform them on the binary classification data set and extract from the cardiac arrhythmia data for 6 classifications, which are Sinus rhythm, Sinus tachycardia, Sinus arrhythmia, Pacing rhythm, Right and left bundle branch block, and atrial flutter, with 387 real cases of every kind. And the 6 classifications of the abnormal thresholds-based multi-classifier also improve the accuracy.
We use 6 algorithms for the 8 classifiers, and compute the average classification precision of the 8 to evaluate the entire model. For the other methods, the threshold partition for multi-classifier building proved effective for the data with many abnormal instance values as well. Data imbalance may easily cause by the threshold partition sometimes, The large imbalance didn’t happen in this data set, though.So we added experiments to possible imbalanced data. Taking UCI benchmark dataset as an example, combined with SMOTE algorithm, good results were obtained, so as to solve the possible imbalances after using this method.
Contrast of models’ accuracy
Information on data sets
The two data sets of UCI are dealt with by the SMOTE method. It operates on the balanced dataset using oversampling with different algorithms. We synthesized the SPECTF training and testing data sets for a new one. Table 4 describes the basic information of the data.
SMOTE has two methods: oversampling and undersampling. The former is to reduce a large amount of instances data, and the latter is to increase the number of instances.
Classification accuracy of different algorithms
Table 5 shows the data processed by the SMOTE method, and that can be seen improves the classification accuracy and robustness of all kinds of data. Among the models, tree-based classifier, such as C4.5, Random Forest, and XGBoost, performed the best.
We build the classification models for ECG data under the circumstances of no-data pre-processing, data pre-processing and abnormal threshold based multi-classifier, made the binary-classification to the 202594 instances from the hospital, and continued to make a six-classification for the cardiac arrhythmia data. It can be clearly seen from the experiments that the tree-based classifiers can match better with the medical data. To the imbalance situation that might appear during building the abnormal threshold based multi-classifier, we test that with the UCI data sets using SMOTE algorithm to deal with that, and get an improvement as result. We test that with the UCI data sets using SMOTE algorithm, and get an improvement as result. We choose the XGBoost as the sub-classifier, which is because it supports multi-threaded CPU, and greatly speeds up the computation. What’s more, the result of testing can be better through adjusting the parameters, and we can also avoid the overfitting problem by parameter adjusting.
From the massive cardiac arrhythmia instances and the experimental results, building a multi-classifier based on abnormal threshold is of better classification accuracy, and the good performance in heart disease classification provides the bioinformatics application with a proper solution. What the data we use in this experiment is from the real medical scenario. We build multiple classifiers based on abnormal thresholds(data quantiles) to make the binary and six classifications, and compared the classification accuracy of XGBoost, SVM, C4.5, Naive Bayes, Logistic and Random Forest. The multi-classifier proved an effective and improved classification model for noisy data. And for the probability of data imbalance this method may cause, we made a comparison with the level of imbalance using the UCI dataset, and find the highest classification accuracy the SMOTE combined with tree-based algorithm performed.
Conclusion
What the method proposed for the massive ECG data in this paper is abnormal thresholds-based multi-classifiers classification with the tree-based model–XGBoost. So when encountering the massive ECG data, we could firstly do a binary-classification to pick out the cardiac arrhythmia ones for the further classification. The method we used in the experiment is a kind of ensemble learning, and we can get a higher accuracy through building multiple classifiers on different thresholds, which could not only avoid a big waste of instances with abnormal values but also produce a classifier with a better robustness. Although xgboost is not as high as C4.5 in the classification accuracy of some sub classifiers, we choose it because of the many advantages of XGBoost.
And during the imbalance solution, what the method we use for, testing and comparing with a public data set, is also a new idea, and the best combination, SMOTE+ tree-based model, can also provide an effective way of heart disease classification for the medical fields. The whole set of thought and method can also be applied to other eras.
Footnotes
Acknowledgments
This work has been supported by the National Science Foundation of China Grant No. 61762092, “Dynamic multi-objective requirement optimization based on transfer learning”, National Science Foundation of China Grant No. 61762089, “The key research of high order tensor decomposition in distributed environment”, Open Foundation of Key Laboratory in Software Engineering of Yunnan Province under Grant NO. 2017SE204, “Research on extracting software feature models using transfer learning”.