
Abstract
Stroke is a cerebrovascular disease which is one of the significant causes of adult impairment. Research shows that retinal fundus images carry vital information for the prediction of various cardiovascular diseases like Stroke. This work investigates a multi-texture description for the computer aided diagnosis of Stroke from retinal fundus images. Texture of the retinal background is analyzed, thereby eliminating the need for segmentation. Gabor Filter (GF), Local Binary Pattern (LBP) and Histogram of Oriented gradients (HOG) are the texture descriptors implemented in this work. The texture descriptors are applied to the second Eigen channel obtained by Principal Component Analysis (PCA). Extracted features are concatenated to form a multi-texture representation and dimensionality reduction is done by ReliefF feature selection method. The compact feature vector is given to Naïve Bayes classifier and performance metrics are evaluated. We have evaluated the performance of individual feature descriptors and multiple feature descriptors in retinal fundus images for stroke diagnosis. Multi-texture description outperforms individual texture descriptors by an accuracy of 95.1 %.
Keywords
Introduction
Stroke is the fourth significant cause for mortality in India. It is one of the major causes of death, next to ischemic heart disease. In Trivandrum, the capital of the Indian state of Kerala, the incidence rate of stroke per year is 135.0 and 138.0 (per 1, 00,000 inhabitants) in urban and rural community respectively [1]. Stroke [2] is a cerebro-vascular condition that occurs because of lack of blood flow to cerebrum. This damages the brain cells eventually leading to their death. Blood supply to cerebral nervous system can be disturbed either by a deposition in the blood vessel or by its rupture. A clot in the blood vessel causes Ischemic stroke and a rupture of blood vessel causes Hemorrhagic stroke. Unhealthy lifestyles play a crucial role in the occurrence of Stroke [3]. Early identification of stroke still remains as a challenge in bio-medical field.
Research show that microvasculature of retina and brain are closely related in terms of structure and function [4]. Any change in the cerebral blood vessel will be reflected in the retinal blood vessel [12–42]. The retina can be considered as a window to central nervous system. Contraction of arteries and expansion of veins enhances the risk of stroke. Research show that changes such as micro aneurysms or arteriolar narrowing seen in the retina may present hazard factors for cerebrovascular disease such as stroke [50]. Hypertension, a major risk factor of stroke is evident as cotton wool spots and deep retinal white spots [43–47]. Morphological changes in blood vessel like branching pattern, width, appearance of lesions, branching angle and coefficient are some of the abnormalities in retinal vasculature associated with cardiovascular diseases like stroke [44–46]. This work is an extension of author’s earlier works for stroke prediction [5].
In this proposed work, we address computer aided stroke diagnosis based on texture variations using multiple texture features. This method provides robustness in each processing phase. A computer aided diagnostic system mainly consists of four phases: preprocessing, feature extraction, feature selection and classification. Principal Component Analysis is applied in preprocessing phase to provide the best suited Eigen channel for capturing the texture variations. Region of Interest which provides the variations in retinal vasculature is selected for the extraction of features. A combination of three texture descriptors is used in feature extraction phase. Accuracy can be improved by combining the texture descriptors. Literature survey shows that various authors have employed the texture descriptors separately [6, 7]. Combination of two texture descriptors were also implemented [8]. In our work, multiple texture descriptors like Local binary pattern, Gabor pattern and Histogram of oriented gradients are joined together to form a high dimensional feature vector. A variant of Relief feature selection method known as ReliefF [9] is enforced for dimensionality reduction of the feature vector. After feature selection, feature vector is given to a Naïve bayes classifier. Experimental results proved that feature selection can enhance detection accuracy. Performance on combining various combinations of texture descriptors had been analyzed in this work.
The rest of the paper is organized as follows. We highlight the related work considering variations in retinal vasculature for Stroke in Section 2. Section 3 discusses the proposed method of stroke diagnosis using multi texture representation. Section 4 explains the experimental setup and Section 5 gives the results. Finally, in Section 6, we draw some conclusions to provide suggestions in improving accuracy.
Literature review
Considerable amount of study has been done on the field of retinal image analysis. Investigations show that signs of stroke are revealed in retina as soft and hard exudates, artery or vein occlusion and alterations in retinal vasculature. De Silva et al. [11] proved that patients with rigorous arterio venous nicking (AVN) and focal arteriolar narrowing (FAN) were more prone to stroke compared with those without AVN and FAN. Thus, retinal imaging seems to have a major role in Stroke prediction.
McGeechan et al. [12] showed that width of venules in retina plays a major role in stroke prediction, but the width of arterioles in retina was not associated with stroke. Addition of retinal venular caliber to conventional stroke risk factors reassigned ten percent of people at medium risk to lower risk. Research shows that ischemic stroke victims have sparser micro vascular retinal vasculature [13]. Work by Ong et al. showed that reduction in the fractal dimension of arteries and veins, increase in the tortuosity, narrower arteriolar caliber and broader venular caliber were related with stroke. Cheung et al. [14] demonstrated that increase in the intricacy of retinal microvasculature was associated with Stroke. Retinal features used in [14] were hemorrhage, micro aneurysm, vessel caliber, arterio-venous nicking, and fractal dimension. This work proved that variations in retinal vasculature were strongly related to stroke, which gives a promising evidence for stroke prediction using retinal image analysis. Patton et al. [15] describes the anatomical and physiological relation between retina and brain. Various retinal image analysis tools for the study of retinal microvasculature as potential markers for stroke are included in this work. A classification using Artificial Neural Network (ANN) for normal and abnormal (Stroke) images have been implemented by the same authors after extracting features from retinal fundus images [5]. Various features like branching points, end points, mean diameter of the blood vessels, fractal dimension and temporal arcade angle were computed for the fundus images of healthy and stroke affected patients. Computed features were successfully trained and tested using an Artificial Neural Network, which gave an accuracy of 98 %.
Imaging of the eye has evolved from ophthalmoscope [48], fundus fluorescein angiography [49], fundus photography [51], confocal scanning laser ophthalmoscope, optical coherent tomography [52], Oct angiography to new portable instruments capable of multimodal imaging. Fundus photography still remains an important imaging tool as it allows non invasive monitoring of disease [54] progression over time and is quick and simple which requires no dilation.
Stroke diagnosis based on multi texture representation
Image acquisition is done by a Zeiss fundus camera which is having a Field-Of-View (FOV) of 30-degrees and input images are of dimensions 2336×3504 pixels. The basic block diagram of the proposed method is given in Fig. 1.
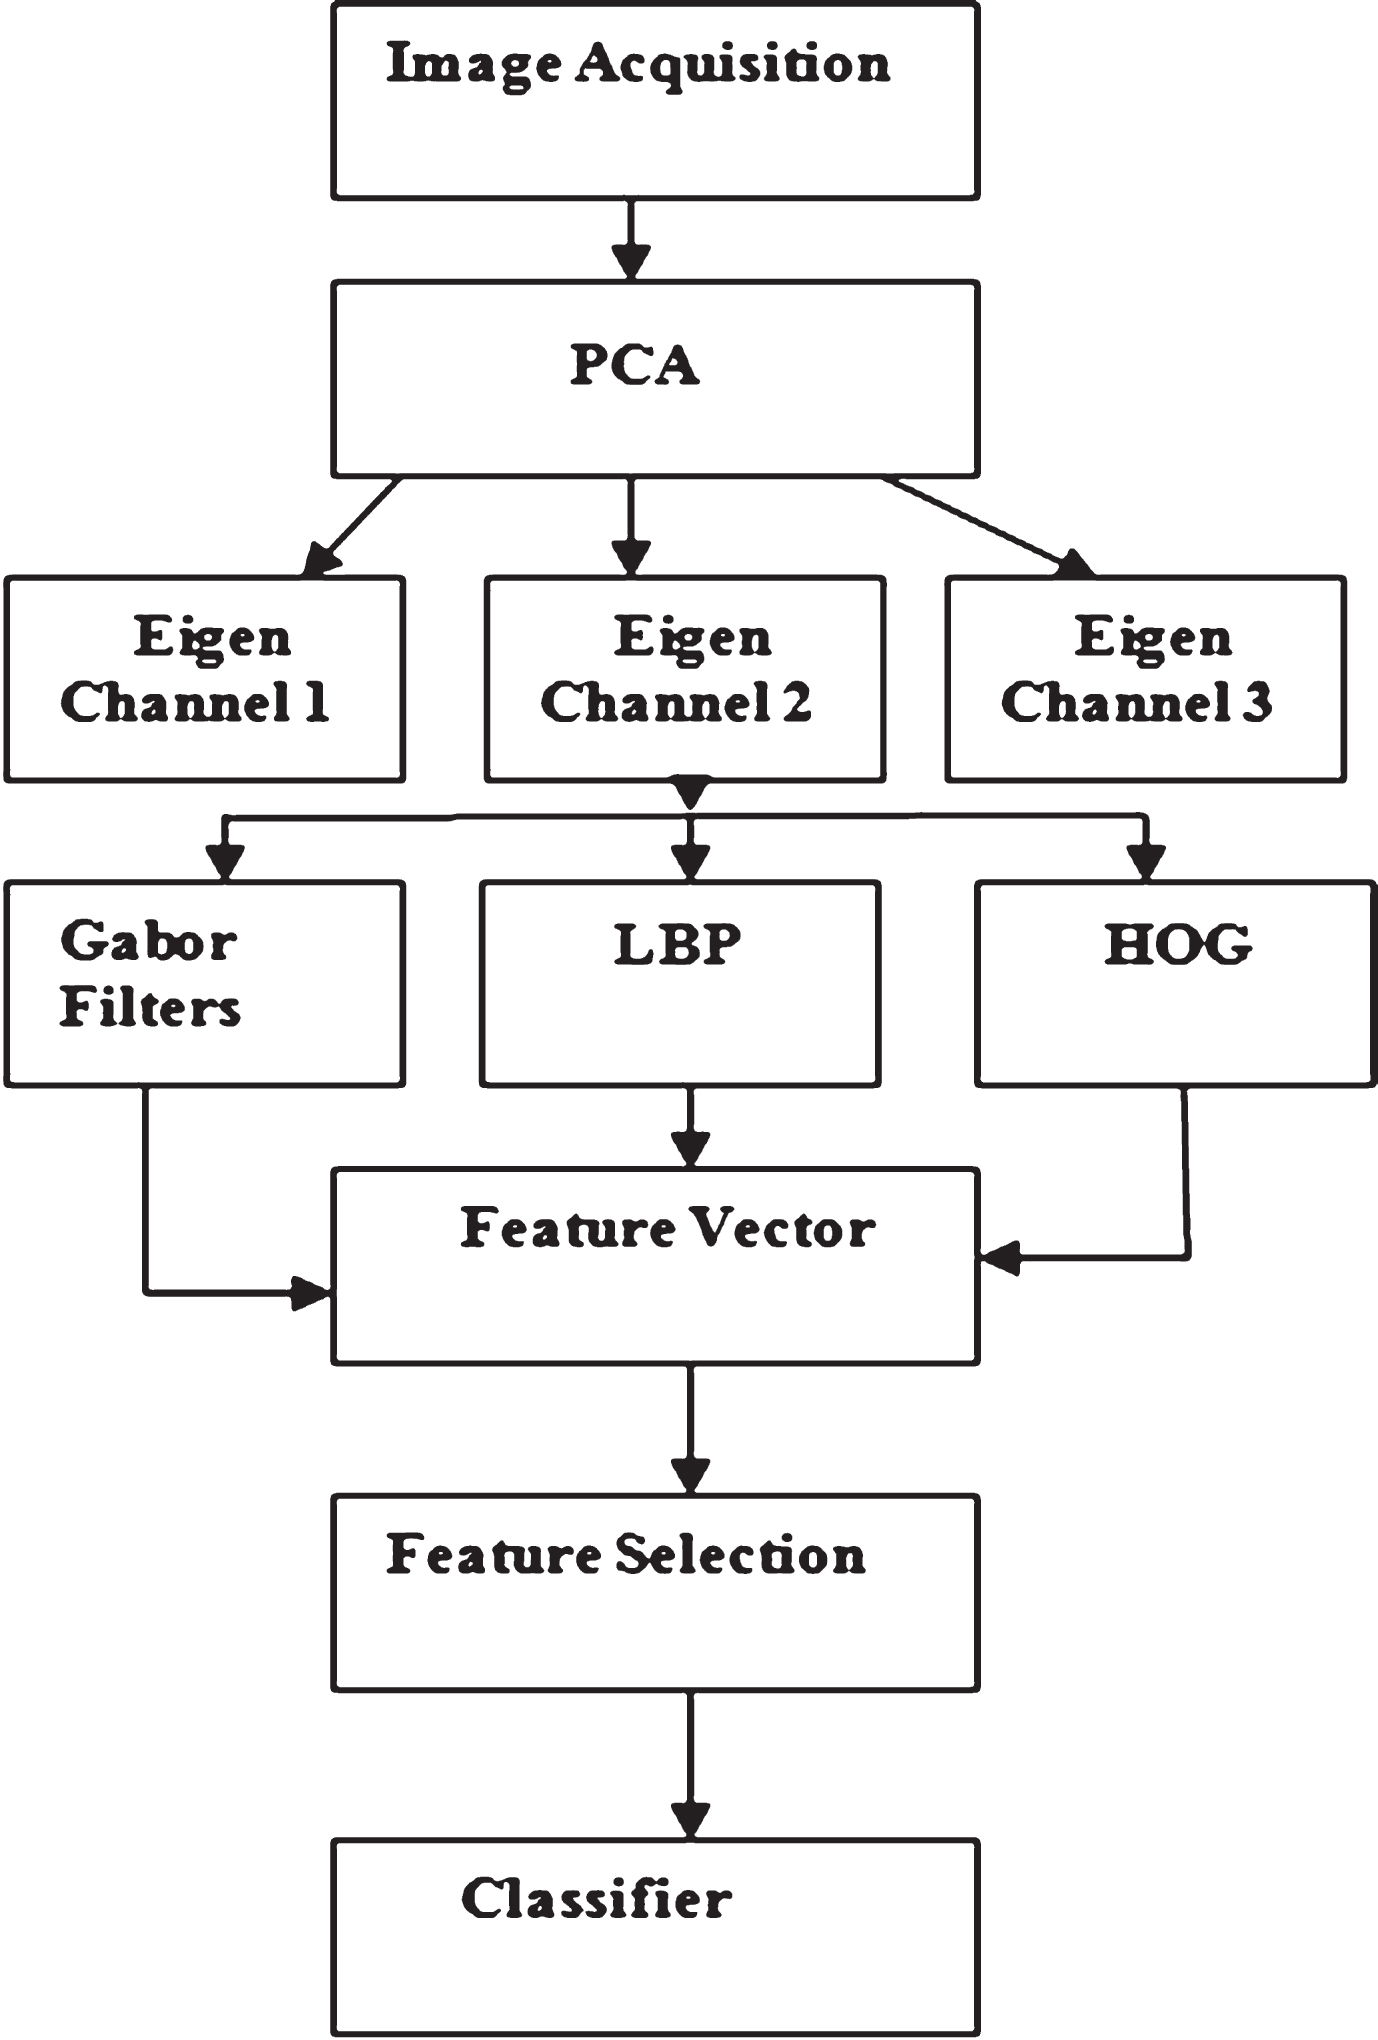
Block diagram of Proposed Method.
The real world data tend to be inconsistent, incomplete and noisy by nature. Poor quality data can lead to inaccurate results in data mining or machine learning process. Therefore, the data acquired from the real-world must be preprocessed before given to the data mining process in order to extract the required features for further analysis.
To get a better representation of the original RGB image, preprocessing is implemented by Principal Component Analysis. PCA can provide the best Eigen channel with suitable features for texture analysis. Green channel representations are normally used in retinal image analysis [16, 17]. But usage of a single channel is not always appropriate for feature extraction [18]. Marrugo et al. [19] implemented principal component analysis to segment optic disc in retinal images. Sinthanayothin et al. [20] developed an adaptive color channel for the analysis of retinal images. Premit et al. implemented adaptive color transformation on retinal fundus images from Blue Mountain Eye Study database for stroke prediction [21].
PCA transforms the RGB axes into three new orthogonal principal axes. For a RGB image a x b x p, where a x b represents the size of the image and p = 3 (RGB channels).The image matrix was transformed to m x q (m = a×b) and then mapped to PCA space. Eigen channels obtained after this transformation were then transformed back to the size of original image. Since second Eigen channel had a bimodal histogram, it was suitable for further feature extraction and was selected for further analysis.
The selection of the region of interest for feature extraction is an important phase in retinal image analysis. In zonal representation [28] of fundus image, Zone A corresponds to the region between optic disc margin to 0.5 optic disc diameters (ODD), Zone B corresponds to 0.5 to 1.0 ODD and Zone C corresponds to 0.5 to 2.0 ODD away from the optic disc boundary. Zonal representation of the retinal image is given in Fig. 2. The region of interest selected in our study is from optic disc margin to outermost circle which is marked in the Fig. 2.

Zonal representation.
To cover the region of interest, optic disc is located by circular Hough transform and a region of size 1536×1536 pixels corresponding to a circle of 4 OD diameter centered at OD center has been cropped from the original image. To reduce the computational complexity, the cropped image was then down sampled to 256×256 pixels.
After preprocessing and ROI selection, the image is subjected to feature extraction. Considerable amount of work has been done on the area of feature extraction which includes textural features [23–26] and a concatenation of textural and structural features [27]. A multi-texture representation is extracted from three different texture descriptors discussed here. Multiple texture features have been attempted in various applications such as texture extraction and classification, but none of the previous work attempted combining multiple texture descriptors for Stroke diagnosis from retinal fundus images.
Gabor filter
Multiresolution representation of image texture analysis is made possible using Gabor filters. Literature survey outlines the scenario of Gabor filters for feature extraction in the past few years [29, 30]. Khan et al. implemented a combined approach using color and texture features [31] by applying color space and Gabor filters. Research work by Ma Li et al. [32] focused on the texture feature vector with a color space grayscale. Frequency and orientation of Gabor filters [33] resemble our visual system. So they were found to be adequate for texture representation. Two-dimensional Gabor filter decomposes an image into components related to various scales and orientations, thus capturing spatial localization, orientation selectivity, and spatial frequency. A two dimensional Gabor filter consists of a complex exponential centered at a particular frequency and modulated by a Gaussian envelope given by Equation (1).
A configuration of 8 orientations and 5 scales gives a total of 40 complex Gabor filters where each wavelet has a real and imaginary component. The texture measure coefficients are computed by convolving a patch in the image with all the 40 Gabor filters.
Local Binary Pattern is used for describing a local spatial structure of an image which was introduced by Timo Ojala [35].Sandra Morales et al. [34] investigated various features in the texture of fundus images to discriminate between pathological and healthy images. In their work, the performance of Local Binary Patterns has been compared with other descriptors. Garnier et al. focuses [36] on AMD detection using LBP by analyzing the image on different scales using wavelets. In the original LBP, the labels for the image pixels are obtained by thresholding 3×3 neighborhood of each pixel. Each bit is made zero or one based on the difference in intensities between the corresponding pixel and the middle pixel. The string of bits obtained is followed in clockwise or counterclockwise direction to get an 8 digit binary value. The binary number is converted into its decimal form to obtain LBP label for the middle pixel. A 3×3 neighborhood consists of 8 pixels and a total of 28 = 256 different labels are possible. The histogram of all the labels was used as texture descriptor. LBP is defined by Equation (2) which is given below.
HOG descriptor [38] is capable of capturing fine details present in images. The HOG presented by Felzenszwalb et al. [39] calculates directed, undirected angles and a four dimensional texture energy feature. HOG-based eye detectors were combined with circular Hough transform [40] and used with adaboost classifiers for better performance [22]. Andreas et al. implemented a work on efficient feature for eye detection by extracting HOG vectors from image patches [41].
The major steps in HOG are given below: Gradient Calculation Computation of HoG Gradients in 8×8 cells Block Normalization HOG feature vector computation
The final HOG feature vector will be the concatenation of all the 36×1 vectors [54]. The feature vectors obtained by applying the above three texture descriptors are concatenated to form the multi-texture representation.
Feature selection
The multi-texture description results in a total of 10916 features. As the dataset becomes larger, memory requirements will be high. Therefore, the most distinguishing features are selected using the feature selection algorithm ReliefF [14]. ReliefF is capable of handling missing data as well as noisy data. ReliefF resulted in a compact representation that gave better performance when compared with various feature selection reduction.
Experimental setup
Dataset
Retinal fundus images had been collected from Sree Gokulam Medical College and Research Foundation, Trivandrum. (Ethical Committee Approval: SGMC-IEC No.25/293/01/2017) Database contains 130 images of which 80 are normal and 50 are those of stroke patients. Images are having a Field-Of-View (FOV) of 30-degrees and of dimensions 2336×3504 pixels.
Performance metrics
We conducted 10-fold cross validation using Naïve Bayes Classifier available in the open source data mining package WEKA [10]. WEKA is developed by University of Waikato, New Zealand. Performance of the classifier is evaluated mainly by Accuracy, Precision and True Positive Rate (Sensitivity) which are given in Equations (3– 5) respectively.
Input RGB image is preprocessed by Principal Component Analysis to extract the Eigen channels. Since second Eigen channel gives fine texture features, it is selected for further analysis. The centre of the optic disc is located by circular Hough transform and ROI is selected from the retinal image by cropping a sub image of size 256×256 with the midpoint of optic disc as centre.
The original image and the three preprocessed images are given in Fig. 3(a-d) respectively.

(a) Original Image (b) Eigen channel 1 (c) Eigen channel 2 (d) Eigen channel 3.
The first Eigen channel gave the highest association of data containing major structural features. Second Eigen channel had the texture features while third Eigen channel included uncorrelated noise. Second Eigen channel was selected for extracting the texture features. Texture descriptors like Gabor filters (GF), Local Binary Pattern (LBP) and Histogram of Oriented Gradients (HOG) were applied and the individual effects of descriptors were analyzed.
The HOG Features were extracted from the ROI with 16×16 cell sizes (2×2 cells per block), unsigned gradients and 9 orientation histogram bins. There are 16 horizontal and 16 vertical positions giving a total of 15×15 = 225 positions. Concatenation of all these into one single vector gives a size of 36×225 = 8100.Therefore, each image yields a feature vector of size 1×8100.
In this work, Gabor features are computed at 5 scales and 8 orientations. A total of 8 orientations and 5 scales generate 40 different Gabor filters, which is shown in Fig. 4.

Gabor Filter masks.
We convolved each filters with the input image to obtain 40 (8×5 = 40) different representation of same image where each image gives a feature vector. Each feature vector generated is of length 64 and therefore a total of 64×40 = 2560 features are generated.
In the extraction of Local Binary pattern, for each pixel, neighborhood of the pixel is considered and the middle pixel value is subtracted from the neighborhood pixels. If the subtracted value is negative, then it is represented as a zero. If the subtracted value is positive, then it is represented as a one. Finally, all the bits are concatenated to form a numeric value. The distribution of all these numeric values throughout the image is represented as a 256 bin-histogram representing the texture of the image.
The texture descriptive feature vector is fed to various classifiers like Support Vector Machine (SVM), Multilayer Perceptron (MLP), Random forest and Naïve Bayes (NB) for analyzing the predictive accuracy. Classifiers trained by different algorithms will perform in different ways. The comparative analysis of the predictive accuracy of classifiers (%) is given in Table 1.
Comparative Analysis of Classifiers
Table 1 illustrates that for individual texture descriptors and for multitexture descriptors, Naïve bayes classifier gave promising results. Hence, Naïve Bayes is considered in this research work. Experiments were performed to evaluate the performance of Naïve Bayes classifier for various combinations of texture descriptors. This is followed by the analysis of the effect of feature selection. Table 2 shows the performance metrics for various combinations of texture descriptors for a Naïve Bayes Classifier. Experimental results clearly demonstrate that combining multi-texture descriptors significantly improves the performance compared to the individual texture descriptors.
Effect of Combinations of Feature descriptors
The effect of multi-texture representation is analyzed by evaluating the Accuracy, Precision and True Positive rate (TPR) using possible combinations of GF, LBP and HOG. Table 2 shows that multi-texture representation improved the accuracy, precision and TPR over individual texture descriptors. But, multi texture representation results in high dimensional feature vector. To reduce the memory requirements, a feature selection method that selects the most required subset of features should be employed. In our work, we used ReliefF feature selection technique to obtain a compact multi-texture representation. Table 3 shows how feature selection affects the performance of multi-texture representation. Using the feature selection method, the number of features is reduced from 10916 to 2943.
Effect of compact representation
By reducing the number of features, memory requirements are reduced and also, detection accuracy is improved. Improvement in accuracy is clearly depicted in Table 3. All the experimental results were validated with the help of a neurologist.
To the best of our knowledge, none of the previous works have used the same dataset. All the reported works in literature have used their own private dataset collected from reputed medical institutes, which are not publicly available. Hence, we could not compare our novel approach with existing state of art methods.
In this research work, we proposed a compact multi texture representation for Stroke diagnosis from retinal fundus images. Experimental results showed that the multi texture representation outperforms individual texture descriptors. The texture features obtained from Gabor filters, Local Binary Pattern and Histogram of Oriented gradients were concatenated together to form the feature vector. The high dimensionality of multi-texture representation is reduced by ReliefF feature selection method and the selected features are given to a Naïve Bayes classifier for Stroke diagnosis. Accuracy of the method can be enhanced by incorporating more texture descriptors. The proposed framework can help physicians to make smart medical decisions more accurately that were not possible with conventional assessment systems which will aid in Stroke diagnosis.