
Abstract
Elliott Wave Theory has the advantages of universality and accuracy. It accurately depicts the way the stock market works and has become an important tool in securities market modeling. Elliott Wave Theory includes five rising waves and three descending waves, which have important quantitative features related to the Fibonacci series and the golden ratio. At the same time, China’s Shanghai Composite Index reflects the systemic risk of the stock market to a certain extent. If China’s Shanghai Composite Index could be accurately predicted, we could take the necessary precautions to prevent risk in the system. Therefore, this paper uses gray model features, which are highly adaptable and can handle parameter changes. The cross-sectional data of the inflection points of the Elliott wave line are selected as the original data to fit the small sample number required for gray modeling. According to the special mapping relationship between Elliott Wave Theory and the Fibonacci sequence, by combining the important properties of the Fibonacci sequence and the golden ratio, the background value of the gray GM (1, 1) model is optimized, the new models F1 - GM and F2 - GM are presented, and the important properties of the new models are studied. Finally, the Elliott wave line is drawn using the Chinese Shanghai Composite Index, and the inflection point data for the whole wave, rising waves and falling waves of the wave line are used as empirical data. The results show that the new model can choose an optimal model according to the data characteristics and is more effective. The new model can also provide new information for the forecasting of stock price indexes and provide help and reference for stock price index forecasts.
Introduction
Elliott Wave Theory originated in the United States in the 1930s; it is an accurate way to describe the stock market, and it is the strongest of all the stock market technology analysis methods. Elliott Wave Theory has now become an important technology method in the securities market after years of testing. Wave theory has the advantages of universality and accuracy, and its price and index trend prediction is strikingly accurate. Therefore, wave theory is applied to explain the stock market and forecast future trends of the market, and we can provide new ideas about predicting the stock price index and provide help and reference for investors about the stock price index forecast.
Elliott Wave Theory [1] was proposed by R.E. Elliott based on a large number of historical discoveries. It absorbs the basic aspects of Dow’s theory and notes that the stock market has a certain basic rhythm and form, specifically, five rising waves and three descending waves that constitute a complete cycle of eight waves, with the three downward waves serving as an adjustment of the first five rising waves. Figure 1 shows the five driving waves that represent the rising direction and the three adjustment waves. The Fibonacci series and the golden ratio are important quantitative features of the Elliott Wave Theory of five rising waves and three descending waves. The Fibonacci sequence is a classical combination of numbers [2], the limit of any two is the golden ratio, such that
China’s stock market has been studied by domestic and foreign scholars since the official opening of the Shanghai Stock Exchange on December 19, 1990, and the Shenzhen Stock Exchange on July 3, 1991. China’s Shanghai Composite Index reflects all the stocks on the Shanghai Stock Exchange but also reflects the state of China’s economy. However, stock prices are prone to random fluctuations and are often subject to statistical checks and other evaluations of their impact, such as the rational assumptions of investors, so the information is not complete. It has been shown that the stock price movement in the Chinese stock market does not show characteristic random fluctuations but can be characterized by Elliott Wave Theory. According to the needs of the forecast and the characteristics of Elliott Wave Theory, we can derive a weekly chart, monthly chart and annual chart according to the antenna map of the Shanghai index. As shown in Fig. 2, there is a weekly chart of the eight wave trend of China’s Shanghai Composite Index since December 3, 2012, to January 25, 2016. Therefore, according to the nature and characteristics of Elliott Wave Theory, it is possible to find a predictive model with a higher prediction accuracy so that the investors can have a valuable reference for the forecasting of the stock index and make an accurate forecast of the Shanghai Composite Index. We can take the necessary precautions for the system risk.

Elliptic wavy line.
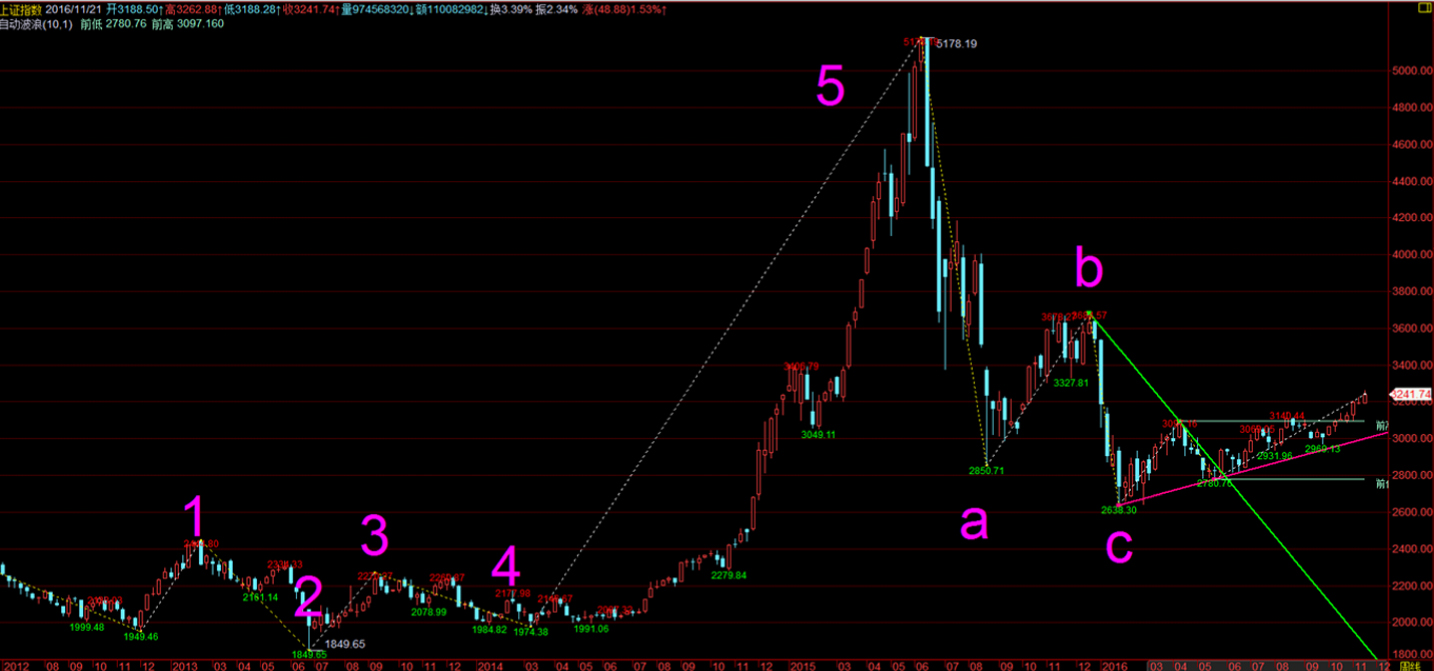
Elliptic wavy line of the weekly chart of China’s Shanghai Composite Index.
The application of Elliott Wave Theory in the securities market is mainly used to predict the later trends of the stock market according to the wave pattern. F.L. Zhu [8] selected the top two cyclical waves of China’s Shanghai Composite Index as a key analysis points; putting forward some important points in the running time allows for a certain testability. L.J. Wang [9] noted that wave theory can be effectively applied in China’s securities market. L.X. Wan [10] used the Fibonacci sequence to discuss the effectiveness of Elliott Wave Theory in Chinese markets. G. Atsalakis et al. [11] used wave theory and neuro fuzzy-based techniques to predict stock prices. S. George et al. [12] applied fuzzy neural theory and Elliott Wave Theory to the stock market.
To accurately predict the price of Chinese stocks, many scholars have performed extensive research; X.J. Wen et al. [13] applied the threshold quantile autoregressive model to study the stock return autocorrelations and its ability to predict in the Chinese stock market from 2005 to 2014. Fuzzy set theory is still widely used for a broad range of applications [14–17]. Cheng et al. [18] integrated a fuzzy time series model with a trend-weighting mechanism to predict the actual trading data of the stock prices and its connection to university enrollment. Granular computing (GRC) techniques apply concepts including value discretization, group aggregation, classification and universal clustering to solve a range of problems [19–30]. Granular computing (GRC) techniques are mainly based on single-point predictions to forecast the index for the next week. Mu-Yen Chen et al. [31] proposed a new model based on the granular computing approach with binning-based partitions and entropy-based discretization methods. Stock forecasting problems often use traditional time series methods with a few examples of forecasting results [15, 32–34]. The time series methods include the autoregressive and moving average model (ARMA) [35], the autoregressive conditional hetero scedasticity model (ARCH) [36], and the generalized ARCH model (GARCH) [37]. At the same time, Oliveria Nuno et al. [34] used both methods and mathematical signal processing techniques to predict stock prices, but these methods require large amounts of historical data and assumptions, such as normative assumptions [38].
The gray model is simple and adaptable, can better handle mutation parameter changes, and does not require many data points for predictive updates. Therefore, many scholars see the stock price system as a gray system, and forecast it with high prediction accuracy. For example, Kayacan et al. [39] adopted the Fourier series improved GM (1,1) and Verhulst models, which are mainly used to study short-term forecasts for the stock market, foreign exchange rates and customer demand. Since 1982, gray system theory [40] has been widely used in areas such as transportation, economy, management and other fields [41–44]. Gray models are one of the core components of gray system theory, and are simpler than and preferable to traditional forecasting methods. However, the gray prediction algorithm has many defects. To improve the predictive performance of a gray prediction model, the researchers conducted many systematic tests on the depth, from the initial value, the background value of the angle, modeling mechanism, model attributes, model combination, etc., to promote and gray prediction model [45–50] the improvement of the theoretical system. The background value of the traditional model is obtained by using the trapezoidal method in the numerical integration, but the error is large. To improve the background value, considering the defects of the traditional trapezoidal formula construction method, the trapezoidal formula is optimized by using the equidistant node orthogonal method in the numerical analysis without considering the meaning of the sequence.
To sum up, Elliott Wave Theory has become an important means of securities market, China’s Shanghai index to a certain extent, reflects the operation of China’s economy. A better forecasting model for China’s Shanghai Composite Index will allow investors to make valuable reference and make necessary precautions for system risk. At the same time, the gray model is simple, adaptable, and always shows the characteristics of lower prediction error in all-time series. Therefore, this paper uses the Elliott wave data that have the important quantitative characteristics of the Fibonacci sequence and the golden ratio and uses the important properties of the Fibonacci sequence and the golden ratio to optimize the background value of the GM (1, 1) model, yielding two new models F1 - GM and F2 - GM, studying the important property of the model. Finally, using the China Shanghai Composite Index from June 24, 2016, to July 26, 2016, the cross-sectional data of the Elliott wave inflection point was taken as the raw data according to the ups and downs of the index, to accommodate the small sample characteristics of gray model. The data on the wave line are divided into rising waves, falling waves and the overall wave line for empirical analysis of the data; the results of the analysis are that the two new models, F1 - GM and F2 - GM, have a good effect, and the most efficient model can be selected and simulated according to the characteristics of the data.
The remainder of this paper is organized as follows. Section 2 provides the properties of the traditional GM (1, 1) model. In addition, Section 3 introduces the properties of the Fibonacci sequence and optimizes the background value to propose a new model. In Section 4, we use the F i - GM (i = 1, 2) model to simulate and to forecast China’s Shanghai Composite Index. Section 5 concludes the paper.
The Gray GM (1, 1) model is one of the core components of gray system theory. It is characterized by its simple calculation, which is superior to traditional prediction methods. The applicational value of the GM (1,1) model has been embodied in various fields. In recent years, the improvement and optimization of the model has been paid more and more attention by researchers. Research shows that the pattern of the original data, its smoothness and the background value are the main factors that affect gray model accuracy. Therefore, a corresponding method is also used to ensure model accuracy. This section introduces the relevant information about the GM (1, 1) model.
The whitennization equation
The Fibonacci sequence is a classical combination of sequences, with a variety of combinations of explanations. Specifically, it is written as 1, 1, 2, 3, 5, 8, 13, 21, 34, 55, 89, 144, 233.... The introduction of the Fibonacci sequence has led to a constant interest, and it has been continuously researched. This research is mainly based on the study of the original properties of the Fibonacci sequence and the optimization theory of the Fibonacci sequence, which is currently applied in various fields. The limit of any two of the ratios is called the golden ratio; the golden ratio and the classical definition of grace are closely related; thus, the relevant optimization theory is widely used. A gray GM (1, 1) model is simple and adaptable. The background value parameter is one of the important factors that affects the accuracy and adaptability of a GM (1, 1) model. Since the original sequence has a mapping relationship with the Fibonacci sequence, after each accumulation, there is also a mapping relationship with the Fibonacci sequence. In this section, we use the properties of the Fibonacci sequence to optimize the background values, obtaining a new Fibonacci sequence-gray model, and we study its notable properties.
Knowledge about Fibonacci sequence
The general formula was obtained by using the recursion sequence method as:
The limit of ratio of any two terms in general sequence was defined as Golden Ratio, the following lemma was obtained according to general formula.
Fibonacci sequence-gray model
According to the basic theory of a GM (1, 1) model, the development coefficient a and gray action coefficient b are the key factors that affect the precision of a GM (1, 1) model. It was clearly shown in Equation (2.2) that the values of a and b depend on the method of construction of the original data sequence X(0) and the background value Z(1) (k). Hence, the construction of the background value Z(1) (k) was one of the key factors in the simulation errors and adaptability of the GM (1, 1) model. The error in the GM (1, 1) model was derived from (2.2). When the area S a of the trapezoid with a curved side was replaced by the area S ABCD of a trapezoid, this generated errors, and the schematic diagram of the error source is shown in Fig. 3.

Schematic diagram of background value error.
The golden ratio is the limit of the ratio of any two terms in the Fibonacci sequence and is closely related to both traditional efficiency and beauty. Many optimization search problems are related to the Fibonacci sequence and golden ratio. Hence, it was feasible for the golden ratio to be used to optimize the background value Z(1) (k) of the GM (1, 1) model to improve the model precision. To optimize the background value, the mapping relationship between the Fibonacci sequence and original data was defined.
Lemma 3.2 was obtained by the above definition.
Thus, Lemma 3.2 is true. Namely, if there exists a corresponding relationship between the original sequence and the Fibonacci sequence, the corresponding relationship also exists between x(1) (k) , x(1) (k + 1) and the Fibonacci sequence after one accumulation. Moreover, x(1) (k) , x(1) (k + 1) are the two end point values of the background value curve Z(1) (k); hence, Z(1) (k) correspondingly relates to the Fibonacci sequence and is closely related to the ratios of the waves of the Elliott wave line. Thus, the relationship between the Fibonacci sequence and the golden ratio was used to optimize the background value of Z(1) (k).
The construction of the background value Z(1) (k) of the GM (1, 1) model was analyzed as follows. It was shown that the reason for the error was the differing area S
ABCD
of the trapezoid replacing the area S
a
of the trapezoid with a curved side. From Lemma 3.2, x(1) (k) and x(1) (k + 1) of the first accumulation related to Fk+1 of the Fibonacci sequence, and the relationships between the Fibonacci sequence and golden ratio were
When the Z(1) (k) function was upwards convex, the value of the point
In Fig. 4(a) and (b), it is shown that
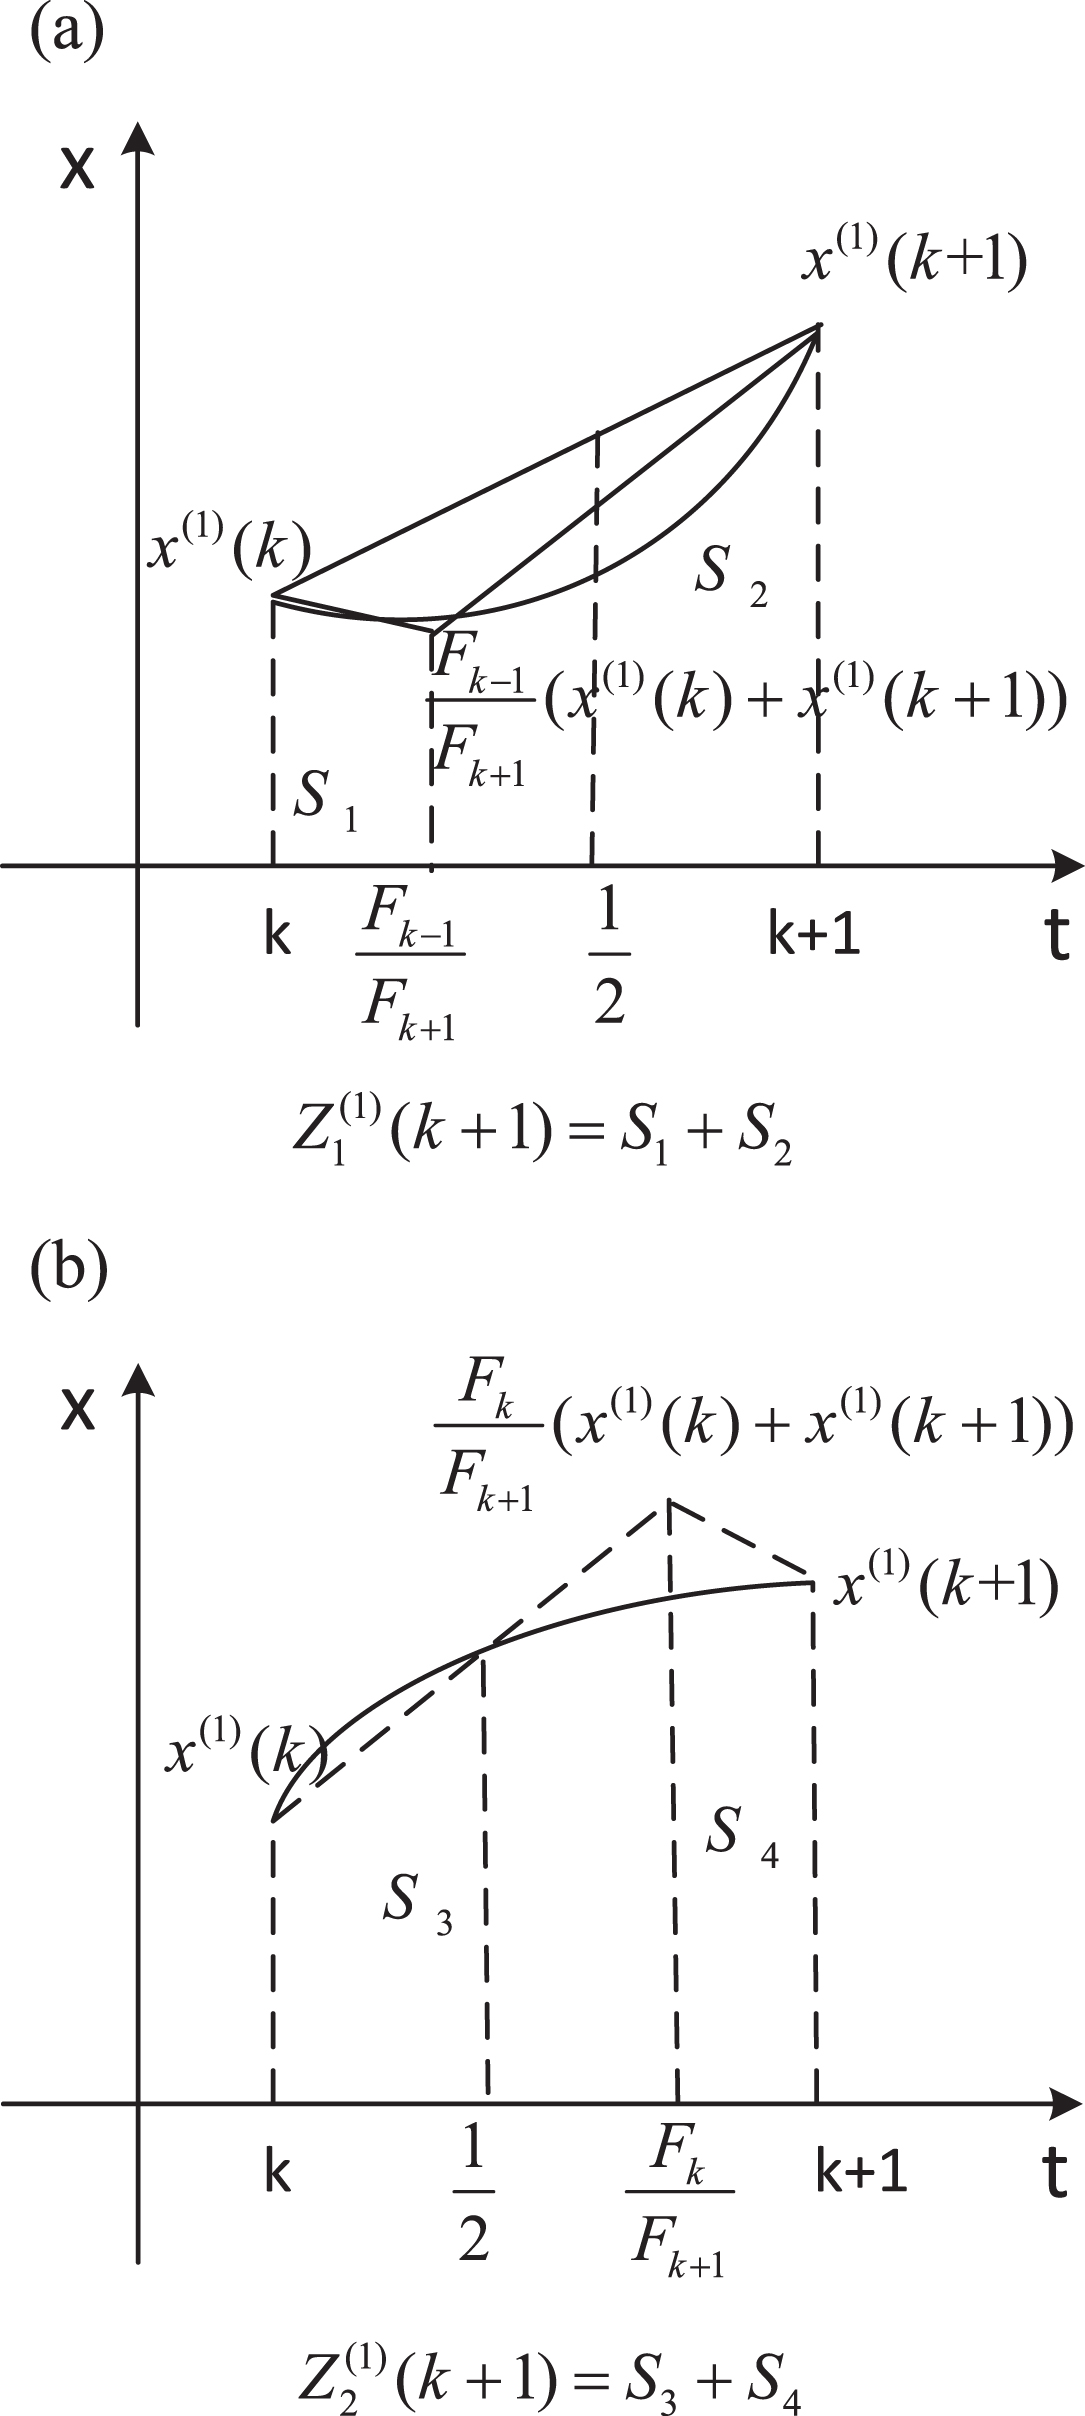
(a) Schematic diagram of the background value. (b) Schematic diagram of the background value.
The background value curve Z(1) (k) was discussed according to either an upwards concave or upwards convex configuration. However, the concavity or convexity of the curve Z(1) (k) was uncertain; therefore, the background value with the higher precision should be selected according to the above two different situations. Then, the model was obtained as follows.
The ordinary least square method is used to estimate the parameters
The time response sequence of grey differential equation
The equation can be formulated as
According to modeling mechanism of the proposed F i - GM (i = 1, 2) model, the flowchart of the new model is summarized in Fig. 5.

The flowchart of the F i - GM (i = 1, 2) model.
China’s stock market plays an increasingly important role in the national economy. The Shanghai Composite Index reflects the state of all of the shares of the Shanghai Stock Exchange and, to a certain extent, reflects the state of the Chinese economy. The trend of the Shanghai Composite Index trend is difficult to determine, as is its short-term direction of change; therefore, the majority of investors are at a loss. It is a very important to research a method of short-term forecasting of stock changes. Although various stock price theories that have been formed to explain some phenomena in the stock market, the descriptions and analyses of stock prices are incomplete and inaccurate. This section first introduces the current state of China’s stock market, as well as the role of Elliott Wave Theory in the Chinese stock market, using wave theory to analyze China’s Shanghai index. Taking the cross-sectional data of the inflection points of the wave theory as the original data, the simulation results of the F i - GM (i = 1, 2) model are empirically analyzed.
Present situation in the Chinese stock market
Since its reform and opening 30 years ago, the Chinese economy has rapidly developed, and the material wealth of the people of China has increased considerably. After more than 30 years of development, the Chinese stock market has grown out of nothing, the size of the market has expanded dozens of times, and it has become one of the most important capital markets around the world. In addition, given the rapid development of the Chinese economy and the continuous increase of the national income level, the population has been looking for all kinds of investment channels to increase their capital incomes. Moreover, companies also need to make full use of any extra funds to expand their businesses and to obtain maximum profits. The formation and development of the Chinese stock market meets both needs. On the one hand, the Chinese stock market started relatively late and had a shorter time for investors in the stock market, and the investors have not had a mature investment experience. On the other hand, the education required for Chinese stock investments is less than those required elsewhere. Therefore, improving the investment levels of Chinese stock investors, especially those of the shareholders, is a problem to be solved both in theory and in practice.
Ordinary retail investors made an enormous contribution to the development of the Chinese stock market, but they also paid a huge price in the immature Chinese stock market. This was caused by many factors, but the important and key reason was the lack of stock investment theories and the related knowledge. Then, theoretical knowledge was needed as a support. As one of three main backbone theories, wave theory attracted investors around the world with its unique characteristics, and it became increasingly important in the Chinese stock market.
Elliott Wave Theory of the Chinese stock market
The Chinese stock market has characteristics of Elliott Wave Theory, and Elliott Wave Theory largely describes the “form patterns” of market price movements. In Elliott Wave Theory, it is proposed that the wave movement is a complete cycle of eight waves, composed of five rising waves and three falling waves. In the main direction, the impulse waves, composed of five waves, spread with price movements, followed by the three adjustment waves; the corrective waves travelled in secondary directions, opposite the main direction. The golden ratio relationship existed among most wave movements and Fibonacci sequence shows in the movement timings. The characteristics of the eight waves are illustrated according to Fig. 1.
The first wave: the first wave exists mostly in the form of a probe bottom, and from the time-sharing plan, there should be five small wave structures.
The second wave: the adjustment range of the second wave falls significantly; it can either reach 0.618 times the rising range of the first wave or possibly revisit the bottom of the first wave, thus making people think the price continues to fall.
The third wave: the third wave was the fiercest of the impulse waves. The third wave was often 1.618 times as high as the first wave, as well as having the ratio of the other terms of the Fibonacci sequence.
The fourth wave: the fourth wave often appears in a more complex form; its bottom is not lower than the top of the first wave. The low point of the fourth wave was the target for the bottom of the next wave adjustment.
The fifth wave: in the stock market, the range of the increase of the fifth wave was often smaller than that of the third wave, but this did not always occur, namely, the increased range of the fifth wave was often below the top of the third wave.
The ath wave: the ath wave is the first wave of three corrective waves, and it can mostly be divided into five lower level waves.
The bth wave: the bth wave was 0.382, 0.5 and 0.618 times as high as the ath wave.
The cth wave: the cth wave was the end point of the corrective waves and represented the trend of the whole corrective market; it goes back and up.
Chinese stock prices are determined by multiple influence factors; the relationships among these influence factors are complex, nonlinear, random and mutational. Therefore, it is difficult to describe Chinese stock prices using accurate mathematical models; thus, the prediction precision is low and the practicality was poor. However, the influence factors were gray and uncertain. A gray prediction model was easily calculated and required fewer samples. Therefore, many scholars have regarded the stock price system as a gray system and from that have made certain achievements. However, the stock prices have characteristics of an Elliot wave; therefore, Elliott Wave Theory was used to select the original data for modeling, and F i - GM (i = 1, 2) was used for calculated simulations and error prediction.
Establishment of the F i - GM (i = 1, 2) model for predicting the Chinese stock market
The development and change of the Chinese stock market could be reflected by the index trend, but it is difficult to judge the changes of the trends of the Shanghai Stock Index in the short or medium term. Hence, investors do not know what to do. Moreover, the Shanghai Stock Index has been developed for 30 years, since 1990, and since then, there has been a large amount of data produced. Therefore, the Elliott wave lines were drawn according to Elliott Wave Theory on daily, weekly and monthly scales, and then, these were forecasted. Because Elliott Wave Theory did not definitively note the method to be used to count the waves, this paper selected each action of the daily line of the Shanghai Stock Index as Elliott wave line and used the data of inflection points of the Elliott wave line as the original data to be used for modeling. June 24, 2016, was taken as the starting point of the Elliott wave line, each inflection point was selected as the original data, and the end point was July 26, 2016, as shown in Table 1. The data source can be clearly seen in Fig. 6.

Elliott wave line of the Chinese Shanghai Compo site Index from June 24, 2016, to July 26, 2016.
The numbers of the Chinese Shanghai Composite Index from June 24, 2016 to July 26, 2016
From Table 1, provided by Chinese Southwest Stock, were Chinese Shanghai index values of the continuous trading days from June 24, 2016, to July 26, 2016. Elliott wave lines were obtained according to the rise and fall of indexes, and the numerical values of the inflection points of the Elliott wave line are shown in Table 1.
The data in Fig. 6 are the complete Elliott wave line of the Shanghai Stock Index of the Chinese stock market for the continuous trading days from June 24, 2016, to July 26, 2016, and the first wave of the next wave line. The Shanghai Stock Index on June 24, 2016, was taken as the starting point of the Elliott wave line, and the Shanghai Stock Index on July 26, 2016, was taken as its end point. A wave represents a continuous rise or fall, and the intersection of the rise and fall is taken as the inflection point of the Elliott wave line.
The main goal of stock investors is to predict the next buying point and selling point, according to the short-term trends of the Shanghai Stock Index. Hence, this paper used the previous eight inflection point of the Elliott wave line to predict the next buying point of the Shanghai Stock Index, as well as using the previous nine inflection points to predict the next selling point of the Shanghai Stock Index. Data calculation: Parameter estimation:
Constructing the F
i
- GM (i = 1, 2) model. Compute and compare the simulation/prediction errors.
The predicted values
China’s Shanghai Composite Index from June 24, 2016, to July 22, 2016
In Table 2 shows that the performances of the three models in simulating China’s Shanghai Composite Index. The simulations of the three models are relatively strong. It is also shown that the data from the Elliott wave line inflection point used as the original data model make up for the shortcomings of the gray prediction model with large data, which satisfies the conditions of gray modeling and produces an accurate model. According to Table 2, the broken lines of the simulated/ forecasted values of GM (1, 1), F1 - GM, and F2 - GM models are depicted in Fig. 7.

(a) GM(1,1) model. (b) F1 - GM model. (c) F2 - GM model.
Some important conclusions are obtained from Fig. 7 (a)– (c), which can be stated as follows.
(i) It was concluded that, in comparing the three models, the simulation and prediction of the F1 - GM model were the worst, those of the traditionalGM (1, 1) model were in the middle, and those of F2 - GM were the best. Simultaneously, it was shown that the background value optimization was effective according to the relationship of
As seen from Table 1 and Fig. 6, there are ten inflection points on the Elliott wave line, which can be divided into two stages. The first five numbers are the rising stages of the first five waves. The last five numbers can be regarded as the data from the descending phase after the fifth wave. Although only five numbers long, the data are also suitable for gray models. Now, we mainly use the GM (1, 1) model, F1 - GM and F2 - GM to find the simulated values for the rising and falling waves of the Elliott wave line. As shown in Tables 3, 4.
China’s Shanghai Composite Index from June 24, 2016, to July 26, 2016
China’s Shanghai Composite Index from June 24, 2016, to July 26, 2016
As can be seen from Table 3, while the simulations of all three models are strong, the simulation of the F2 - GM model is the best, the simulation of the traditional GM (1, 1) model is in the middle, and the simulation effect of F1 - GM is the worst. According to the data in Table 3, the simulated values of China’s Shanghai Composite Index from the GM (1, 1), F1 - GM, and F2 - GM models are depicted in Fig. 8.

Predictive results of the F i - GM, i = 1, 2 models and those from the GM (1, 1) model.
The results shown in Table 4 indicate that the simulation accuracies of the three models are very similar, but the simulation accuracy the F1 - GM model is the best among the three models, which testifies to the correctness of using the concavity and convexity of the curve to optimize the background value and validates the effectiveness of the structural reform of the traditional GM (1,1) model. Using the data in Table 4, the simulated values of China’s Shanghai Composite Index from the GM (1, 1), F1 - GM, and F2 - GM models are depicted in Fig. 9.

Predictive results the F i - GM, i = 1, 2 model, as well as those from the GM (1, 1) model.
From Table 2, 3, and 4 and Fig. 7, 8, and 9, we select the cross-sectional data of all the inflection points on the Elliott wave line and the cross-sectional data of the rising and descending waves as the experimental data. It can be seen that there is a higher accuracy in the F1 - GM model and F2 - GM model than in the traditional GM (1, 1) model, and according to the characteristics of the data, we can choose an optimal model using the F1 - GM model and F2 - GM model.
China’s stock market plays an increasingly important role in the national economy, given the development of China’s economy and the prosperity of the country. The Shanghai Composite Index reflects the state of all the shares of the Shanghai Stock Exchange and, to a certain extent, reflects the state of the Chinese economy. Elliott Wave Theory is one of the three pillars of securities investment, and it is characterized by the Fibonacci sequence and golden ratio. According to the gray prediction model, which has the characteristics of a simple calculation, strong adaptability and better mutation parameter changes and acts according to the properties of the Fibonacci sequence and golden ratio, the background value of the classic gray model GM (1, 1) is optimized; this paper identifies two new models and shows the following work: The Fibonacci sequence within Elliott Wave Theory is studied, and the data of the golden ratio is studied. According to the important properties of the Fibonacci sequence and the golden ratio, the background values of the classical GM (1, 1) model are optimized; two new gray models, F1 - GM F2 - GM, are obtained; and the important properties of the models are studied. The gray model is suitable for small samples, while China’s Shanghai index has many data points. To this end, the forecast of the Elliott wave line is drawn and then the inflection point data (cross-sectional data) are selected as the original data, making the data suitable for gray modeling. Taking China’s Shanghai index as empirical evidence, the inflection points on the Elliott wave line are used as the original data, and the two models are analyzed empirically, according to the rising wave, descending wave and whole wave line. The validities of the models are verified, and the results are consistent. At the same time, the optimal F
i
- GM, i = 1, 2 model can be selected according to the data characteristics of this particular system in China.
Footnotes
Acknowledgments
This work is supported by the National Natural Science Foundation of China (Nos. 71540027, 71271226, 71671135, 51479151). The Science and Technology Research Program of Chongqing Municipal Educational Committee (No. KJ1600425).