
Abstract
In order to investigate the effect of Distribution Automation (DA) on network reliability enhancement, two different planning and operation strategies are presented in this paper i.e. switch placement and Distribution Feeder Reconfiguration (DFR). Furthermore, because of increased utilization of Plug-in Electric Vehicles (PEVs) and their capability of Vehicle to Grid (V2G) technology, these intelligent bilateral energy sources can affect on switch placement problem and system reliability. Therefore, through a new failure rate reduction approach due to PEVs as well as evaluating of the System Average Interruption Frequency Index (SAIFI) and System Average Interruption Duration Index (SAIDI), system reliability is investigated in both strategies. In this regard, the objective functions to be investigated are total cost of switches and cost of PEV fleets in switch placement problem as well as SAIFI, SAIDI, active power loss and voltage deviation in DFR problem. In addition, in order to achieve more reliable results, both of strategies are presented in stochastic framework by 2m + 1 Point Estimate Method (PEM). The uncertainty of the active and reactive loads and load annual growth rate as well as active and reactive hourly loads are considered in switch placement and DFR problems, respectively. Simulation results verify the proposed strategies should be investigated in probabilistic framework and finally feasibility of the proposed method is studied by Modified Teaching Learning Algorithm (MTLA) through a 69 bus IEEE distribution test system.
Introduction
The reliability enhancement is one of the main purposes in distribution networks. Implementing of distribution automation strategies is one of the most efficient approaches to improve system reliability [1]. In fact, asset management and automation are recognized as the most effective projects at hand of decision makers in distribution utilities to increase the reliability and efficiency [2]. With regard to automation degrees of distribution feeder, implementing automation is performed in terms of sectionalizing switch placement and distribution feeder reconfiguration. Therefore, determining of the number and location of the automation devices (ADs) in both of distribution automation planning and operation strategies is a complex optimization problem which has been taken into account in many contributions for enhanced solutions [3–9]. A variety of methods have been devoted to consider the distribution automation system from planning perspective. For instance, in [3], two strategies including distributed generation (DG) and protection devices are proposed for radial distribution feeder protection to increase reliability. A composite reliability index is used to place protection devices and DGs in [4] in order to enhance power system reliability by an ant colony algorithm. Authors in [5] propose a method for switch placement in distribution networks in the presence of DG sources. The objectives which have been considered are reliability indices and cost of sectionalizing switches. In [6], optimal composition and placement of automatic switches and reclosers is proposed to implement of Distribution Automation System (DAS). Authors in [7] propose a new objective function named as average restoration time index to model the existing uncertainties of automatic switching, meanwhile Fault Indicator (FI) placement has been considered as protection devices. In [8], based on the particle swarm optimization algorithm, optimal placement of switches is performed. Enhancement of reliability has been considered in this paper, too. A new cost/benefit analysis for an optimal level of DA is proposed in [9]. In this paper, with respect to effect of earth fault events, the benefit of automation systems is calculated. From another point of view, considerable researchers have been conducted for feeder reconfiguration and capacitor placement as the proper choice of DA in the form of operation strategies. In [10], regulation of voltage and minimization of active power loss in distribution networks has been presented. In this regard, mentioned problems have been investigated in the same time from two standpoints. The first is optimal control of shunt capacitor banks and under load tap changer transformers at HV/MV substations and the second is the optimal control of tie switching and capacitor banks on feeders. A joint optimization algorithm including improved adaptive genetic algorithm (IAGA) and a simplified branch algorithm is proposed in [11] for evaluating the network reconfiguration and capacitor placement, simultaneously. In [12], based on a simple branch exchange method of a single loop, the problem of feeder reconfiguration is solved from network loss reduction point of view. From another side, a joint optimization algorithm including genetic algorithm (GA) and simulated annealing (SA) is applied to combine the reconfiguration and capacitor placement problems and therefore to obtain maximum loss reduction. Ref [13] proposes an efficient algorithm for allocating of capacitor and distribution feeder reconfiguration. In this paper, author claims that outcome of the proposed approach can use to purchase new capacitor banks. However many researchers have studied reliability improvement through reconfiguration [14–17]. Similarly, the impact of capacitor placement on reliability of distribution network is investigated in [18]. The reconfiguration and capacitor placement problems are solved in distribution networks for loss reduction and reliability improvement in [19].
However, very little attention has been paid to investigate of distribution automation planning and operation strategies from reliability enhancement standpoint. Therefore, the main contributions of this paper are organized as follows in two parts. In the first part, a new failure rate reduction approach in the form of a stochastic switch placement problem is introduced. Based on this approach, two important factors (named as time and temperature) are presented which can affect on failure rate value of the corresponding PEV fleets and therefore reliability enhancement. The multiple objective functions which should be minimized are total cost of placed switches and cost of PEV fleets. The cost of PEV fleets is defined as the cost of missed energy of PEV fleets which could be sold to the network but has not been returned due to the fault occurrence. In the second part, a failure rate reduction approach as well as reliability indices objective functions (SAIDI and SAIFI) are investigated in a probabilistic framework to evaluate of system reliability. Meanwhile, optimal placement of switched capacitors is considered too. The simultaneous considering of recent idea and on/off status of placed switched capacitors in three load levels in the form of DFR problem can bold automation strategy from operation point of view. The rest of this paper is organized as follows. In section 2, problems are formulated. In this regard, problem formulation is performed in two parts of switch placement and DFR problems. A new failure rate reduction idea due to the presence of PEV fleets and a conventional failure rate reduction approach due to the implementing of DFR are presented in section 3. In section 4, proposed uncertainty method is discussed in the form of 2m + 1 PEM. Sections 5 and 6 are paid to the optimization technique and simulation results, respectively.
Problem formulation
Switch placement problem
The main objective of switch placement problem is to determine the optimal number and location of sectionalizing switches in order to minimize the customer outage costs in conjunction with sectionalizing switch capital investment, installation, and annual operation and maintenance costs [4]. Furthermore, nowadays because of increasing and extensive presence of PEVs in distribution network, the role of these intelligent sources on DA strategies isn’t negligible.
Total cost
The total cost objective function is calculated based on the proposed method described in [4]. Corresponding to this method, total cost of placed switches equals to sum of outage costs, capital investment, installation cost as well as annual operation and maintenance costs and formulated as follows.
Where
Where
L (n, l) Average load of the customers at the n th load point λ (m, l, t) Average failure rate of all distribution components T Life period of switch timeN feeder Total number of feedersN fault Total number of probable faults on feeder lN load Total number of load points on feeder lCDFl,m (m, n, l) Customer damage function q Annual load growth rateDR Annual discount rate N switch Total number of installed switchesCinvestment (sw) Capital investment Cinstallation (sw) Installation cost Coperation &maintenance (sw) Annual operation and maintenance cost X (sw, l) A set of binary variables which determines presence or absence of sectionalizing switch on feeder l
With regard to increasing dispersion of PEV fleets in all over the distribution network and from another point of view their V2G capability, returning of their saved energy to the grid in peak load times can affect on plans of decision makers. In fact, cost of PEV fleets is defined as the cost of missed energy of PEV fleets which has not been return to the grid due to the isolation of faulted part. Accordingly, cost of PEV fleets can formulated as follows.
Meanwhile
Where
In fact,
T day Time interval of PEV activities during a day N fleet Total number of PEV fleets λ daily (m, l, t) Average daily failure rateT start Start time of PEV activity T End End time of PEV activity γ Energy price (in U.S. dollars per) kilowatt-hour)
Number of maximum allowable installed switches
Limitation of uncertain variables
Where
Where
f1,U1(,U2) (x) Value of the upper standard deviation in the first (second) uncertain variable based on corresponding probability density function f1,L1(,L2) (x) Value of the lower standard deviation in the first (second) uncertain variable based on corresponding probability density functionC sw Purchase cost of each switch
In order to minimize conventional and reliability objective functions in a radially distribution network, network configuration should be varied to achieve a new structure. This process is named reconfiguration and performed by two types of switches: opening normally close and closing normally open switches, meanwhile all of the loads would energize and radially structure of the network is preserved, too.
Active power loss
Where |V i | and N bus are the magnitude current of ith bus and number of buses, respectively.
In fact, SAIDI is defined as the ratio of total duration of interruptions for a group of customers to number of all customers and indicated in hour per customer. Accordingly, SAIDI is formulated as follows:
SAIFI is defined as the ratio of total number of interruptions for a group of customers to number of all customers and indicated in interruptions per customer and formulated as follows:
Where λ i is defined as the average failure rate of ith component.
Limitation of power flow equations
Where |Vi(,j)| and |δi(,j)| are defined as the voltage magnitude and angle of the i (, j)th bus, respectively. Also |Y
ij
| and θ
ij
are the branch magnitude and angle between ith and jth buses, respectively. Limitation of the line capacity
Where Radial structure of the network Number of capacitor switching during the next day
Where Limitation of the buses voltage
Where |Vmax| and |Vmin| are the maximum and minimum magnitude voltage of buses, respectively.
A new failure rate reduction idea due to the presence of PEVs
In subject of network reliability, one of the most important strategies to enhance reliability is based on failure rate reduction approach. Accordingly, effective parameters in reducing failure rate value are recognized and with regard to their compensation percentage, proper coefficients are built. According to the different presence hours of PEV fleets and therefore corresponding to various temperatures during a day, time and temperature are chosen as the two effective parameters which can reduce failure rate and therefore improve the system reliability. Mentioned coefficients are built in two parts as follows. In the first part, temperature coefficient is built. In this regard, corresponding temperature is compared to a reference temperature as follows:
Where ρ
tmp
is temperature coefficient which is defined as the ratio of t
tmp
to t
ref
. Then,
Where
Then, to obtain
Now to obtain new value of failure rate, following equation is used:
From another point of view in the second part, time coefficient should be built. In this regard,
Where
t The times in which PEV fleets are active and exchange energy with the main grid
Then to achieve the last value of failure rate,
Where
According to the available statistics about interruptions, a great number of failures occur in overhead and underground cables [18]. From another point of view, a high temperature can cause insulation failures [20]. In underground cables, high temperature is produced as a result of resistive losses. This temperature can reduce by decreasing the current magnitude (resistive losses changes proportionally to the square of the current magnitude). In overhead lines, high currents and therefore high temperatures can cause the lines to sag which will increase the probability of an electric break occurring. Therefore, based on this strategy any approach which can reduce the magnitude of current in the network feeders would cause low temperature in lines/cables and therefore, enhance the system reliability [21]. Implementing of DFR strategy is a proper solution to change the direction of power flow and therefore to reduce the temperature as a result of current magnitude reduction. With regard to the current compensation before and after reconfiguration, the proper coefficient is built and a new failure rate is calculated as follows:
Where
With regard to the random intrinsic of the engineering problems, these problems should be solved in a stochastic framework to obtain more reliable and exact answers. 2m + 1 PEM is an effective strategy to cope with existing uncertainties. With respect to 2m + 1 PEM, input uncertain variables (P) are transferred to the output variables (Z) based on a non-linear function (F) corresponding to the following equation:

Two dimension illustration of the 2m + 1 PEM.
As shown in Fig. 1, each of random variables is represented with a probability density function. From another point of view, in 2m + 1 PEM, kth point of each random variable is represented by three locations ɛl,k and three weighting factorsωl,k, k = 1, 2, 3. Based on this method, first four central moments including mean, variance, coefficient of skewness and kurtosis are considered to generate the locations and weight factors in the form of (ɛl,k, ωl,k) as follows [22]:
The values of ɛl,k, ωl,k are calculated as follows:
Then to estimate of the jth stochastic output variables, E (Z) , E (Z
j
) are used as follows:
Where E (Z) and E (Z j ) are considered as the expected value and jth output moment of the stochastic output variable, respectively.
As we know, formulation of the problem by the Teaching-Learning Based Optimization (TLBO) algorithm is implemented in two phases i.e. Teacher phase and Learners phase. In teacher phase a vector is defined which includes the mean of all decision variables and named Mean
iter
and Teacher
iter
shows the teacher in ith iteration of the algorithm. With regard to endeavor of the Teacher
iter
to increase of Mean
iter
, a new mean is obtained and named Mean
new
based on the following formula:
Where is the vector of control variables and T
factor
is gained as follows:
In learners phase, the learners interact together and therefore can enhance their situation according to the following formula:
Characteristics of PEV fleets
Characteristics of PEV trips
The presence hours of PEV fleets in the network and their corresponding temperatures
Results of optimal switch placement in stochastic and deterministic frameworks
In fact, after implementing of two basic steps,
X
j
and X
k
refer to the two solutions which are selected randomly so that i ≠ j ≠ k. Xk,l,m,n,p,q are defined as the random chosen solutions so that ≠X
i
and cross variable is chosen between 0, 1. So according to the MTA algorithm and based on the member of learners, three X
new
are considered and the best solutions are chosen between them as
Assumptions
The 69 bus IEEE distribution network is chosen to investigate of automation strategies in the form of switch placement and DFR. With respect to different horizon of planning and operation strategies, various assumptions of the network should be considered in switch placement and DFR problems.
Assumptions for switch placement problem
First, according to planning approach of switch placement analysis, mentioned test system is considered in the form of partially automated radial distribution network. In this regard, annual load growth and annual discount rates are considered as uncertain variables. But in deterministic analysis, these parameters are considered to be 3% and 8%, respectively. Moreover, switching and repair times are equal to 0.5 (hour) and 6 (hour), Composite Customer Damage Function (CCDF) for the switching and repair times are 1.1 ($/ - kw) and 20 ($/ - kw), respectively. Also, the life period of switches is assumed to be 15 years. Nevertheless, the capital investment and installation cost as well as annual operation and maintenance cost are considered to be U . S . $ 4700 and U . S . $ 94, respectively. Meanwhile, PEV fleets characteristics, characteristics of PEV trips and presence hours of PEV fleets are presented in Tables 1–3, respectively.
Assumptions for DFR problem
In the second part of paper, DFR problem is solved. Accordingly, distribution test system is considered as fully automated radial distribution network. In order to change the reconfiguration of the network, 5 tie switches are assumed in the test system. Also, in order to implement of automation strategies, 7 capacitors are placed and switching of them is performed in three load levels to be 0.8 × load, 1.1 × load and 1 . 3 × load during a day, respectively.
Probability density function.
Deterministic and stochastic non-dominated solutions except voltage deviation from 3-D plot point of view.
The non-dominated solutions for the multi-objective DFR problem
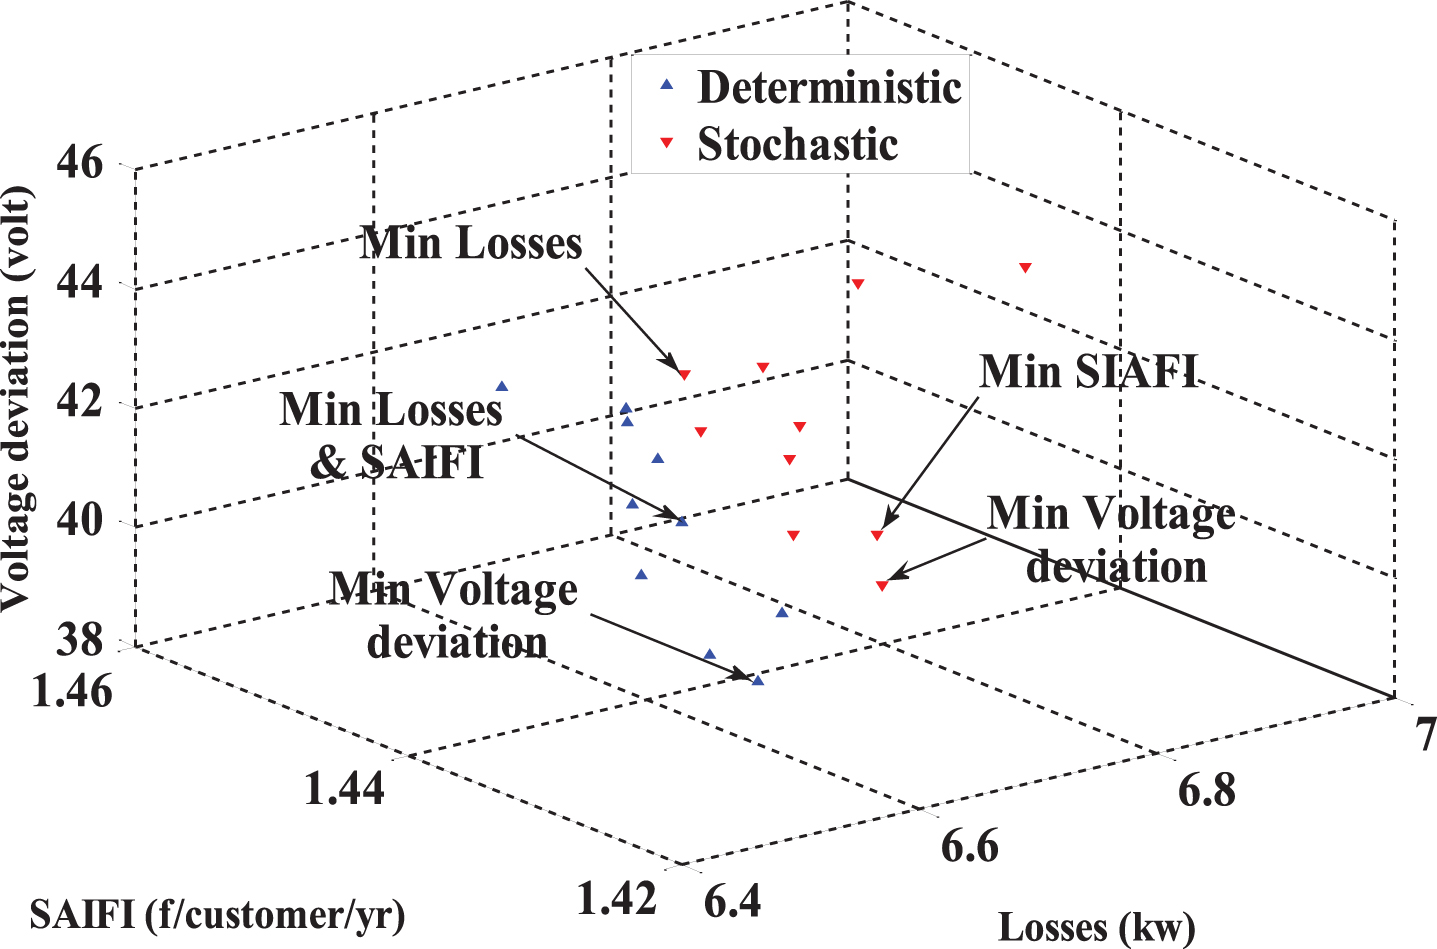
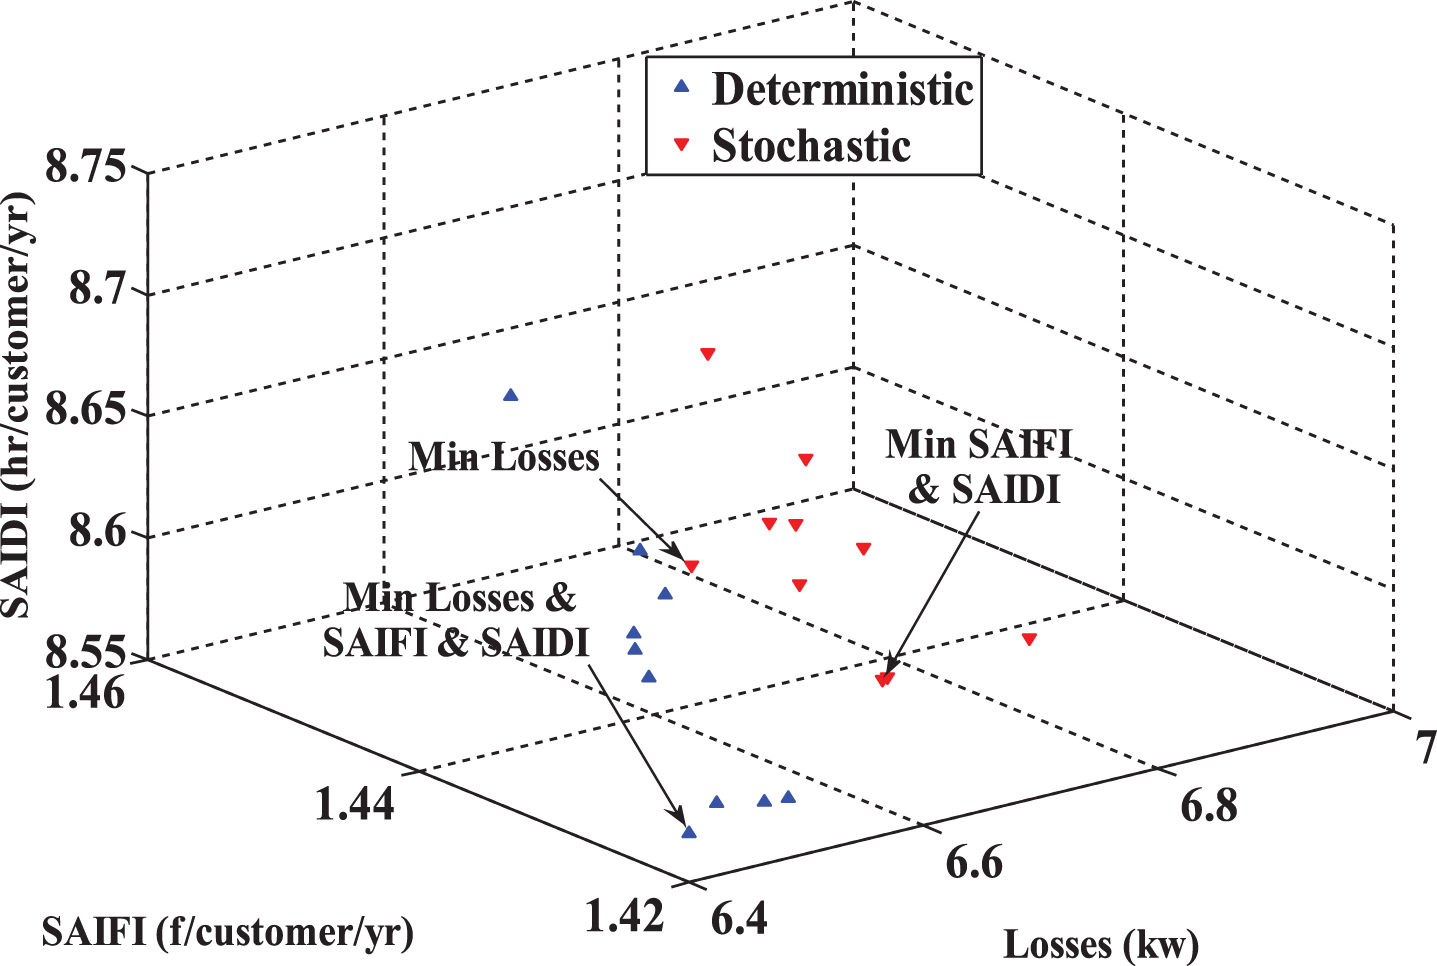
Deterministic and stochastic non-dominated solutions except SAIDI from 3-D plot point of view.
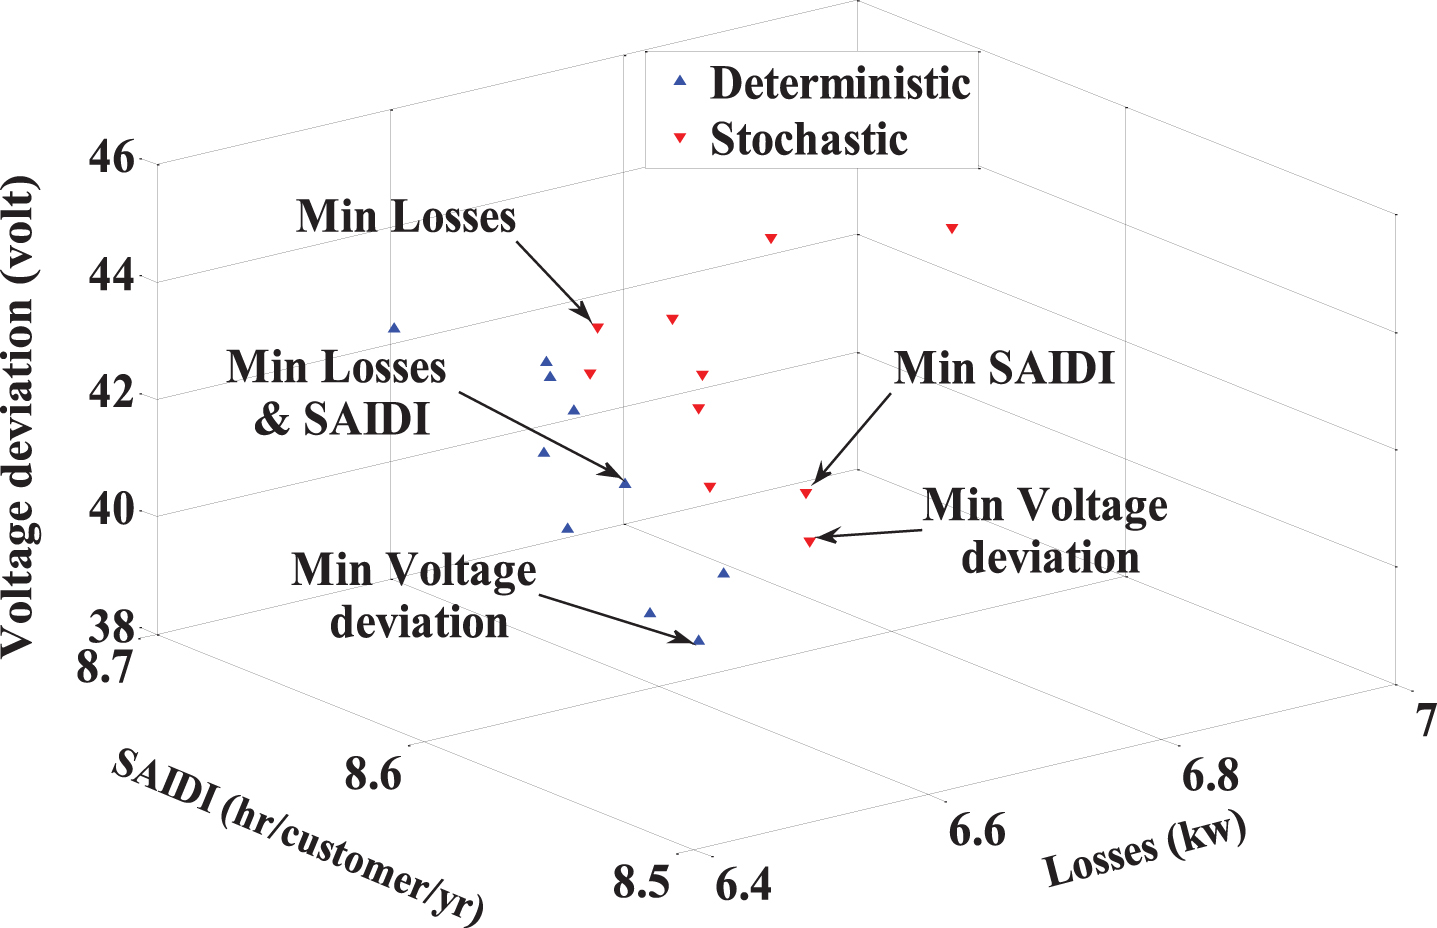
Deterministic and stochastic non-dominated solutions except SAIFI from 3-D plot point of view.

Deterministic and stochastic non-dominated solutions except active power loss from 3-D plot point of view.
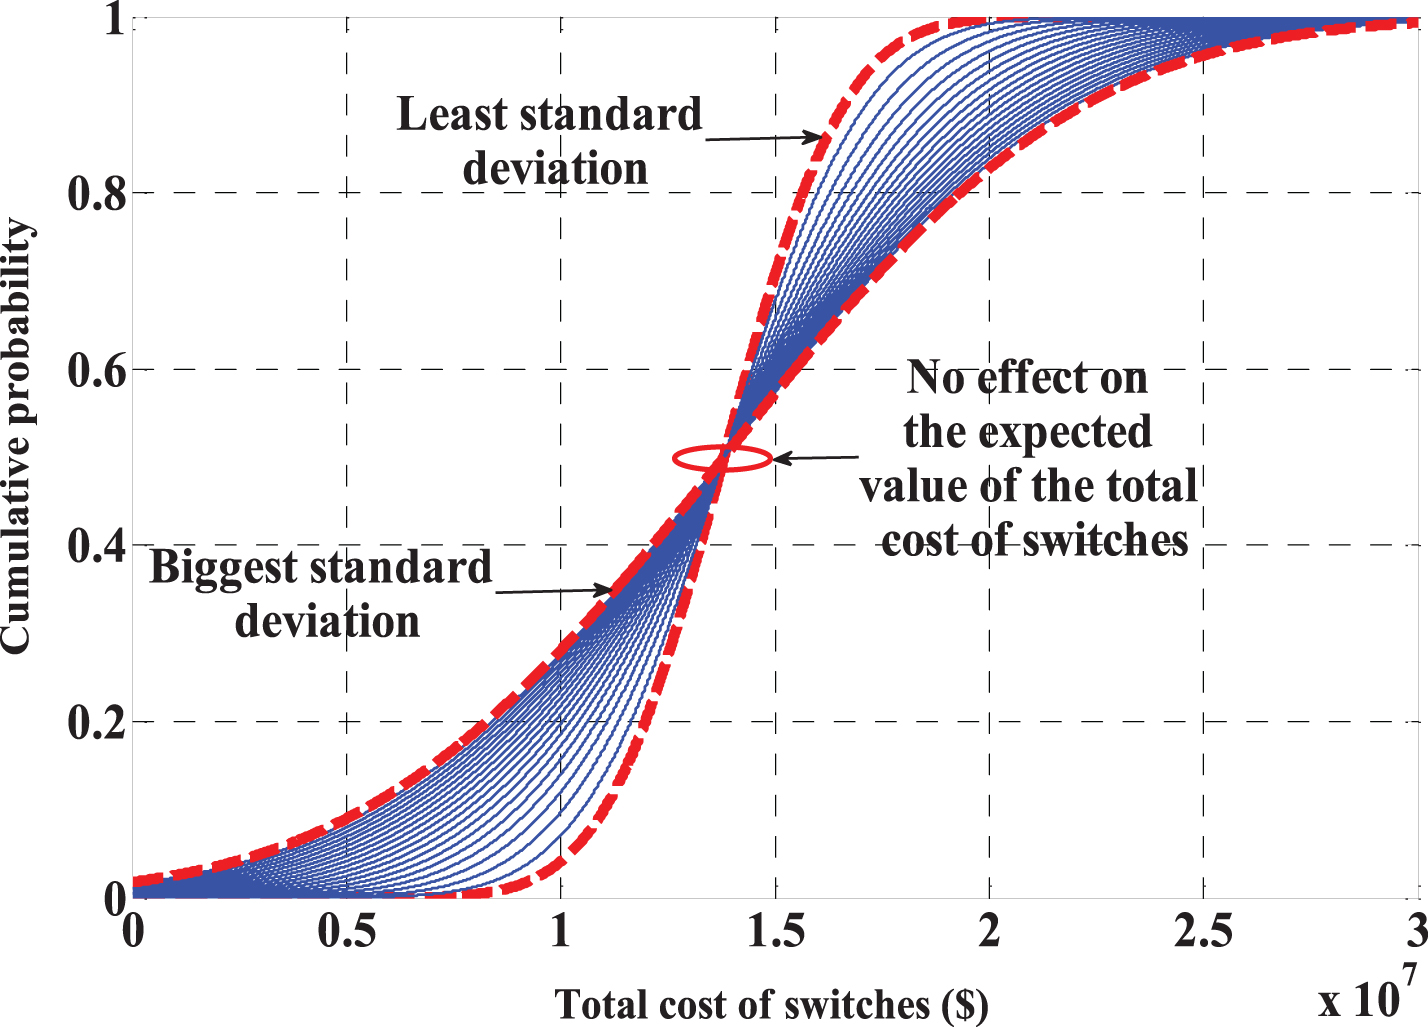
Analyzing of the standard deviation of the random variables in the case of switch placement strategy.
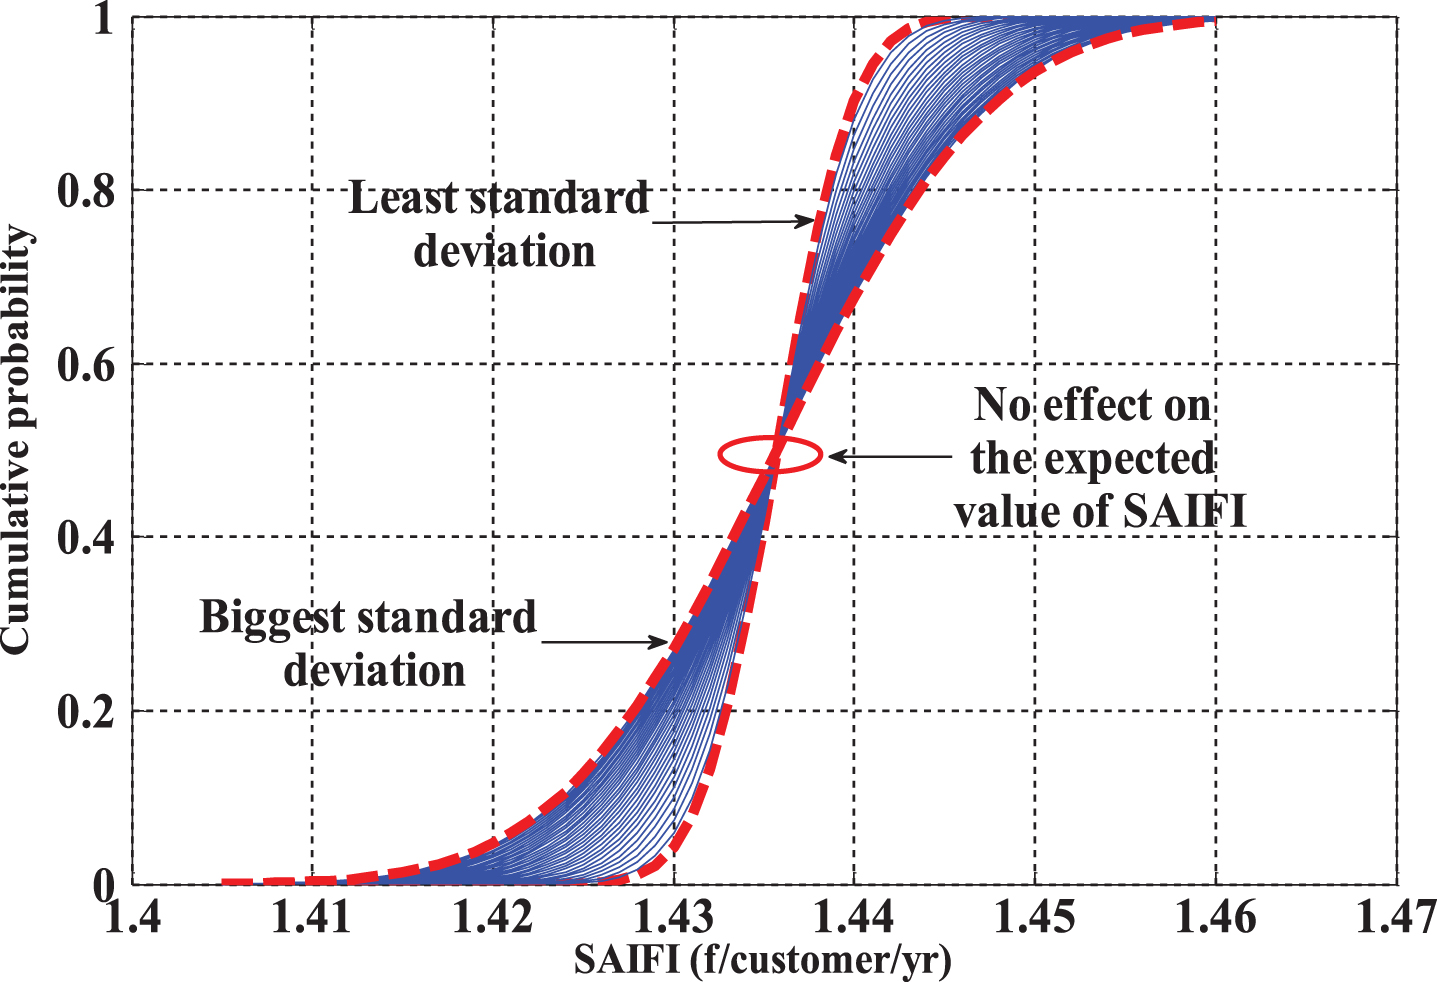
Analyzing of the standard deviation of the random variables in the case of DFR strategy (SAIFI objective functions).
According to mentioned procedure of this paper, first, the results of switch placement problem are presented. In this regard, problem is solved in different deterministic and stochastic frameworks as well as single and multi-objective functions. Results of optimal switch placement problem have been presented in Table 4. As shown, no change is seen in the cost of PEV fleets in the case of single objective function in deterministic and stochastic frameworks (bold style). In fact, with regard to the uncertain variables i.e. active and reactive loads and annual load growth rate and the presence of them in formulation of total switch cost objective function, this event is explainable.
Useful solution results of DFR in single and multi objective functions
Useful solution results of DFR in single and multi objective functions
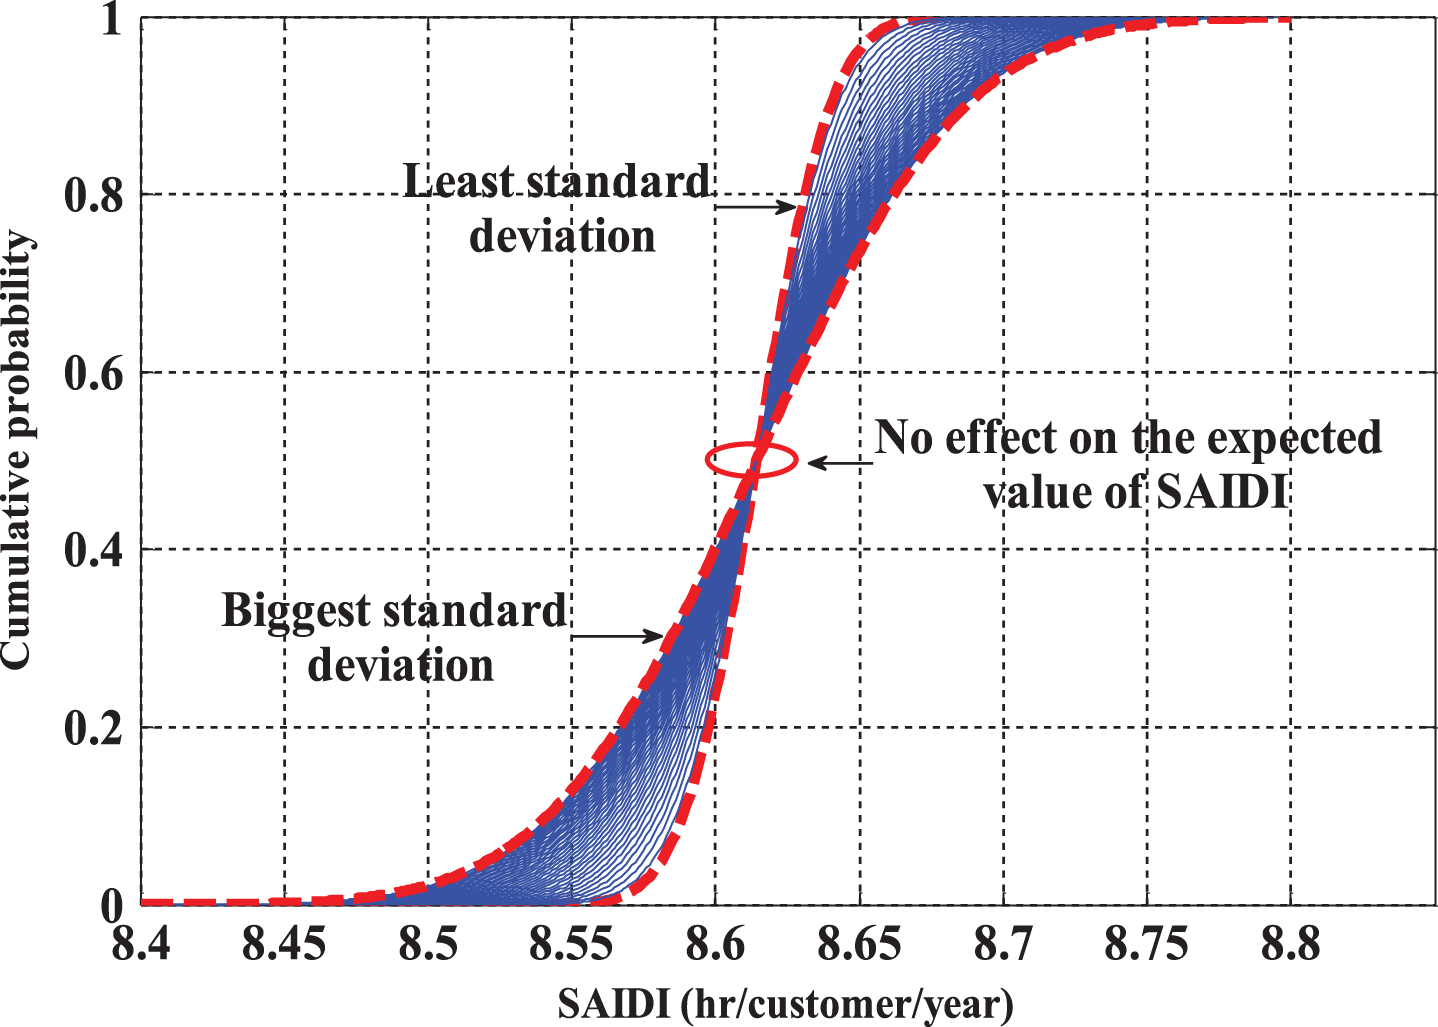
Analyzing of the standard deviation of the random variables in the case of DFR strategy (SAIDI objective functions).
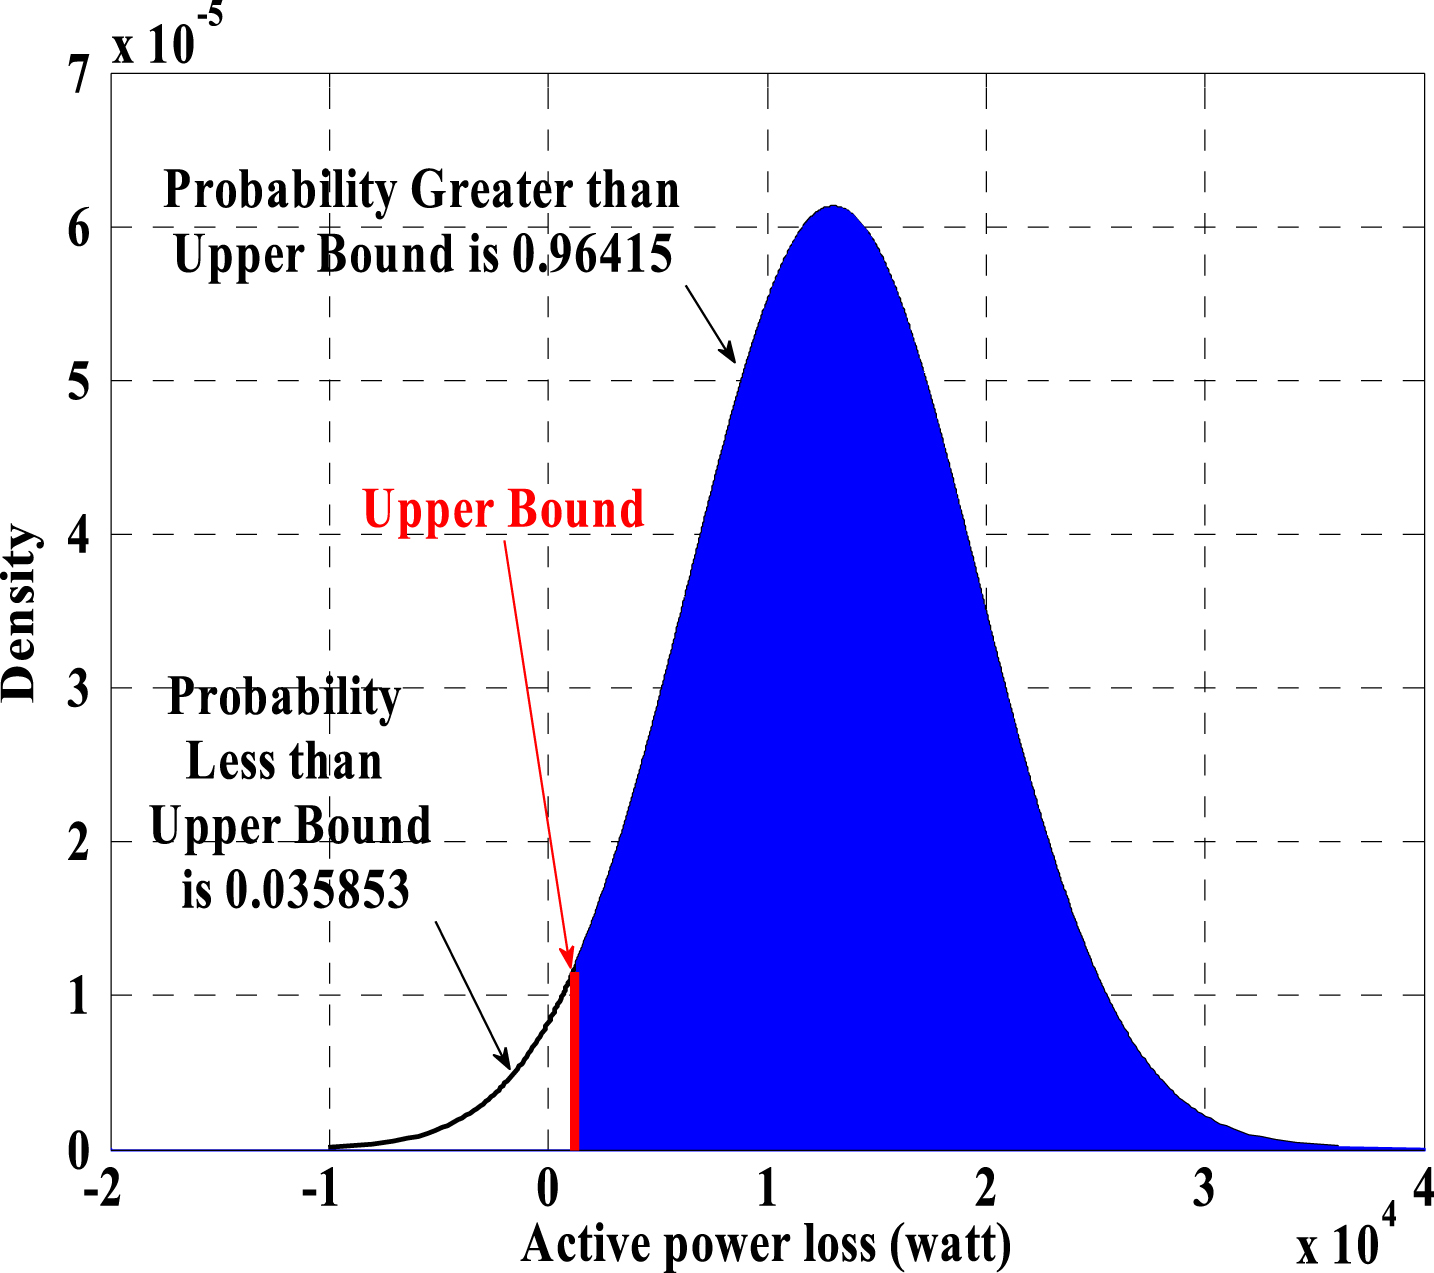
In the second part of analytical discussion, results of DFR problem are demonstrated. In order to investigate of the necessity of evaluation in a probabilistic environment, a Probability Density Function (PDF) has been shown in Fig. 3. In this regard, once the best solution of deterministic state is replaced in stochastic form and again the best solution of stochastic state is considered. Then, according to the gained results, for example, PDF of active power loss in two mentioned states is plotted. With respect to upper bond in PDF, deterministic state covers only 3.6% of all situations in stochastic one and accordingly, DFR problem should be solved in stochastic framework. Analyzing of the standard deviation of the random variables in the case of DFR strategy (conventional objective functions). Optimal location and on/off status of switched capacitors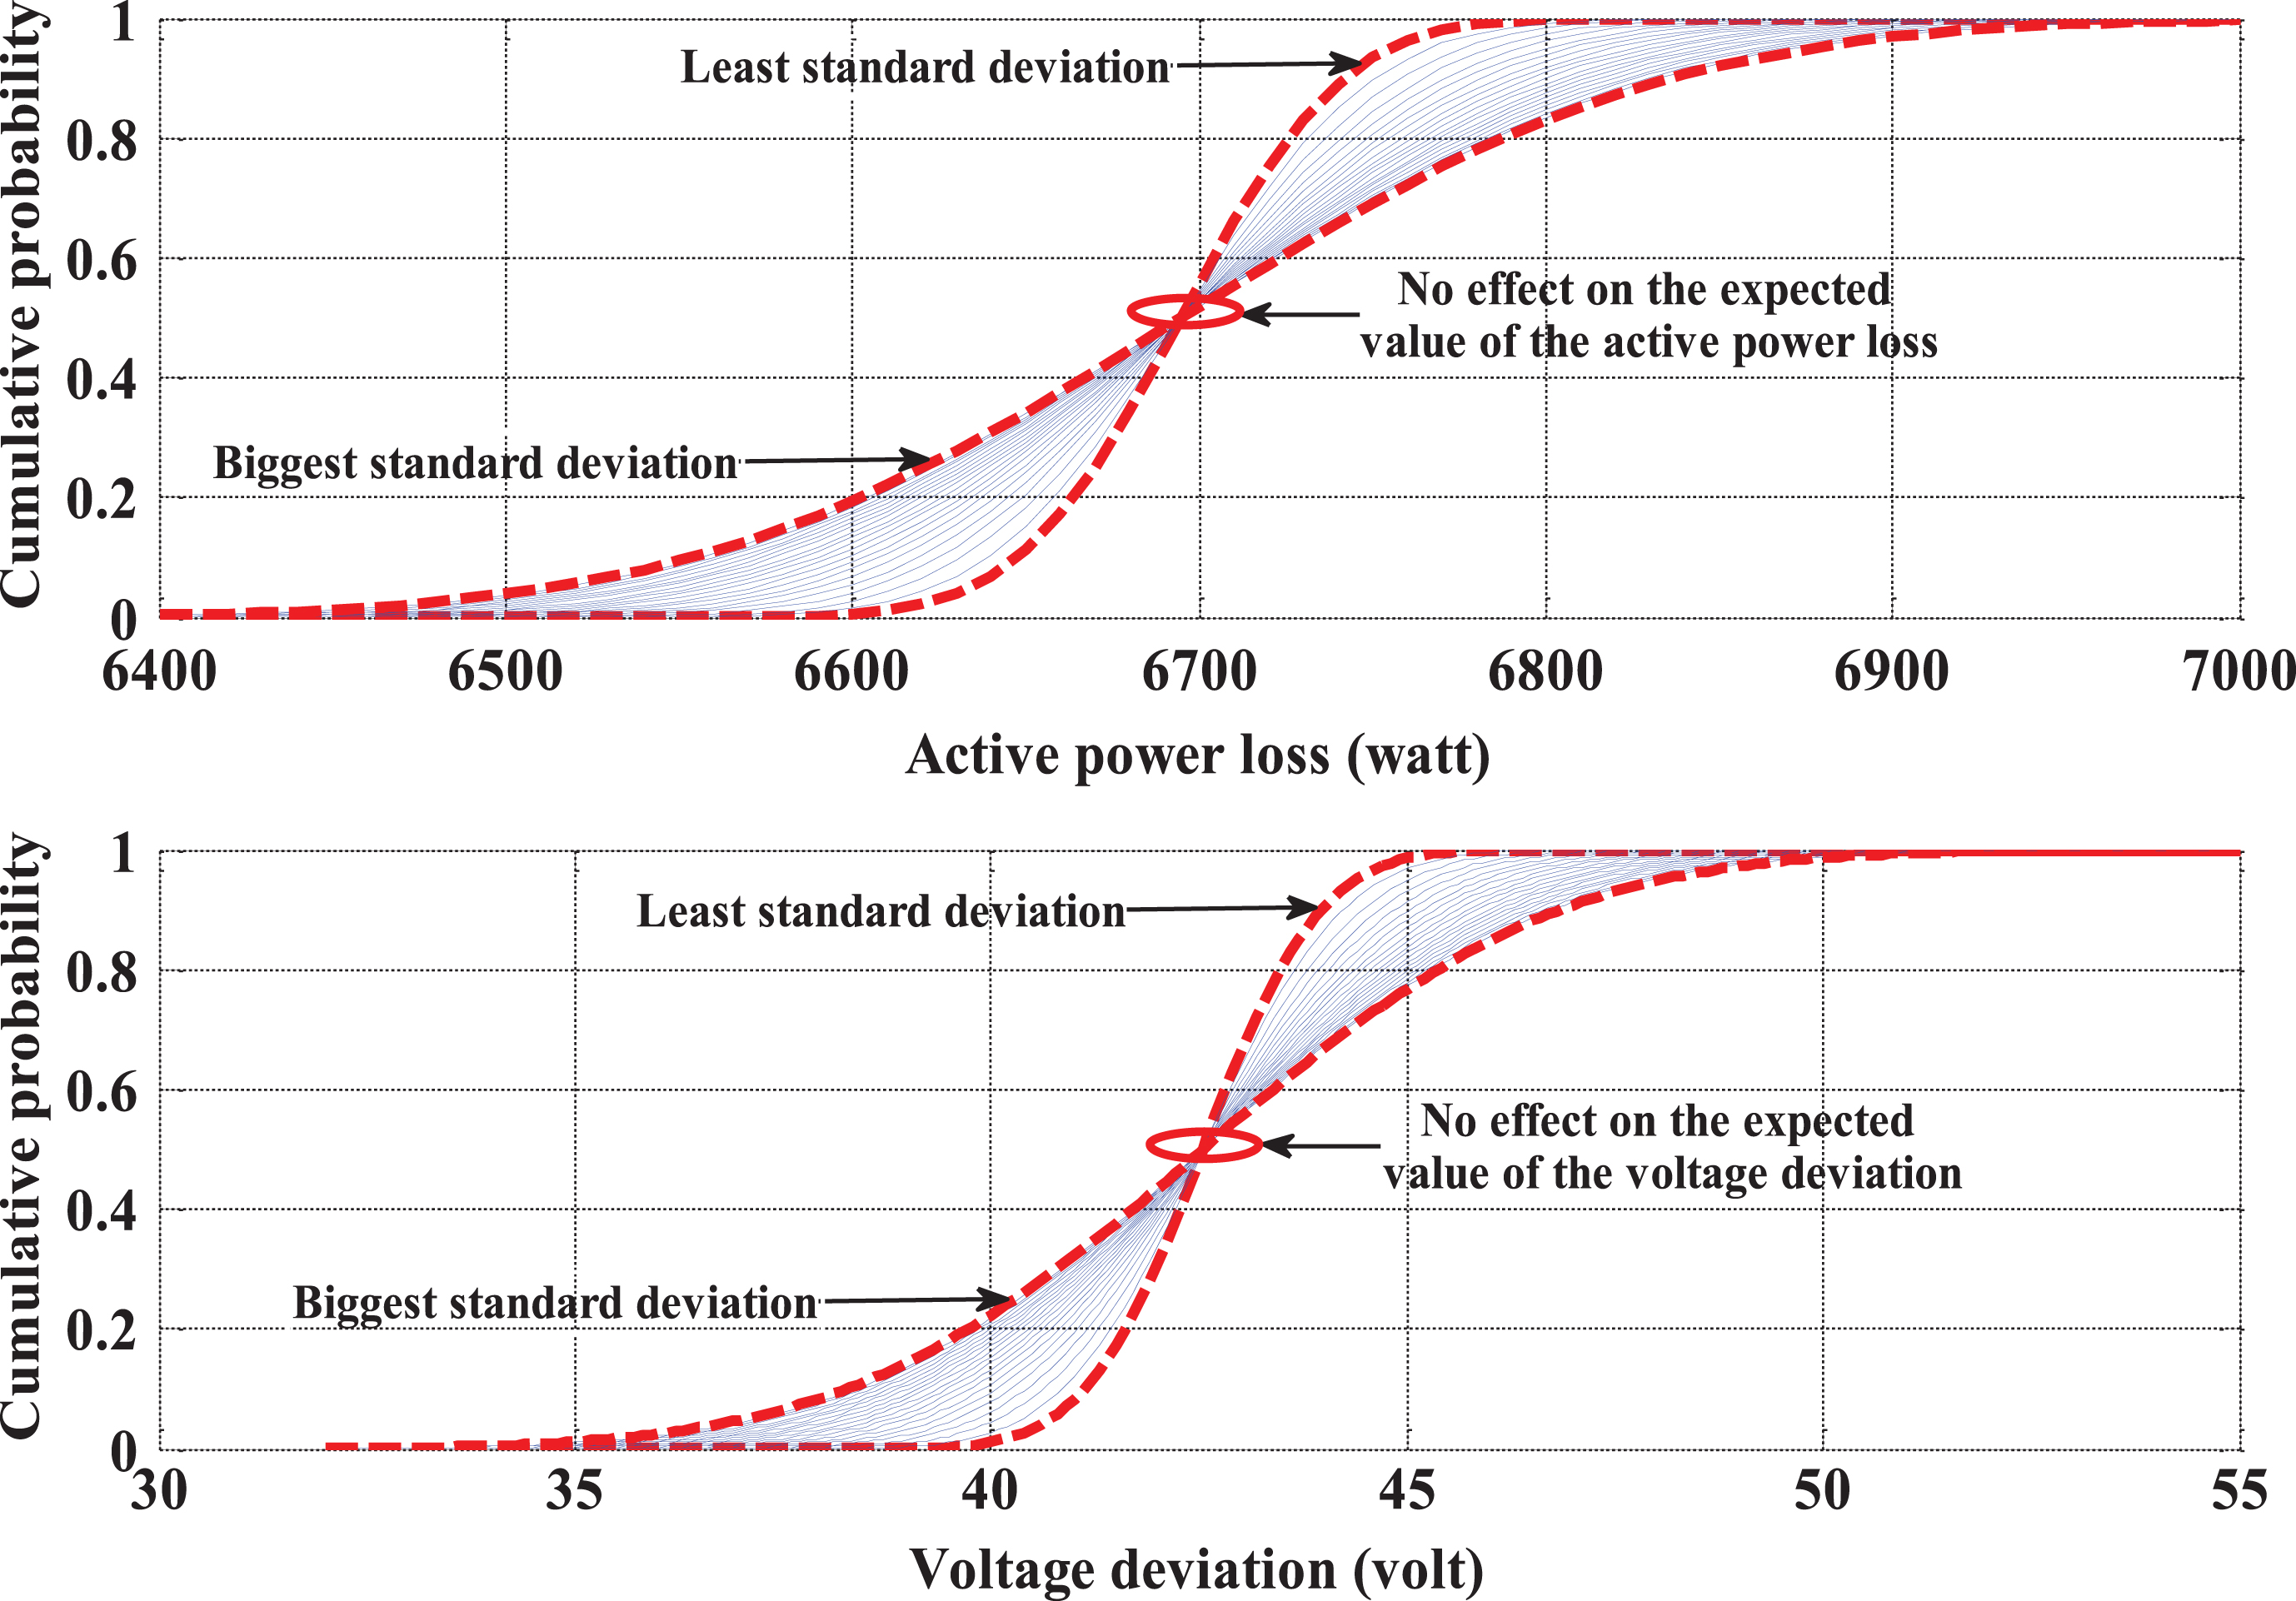
In this paper, two planning and operation strategies were proposed in order to implement of distribution automation system in the presence of PEV fleets. Moreover, enhancement of system reliability was evaluated, too. In this regard, a new failure rate reduction method was proposed in switch placement problem. This method is based on the analyzing of two effective parameters on the failure rate value due to the V2G technology of PEV fleets. Similarly, a failure rate reduction approach was presented in DFR problem as well as reliability indices such as SAIFI and SAIDI. Meanwhile, both of planning and operation strategies were revealed in a stochastic framework by 2m + 1 PEM. Also, simulation results in the form of cumulative density function and PDF verify the proposed stochastic method to solve the optimization problems. Finally, in order to enhance distribution automation performance, optimally placed of switched capacitors was performed and on/off status of them was presented in three load levels during a day.