
Abstract
This paper presents some capabilities of automation system from distribution planning and operation points of view. In this regard, the optimized switch placement and Distribution Feeder Reconfiguration (DFR) strategies are applied to the network to investigate the reliability of the system based on failure rate reduction. The objective functions to be minimized are the total switch cost in switch placement problem and System Average Interruption Frequency Index (SAIFI); System Average Interruption Duration Index (SAIDI) and active power loss as well as voltage deviation from nominal in the feeder reconfiguration problem. Also, through this analysis and by selecting the location of capacitors as well as ON/OFF status of the placed switched capacitors and tap position of Under Load Tap Changer (ULTC) transformers as control variables, the concepts of capacitor placement and Volt/Var Control (VVC) are evaluated. The problems are solved by using the Modified Social Spider Optimization (MSSO) algorithm as a proper method to solve the mixed-integer nonlinear programming problem. The proposed distribution automation planning and operation strategies are applied to a 69 bus IEEE distribution test system and simulation results are demonstrated and discussed.
Keywords
Nomenclature
The decision variables of the switch placement (DFR) objective function
The location of switches
The number of placed switches
The life time of network switches
The number of feeders in the network
The number of probable faults which occur in feeder f
Capital investment expenses (purchase, shipment, etc.)
The installation cost
Binary decision variable which which shows the existence or non-existence of switches
The state of the ith tie switch (0 meaning open state and 1 meaning closed state)
The state of the ith sectionalizing switch forming loop with tie i
The ith placed capacitor
The state of ith capacitor (0 meaning off state and 1 meaning on state)
The tap position of the ith ULTC transformer
The resistance of the ith branch
The current magnitude of the ith branch
The voltage magnitude of the i, (j)th bus
The injected active power at the ith bus
The injected reactive power at the ith bus
The voltage angle of the i, (j)th bus
The magnitude of the branch admittance between ith and jth buses
The angle of the branch admittance between ith and jth buses
The maximum (minimum) tap of the ith ULTC transformer
The maximum (minimum) number of changing of the ith transformer tap
The number of male spiders
The number of female spiders
The total population of spiders
The Euclidian distances between the individual spider i to the best number
The Euclidian distances between the individual spider i to the nearest number
The nearest female spider to the ith male spider
The least failure rate of the network branches
The most impedance of the network branches
The voltage of the ith bus in the Lth iteration
The number of load points in the feeder f
The failure rate of distribution elements grouped together on the feeder (feeder sections, transformers, etc.)
The average load of customers on jth load point of feeder f
The load annual growth rate
The composite customer damage function (CCDF)
The annual discount rate
The operation and maintenance cost
The number of switches installed in the network
The maximum of permissible switches
The number of network branches
The number of buses
The number of sources
The number of tie switches
The number of ULTC transformers
The number of placed capacitors
The ON/OFF states of placed capacitors
The total number of customers
The average failure rate of the ith component
The annual outage time for ith location
The magnitude active power transmitted between the ith and jth buses
The maximum active power transmitted between the ith and jth buses
The current magnitude of the ith feeder
The maximum current of the ith feeder
The maximum (minimum) magnitude of voltage
The location of females
The location of males
The lower initial parameter bound
The upper initial parameter bound
The fitness value of the spider location s i
The most failure rate of the network branches
Impedance of the ith network branches
The least impedance of the network branches
Introduction
With respect to available failure statistics, the distribution networks make the most contribution to the unavailability of supply to the customers [1]. So, using optimal reliability strategies seems to be essential to make sure that the restricted existing resources would be used to get advantage of the maximum possible utilization of the distribution network [2]. Moreover, due to the load growth, some planning and operation strategies should be implemented to provide a reliable and cost-effective service to the users. Technologies such as distribution automation in the form of planning and operation strategies are considered as one of the most important technologies in a smart distribution grid which should be aligned with the company’s strategic plan [3]. In the literature of distribution network automation, many studies have been performed in the form of planning and operation. The majority of researches are performed in the area of distribution network planning [4–8]. In [4], a constructive heuristic algorithm (CHA) is proposed to solve the distribution system planning (DSP) problem. According to [5], a genetic algorithm approach has been proposed to the optimal multi stage planning of distribution networks. A new genetic algorithm is proposed for optimal designing of the large distribution systems, solving the optimal sizing and locating the problems of feeders in [6]. In [7], the simulated annealing technique is proposed for optimal planning of radial distribution network. An improved algorithm based on a branch-exchange technique is proposed to solve large-scale problems in distribution networks in [8]. Some studies have been carried out to place switches to support the existing customers [9–11]. Accordingly, a new formulation for power system sectionalizing device placement is proposed in [9]. In fact, an optimization technique based on simulated annealing is presented to determine the number and locations of sectionalizing switches. In [10], switch placement schemes are proposed to enhance reliability of the system for radial distribution networks with distributed generation (DG) under fault conditions. The immune algorithm (IA) is proposed to improve the cost-effectiveness of the distribution automation system in [11]. Among these useful researches most attention has been paid to preserve the system reliability in an acceptable and allowable level [12–14]. The authors in [12] propose a method for placement sectionalizing switches in distribution networks in the presence of DG sources. Meanwhile, reliability enhancement and minimization of the cost of sectionalizing switches have been considered as objective functions. In [13], the multi-objective ant colony optimization (MACO) algorithm has been proposed to minimize the total cost while simultaneously minimize the two distribution network reliability indices including system average interruption frequency index (SAIFI) and system interruption duration index (SAIDI). The authors in [14] propose a multi-objective optimal placement of switching devices considering DG unavailability, network reliability, and equipment cost; with no island network operation. Also, a great deal of research works has been done in the field of DFR as an operation problem [15–18]. A new 0–1 integer programming method of feeder reconfiguration for loss minimization in distribution systems is proposed in [15]. An artificial neural network (ANN)-based reconfiguration method is developed to solve the network reconfiguration problem to reduce the real power loss in the distribution networks in [16]. The authors propose new algorithms for solving the optimal feeder reconfiguration problem, the optimal capacitor placement problem and the problem of a combination of the two in [17]. A reconfiguration methodology based on an ant colony algorithm has been proposed in [18] aiming to achieve the minimum power loss and increment load balance factor of radial distribution networks with distributed generators. Anyhow, very few studies have taken the DFR problem for reliability improvement into consideration [19, 20]. In [19], a new model is presented for improving the reliability indices e.g. SAIFI, SAIDI and average service availability index (ASAI) through the network reconfiguration. In [20], a new method is presented to improve the system reliability by considering DFR problem. However, in the two recent research works, the multi-objective problem is converted into two single objective problems and each of them is needed to be run to obtain the best solutions. Also, the objective functions in these research works are just defined in the form of reliability indices; while, the active power loss as a considerable subject to researchers and power utilities has been neglected. A new improved shuffled frog leaping algorithm (ISFLA) is proposed in [2] to solve the DFR problem from reliability enhancement perspective. In this paper, both reliability and active power loss objective functions are considered, but there isn’t any view of automation. Nevertheless, as most of the failures happen in the voltage level of distribution network [21] and based on this reasoning, the voltage deviation objective function seems to be necessary to investigate. The main contribution of this paper with respect to the previous ones can be summarized as follows: 1. Switch placement problem is formulated from distribution automation planning perspective. 2. Multi-objective DFR problem is formulated as an automation planning and operation strategy. 3. Based on the failure rate reduction approach and reliability objective functions, network reliability is evaluated. 4. By simultaneous consideration of ON/OFF status of switched capacitors and tap position of ULTC transformers in DFR strategy, VVC is evaluated for the next day. 5. Optimal placement of 7 capacitors is done. Accordingly, expansion planning approach has been considered as well. The remainder of this paper is organized as follows: In Section 2, the problem formulation including decision variables, objective functions and constraints are presented in the form of switch placement and DFR problems. The reliability enhancement strategies in both of the mentioned problems are presented in Section 3. The structure of Modified Social Spider Optimization (MSSO) algorithm as an optimization method is implemented in Section 4. Since objective functions in DFR problem may conflict with each other, a fuzzy clustering technique is used to manage the best solution in Section 5. In order to implement the distribution automation strategies, a 69 bus IEEE distribution test system is chosen as the case study and the simulation results are presented and discussed in each of the switch placement and DFR problems in Section 6.
Problem formulation
Switch placement problem
Benefits of the automated sectionalizing switches can be quantified in terms of the reduced duration of outage and the reduced number of customers affected during permanent faults by fast restoration of power to un-faulted customers. This can be done by isolating the faulted part of the network by remote switching of sectionalizing devices and supplying the un-faulted part from other routes. Hence, distribution network configuration, number and type of customers upstream and downstream the sectionalizing switch, etc., can affect the benefits of automated sectionalizing device placement dramatically.
Decision variables
Switch placement problem as a planning approach in implementing of automation system is formulated as follows:
The objective function which should be minimized in switch placement problem is the total cost of switch which can be calculated as follows [22]:
The constraints which should be preserved in this problem are as follows: Number of switches
The radial structure of the network
Decision variables
Feeder reconfiguration problem as an operation approach in implementing the automation system can be formulated as follows:
Where F2 (X2) is considered as the vector of objective functions and f i (X2) , i = 1, …, 4 are intended objective functions.
Active power losses This objective function can be formulated as follows:
Voltage deviation from nominal This objective function is formulated as follows:
System Average Interruption Frequency Index (SAIFI) The system average interruption frequency index is commonly used as a reliability indicator by electric power utilities. SAIFI is the average number of interruptions that a customer would experience and is calculated as follows:
So, SAIFI is defined as the ratio of the total number of customer interruptions to the total number of customers served. SAIFI is measured in units of interruptions per customer during the course of a year. System Average Interruption Duration Index (SAIDI) The system average interruption duration index is also commonly used as a reliability indicator by electric power utilities. SAIDI is the average outage duration for each customer served and is calculated as:
So, SAIDI is measured in units of time and often minutes or hours and it is usually measured over the course of a year.
Distribution line limits The amount of active power flow in each feeder should not exceed the maximum power transfer capacity of that feeder as follow:
Power flow equation
Radial structure of the network
This constraint has also been considered in switch placement problem. Feeders current
Tap position of ULTC transformers
Number of transformer tap changing during the next day
Bus voltage limits
Reliability improvement based on switch placement strategy
Enhancing the reliability of distribution network is one of the most significant subjects in today’s power market. In fact, reliability enhancement always incurs a cost because some preventive and protective devices had to be added to the network [23]. In the switch placement analysis, failure rate value is considered to be constant. However, placing switches at different segments of a network definitely improves the reliability because CCDF reduction in segments of the network occurs due to energy not supplied (ENS) reduction. So, reducing these parameters can significantly enhance the reliability.
A reliability improvement strategy by the reconfiguration
With regard to the available failure statistics, a significant part of the interruptions occurs in voltage level in overhead and underground cables of the distribution networks. On the other hand, for each of underground cables, a maximum operating temperature is determined according to the permitted temperature range for cables. Otherwise, insulation failure will occur and definitely affect the failure rate value. Moreover, moisture absorption occurs more quickly at high temperatures. Once moisture invades extruded dielectrics such as cross-linked polyethylene or ethylene-propylene rubber, the voltage withstand capability of the cable is reduced and the probability of dielectric breakdown increases (failure rate of the cable is increased) [24]. Meanwhile, an event called resistive losses which can produce heat and increase the temperature of the mentioned cables should be considered. Similar interpretation can be presented for the overhead cables. As a result, it can be said that each strategy which can reduce the current magnitude of branches will cause failure rate reduction and reliability enhancement will consequently occur. Distribution operation feeder reconuration takes place by changing the structure of the network; while, minimizing the active power loss as an objective function can reduce the magnitude of current and can consequently be considered as a reinforcement reliability strategy. From another point of view, the implementation of DFR reinforces the loadability of the feeders and thus enhances the system reliability. Therefore, by reducing the current magnitude and augmenting the loadability of feeders, the DFR can be supposed as a failure rate reduction approach to enhance the reliability of the system. With respect to the mentioned points, it is to be supposed that the value of failure rate for each line i before implementing DFR is defined as
Where ξ is defined as the coefficient of current compensation obtained by the ratio of the current magnitude before and after implementing DFR represented by the following equation:
Power flow analysis in the distribution networks plays an important role in the optimization process. Because of this, since distribution networks are ill-conditioned, conventional Newton-Raphson (NR) and Fast-Decoupled Load Flow (FDLF) methods are inopportune at solving such networks [26]. However, the algorithm used for load flow should be computationally ingenious and numerically vigorous. Accordingly, the forward– backward sweep or ladder iteration method [27] is utilized. Along with the forward-backward sweep-based distribution load flow algorithms, other conventional transmission load flow is suggested to overcome the high
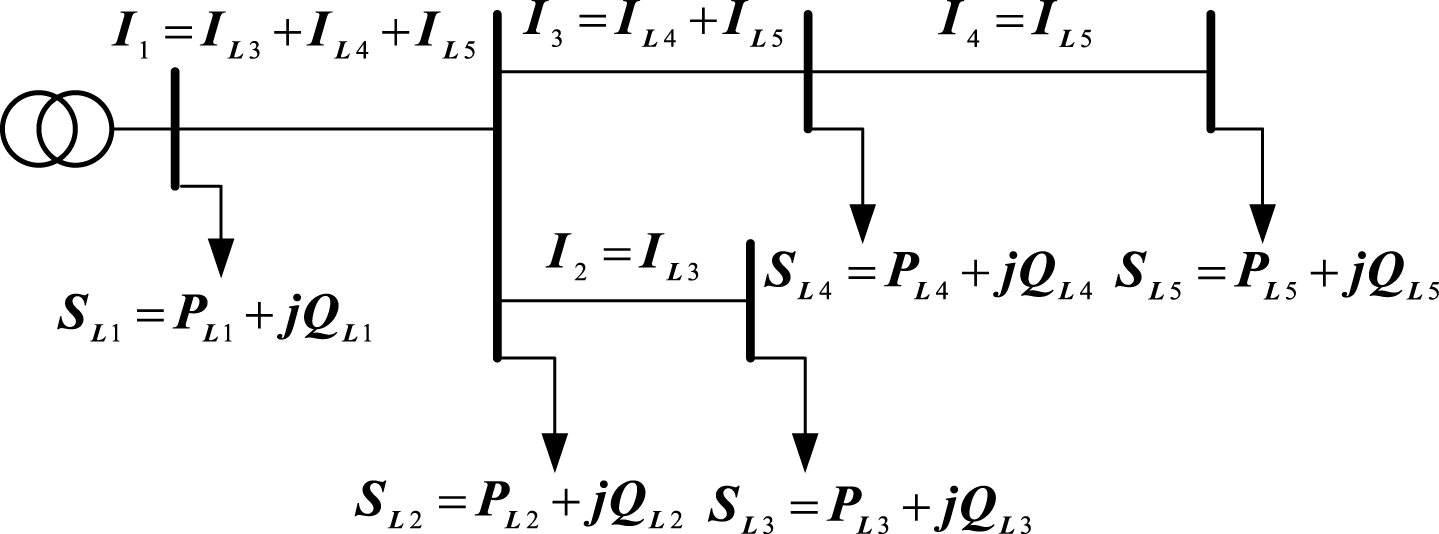
A sample distribution system for load flow analysis.
In this regard, the voltage magnitude at all buses is assumed to be 1pu in the first iteration and then based on Equation (20), the load and line currents are calculated, respectively. Then, with regard to Kirchhoff’s voltage law, the voltage magnitude of all buses is calculated. Calculation of bus voltage is started from the source bus and is continued to the last bus. This process should be repeated until the termination criterion is satisfied as follows:
Structure of SSO algorithm
Like the other optimization nature-inspired algorithm to start SSO algorithm, an initial population should be produced. This population includes female and male spiders. On the other hand, with regard to the greater number of females than males, the number of females is randomly selected within the range of 65% to 90%. It is noted that the population size equals the sum of male and female spiders and can be calculated as follows [28]:
Accordingly, the locations of female
Where α1 and α2 are numbers between 0 - 1. Also,
The significant subject which should be taken into account is the exchange of the information among spiders on communal web based on the vibrations generated by spiders. The weight and distance of the spiders relative to each other are the two important factors which classify the transmitted vibrations into three different classes: Vibration generated and sent by the individual spider i and received by the nearest member c (s
c
) to i with a higher weight we
c
. Vibration generated and sent by the individual spider i and received by the best member b (s
b
) and has the best weight in the whole population we
b
. Vibration generated and sent by the individual spider i and received by the nearest female f (s
f
). Accordingly, irrespective of gender, female spiders exhale an attraction or a repulsion. Based on the information contained in vibration structure, such behavior is exhibited. Thus a random number called μ is selected within the range of 0 - 1. Then, according to the number produced, an attraction or a repulsion is produced by the female spiders as follows:
The first and the second sentences of
Where we is the median weight represented by Nfe+ma of male spider population. Also, ɛ and τ are the random numbers between 0 - 1 and finally,
Where n is the dimension of the problem, and
By incorporating two modification strategies, a new phase is added to the SSO algorithm to enforce adaptive development to the algorithm. In fact, each of the spiders can select the best strategy based on its probability. The strategies are explained as following [28]:
Accordingly, to replace ith spider a new solution is produced as below:
According to the above solution and using the best solution in the population X
b
, three individuals are generated on a mutative base as below:
With regard to the mentioned strategies, one with higher probability will be chosen. If the new individual has better condition performed by enhancing the fitness function, then it is replaced by the ith spider. The important point which should be considered is that the new spider inherits the gender of the banished spider to preserve the proportion of male and female population in the colony. Meanwhile, each of the recent strategies is selected with the probability of 0.5. Also, the spider population is arranged according to the objective function making X1 and X
N
p
named as the best and the worst solutions, respectively. Now, each solution would gain a success factor which is generated according to the following equation:
Additionally, in order to gather the number and factor of the solutions, a stack is allotted for each of strategies. The mentioned generated stack is indigent at the beginning and is updated according to the following equation:
Once the accumulation of each strategy is determined, the probability of the strategy is chosen as below:
θ is set to 0.142 in this paper. Accordingly, the mentioned probabilities are normalized and used in the algorithm. Meanwhile, based on Roulette Wheel Mechanism (RWM), spiders use the most possible strategy in each iteration to achieve the best solution. Also, δ is a random value between 0 - 1.
As mentioned before, while solving the multi-objective optimization problem, the set of Pareto optimal solutions are obtained and saved in a repository memory. There may exist several optimal objective vectors representing different tradeoffs between the objectives. The set of optimal solutions in the decision space is in general denoted as Pareto-optimal set. With many multi-objective optimization problems, knowledge about this set helps the decision maker in choosing the best compromise solution [29]. Because of this reason and to reduce the size of the repository and keep it in an allowable limit, the fuzzy clustering technique is applied. Based on this method, each objective function should be converted to a function known as pseudo-objective function. The fuzzification procedure is done through an objective function according to the following formula [30, 31]:
Where
Then, max/min operator enhances the situation of each objective function based on the reference membership values and an optimal solution is obtained in accordance with the following formulas:
Assumptions
The mentioned problems are solved based on a 69 bus IEEE distribution test system [28]. Corresponding to [28], tie and sectionalizing switches are shown by dotted (S69, S70, …, S73) and solid lines (S1, S2, …, S68), respectively. In order to solve the switch placement problem, the intended distribution network is supposed to be partially automated and in the form of analytical feeder reconfiguration, a fully automated distribution network is assumed. A typical distribution feeder with two various automation degrees have been presented in [22]. Accordingly, in the form of fully automated distribution network, sectionalizing switches are located at both sides of each feeder. But, in a typical partially-automated network, sectionalizing switches are located at three, four (or more) locations depending on automation degree. When a fault occurs in a network on one of the grid lines, the following steps should be taken to get it cleared. Step 1. The existing normally closed switch is opened and for a moment the whole feeder remains without energy. Step 2. The adjacent sectionalizing switches to fault location are opened. Step 3. After isolating the faulty part, the existing switches at the beginning and end of each feeder are closed and the network is reenergized. In such a network, all of the customers can be energized after a short time (time interval for switching) and a fixed amount of transmitted power is provided by the adjacent feeders. In the second case, the network is not fully mechanized and the optimal location of switches is done in such a way that a compromise would be achieved between costs and incomes due to the automation implementation. Based on the mentioned explanations, different assumptions must be considered for implementing the distribution automation planning and operation strategies. Table 1 presents the assumptions used in both of the mentioned problems. For example, the line failure rate with the most and the least impedances are supposed to be 0.4 (failure/year) and 0.1 (failure/year), respectively. On the other hand, from feeder reconfiguration strategy point of view and with regard to a main breaker and a sectionalizing switch located in the main feeder at the beginning of each line, the repairing and switching times are considered to be 6 (hour) and 0.5 (hour), respectively. In this case, 5 tie switches and 5 sectionalizing switches are considered as control variables to preserve the radial structure of the network as well as to solve the DFR problem. From another point of view, in order to improve the voltage profile, 7 capacitors with predetermined capacity (Q c = 200KVAR) are chosen as control variables. Furthermore, ON/OFF status of 7 placed capacitors and tap position of 3 ULTC transformers are the rest control variables in the DFR problem.
Data supposed for the 69 bus IEEE distribution test system
Data supposed for the 69 bus IEEE distribution test system
In the first part of simulation results, the effect of optimized switch placement strategy is evaluated. Accordingly, the proposed formulation of single objective switch placement problem is applied to the network. The optimal switch locations have been presented in Table 2. In this case, the number of switches is 48 and according to Equation (2) the total cost of switches including investment expenses, operation and maintenance cost, installation cost, etc. to be U . S . $3.3323 × 10⁷. From another analytical view, in the second part of simulation results, the effect of DFR operation strategy is evaluated for reliability enhancement and from volt/var control point of view. In this regard, 24 hour load curve of the network has been given in Fig. 2. To demonstrate the superiority and capability of the proposed algorithm, the comparison of cost function value for the average, best and the worst solutions has been performed using GA, PSO, HBMO, TLBO, original SSO and MSSO. According to Table 3, the MSSO algorithm provides better performance in comparison to GA, PSO and original SSO algorithms. Also, the high stability of the proposed MSSO algorithm is deduced from the low values of the standard deviation parameter. The best solution and the states of the open switches before and after DFR have been shown in Table 4. As shown in Table 4, the DFR operation strategy has appropriately reduced the amount of active power losses (46%) and voltage deviation (46.55%). As previously mentioned, the DFR operation strategy can satisfactorily decrease the line magnitude current as well as the active power losses. As soon as the current magnitude is decreased, the ruinous impacts of the temperature are reduced and consequently the system reliability is improved [32]. In order to show the satisfying performance of the DFR operation strategy, current magnitude of distribution lines before and after DFR has been shown in Fig. 3. As seen, the implementation of DFR in the distribution network reduces the current magnitude effectively.
Optimal location of switches
Optimal location of switches
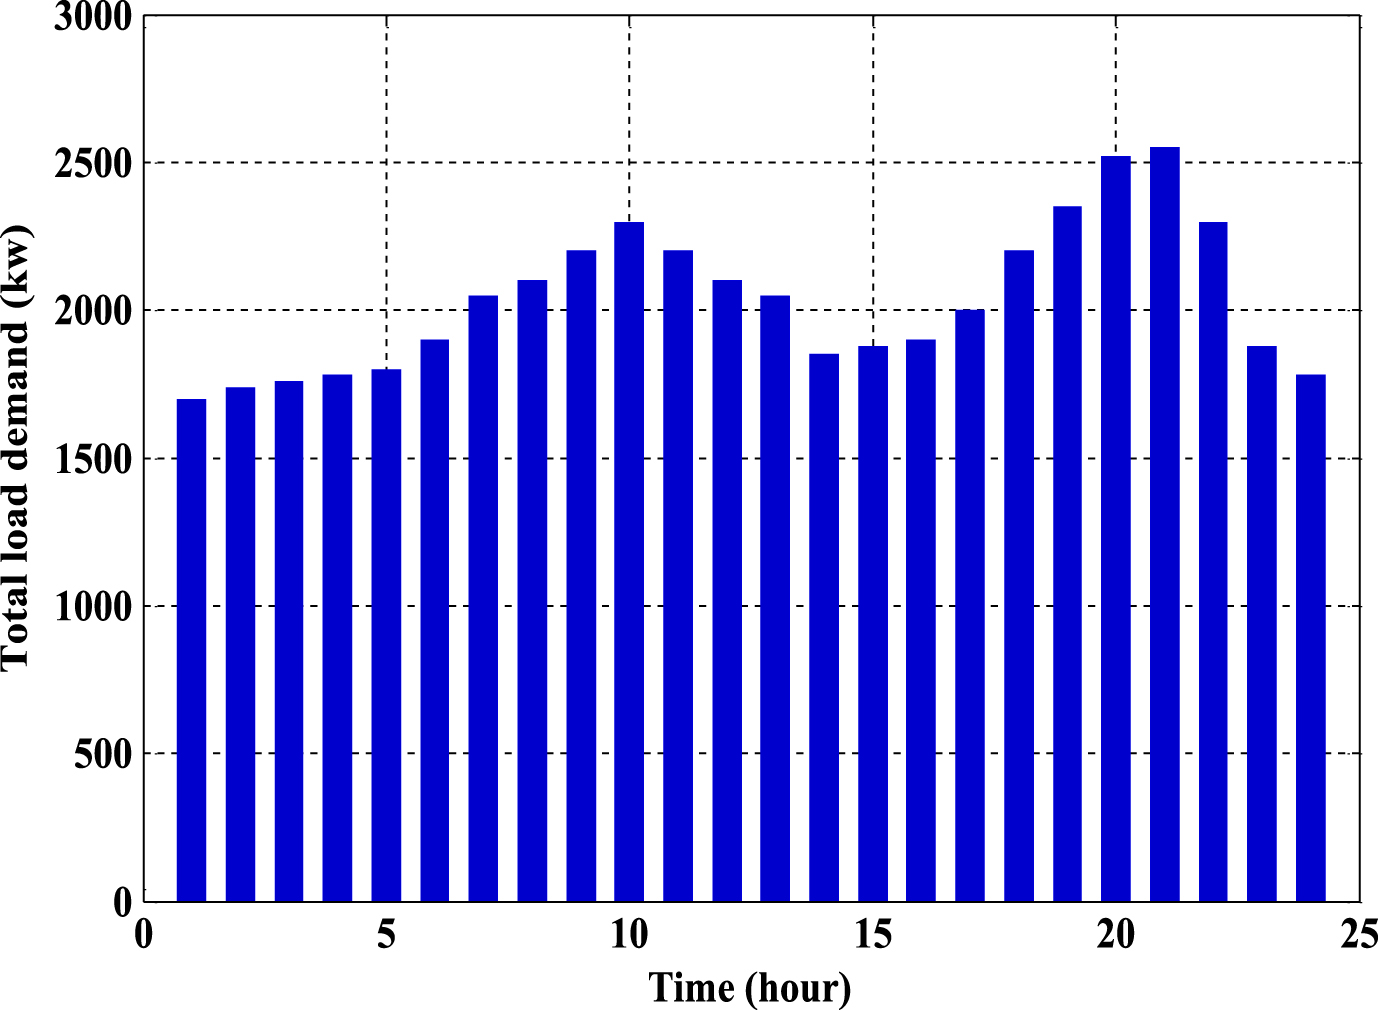
The daily load curve considered for the IEEE 69 bus test system for DFR analysis.
Comparison of cost function value for average, best and worst solutions using GA,PSO, SSO and MSSO methods (25 trials)
The best solution before and after DFR and states of the open switches in different single objective functions
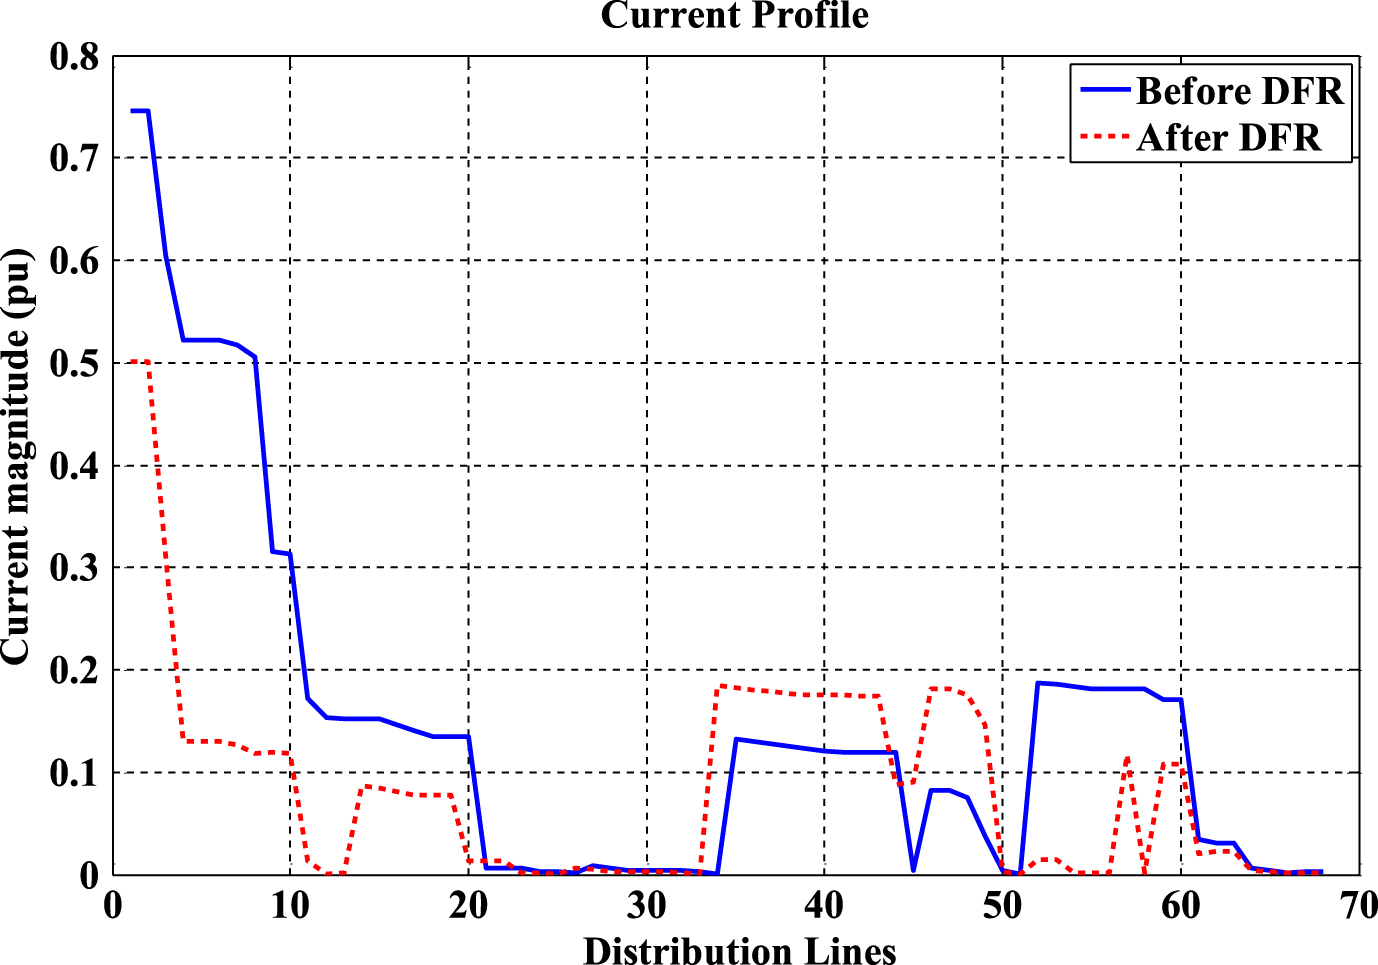
Comparison of distribution lines current magnitude before and after DFR.
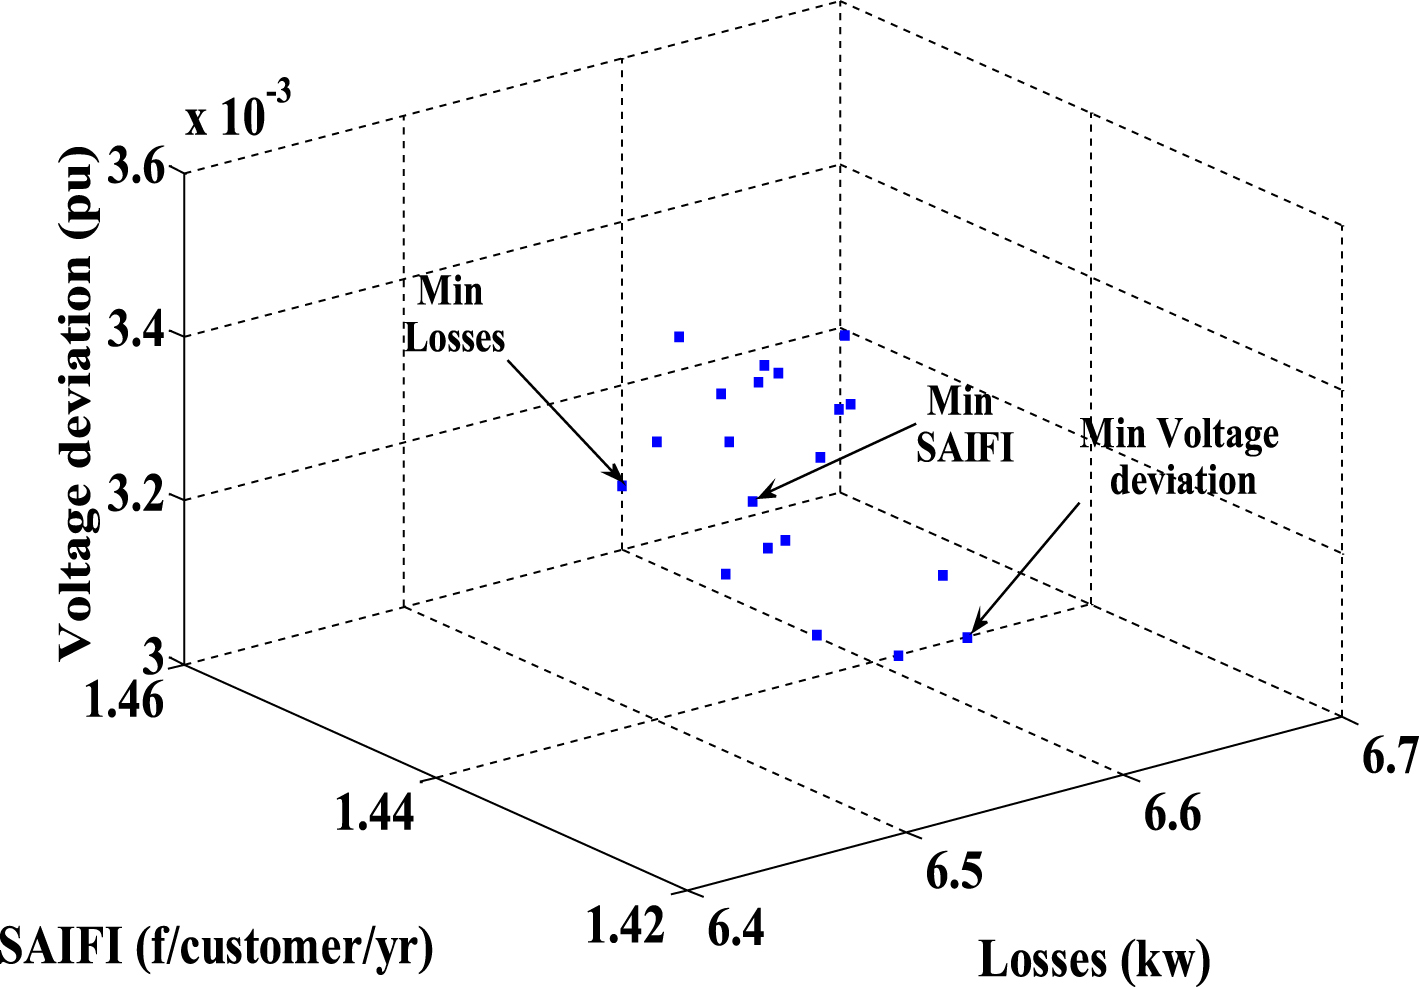
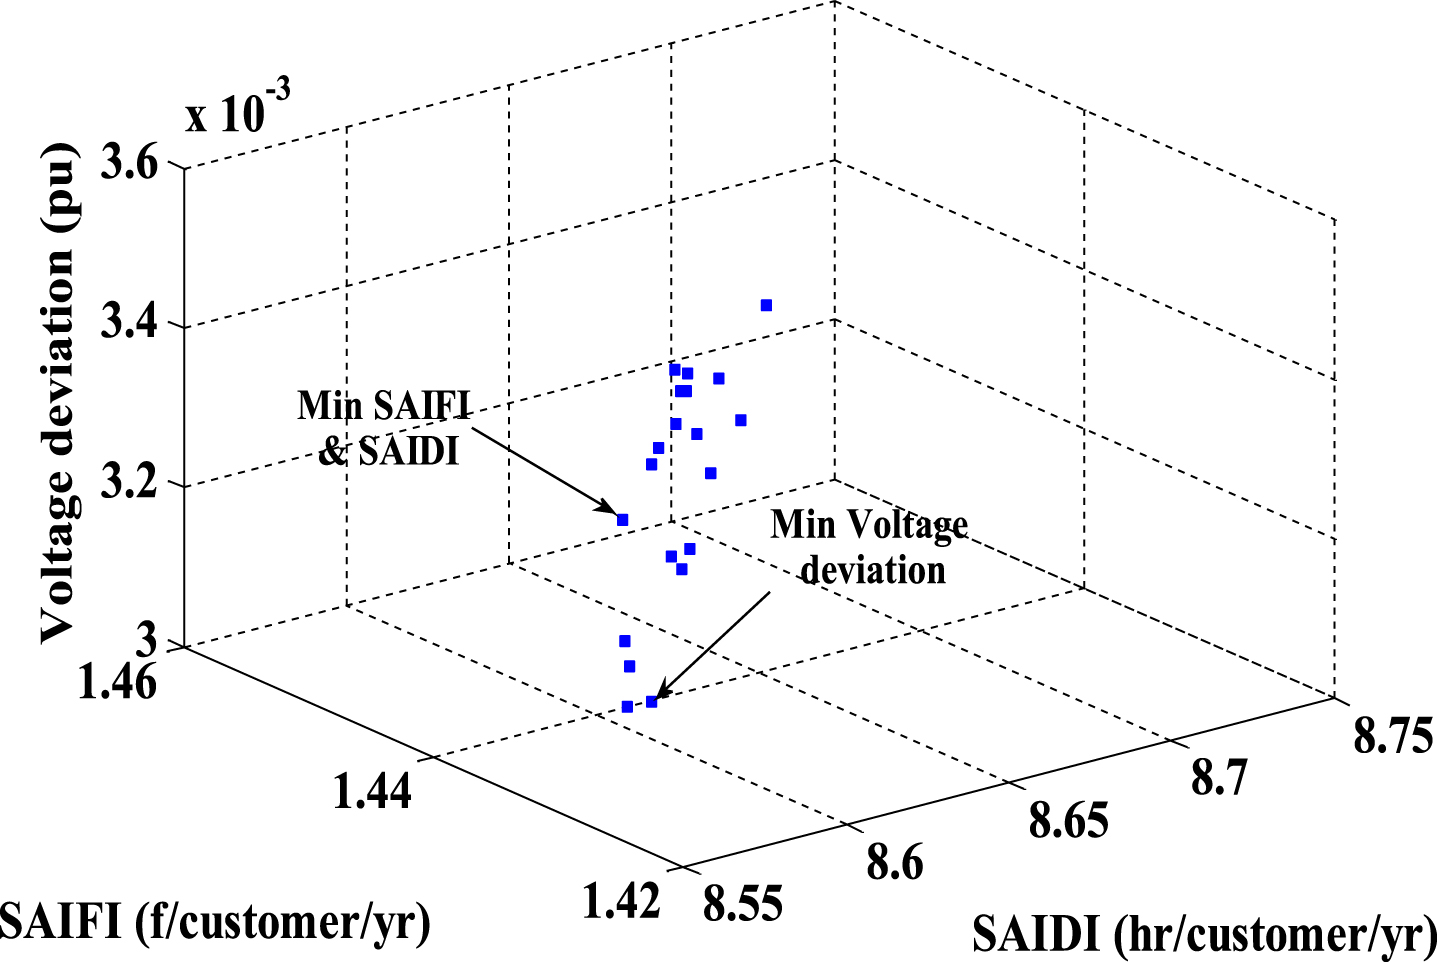
In order to achieve a suitable view and a clear understanding of the behavior of the objective functions, non-dominated solutions of different objective functions are presented in the form of 3-D plot in Figs. 4–7. With regard to this point that in this paper, the DFR problem is assumed to be in the form of four objective functions, in each of the mentioned Figures, one of the objective functions is neglected. For example, in Fig. 5, voltage deviation objective function has been eliminated and power losses, SAIFI and SAIDI are the remaining objective functions which have been simultaneously evaluated to each other and shown by the X - axis, Y - axis, Z - axis, respectively. Each point in these 3-D plots corresponds to a Pareto optimal point in the related set. These Pareto points are considered as the expected values and each of them cannot be dominated by any solution in the repository. As shown in Figs. 4– 7, the minimum value of the voltage deviation objective function is (1.4292, 8.5755, 0.0031); while the minimum value of the SAIFI and SAIDI has occurred in the point (1.4252, 8.5515, 0.0034).

3-D plot of the Pareto optimal solutions found by multi-objective optimization neglecting SAIFI.
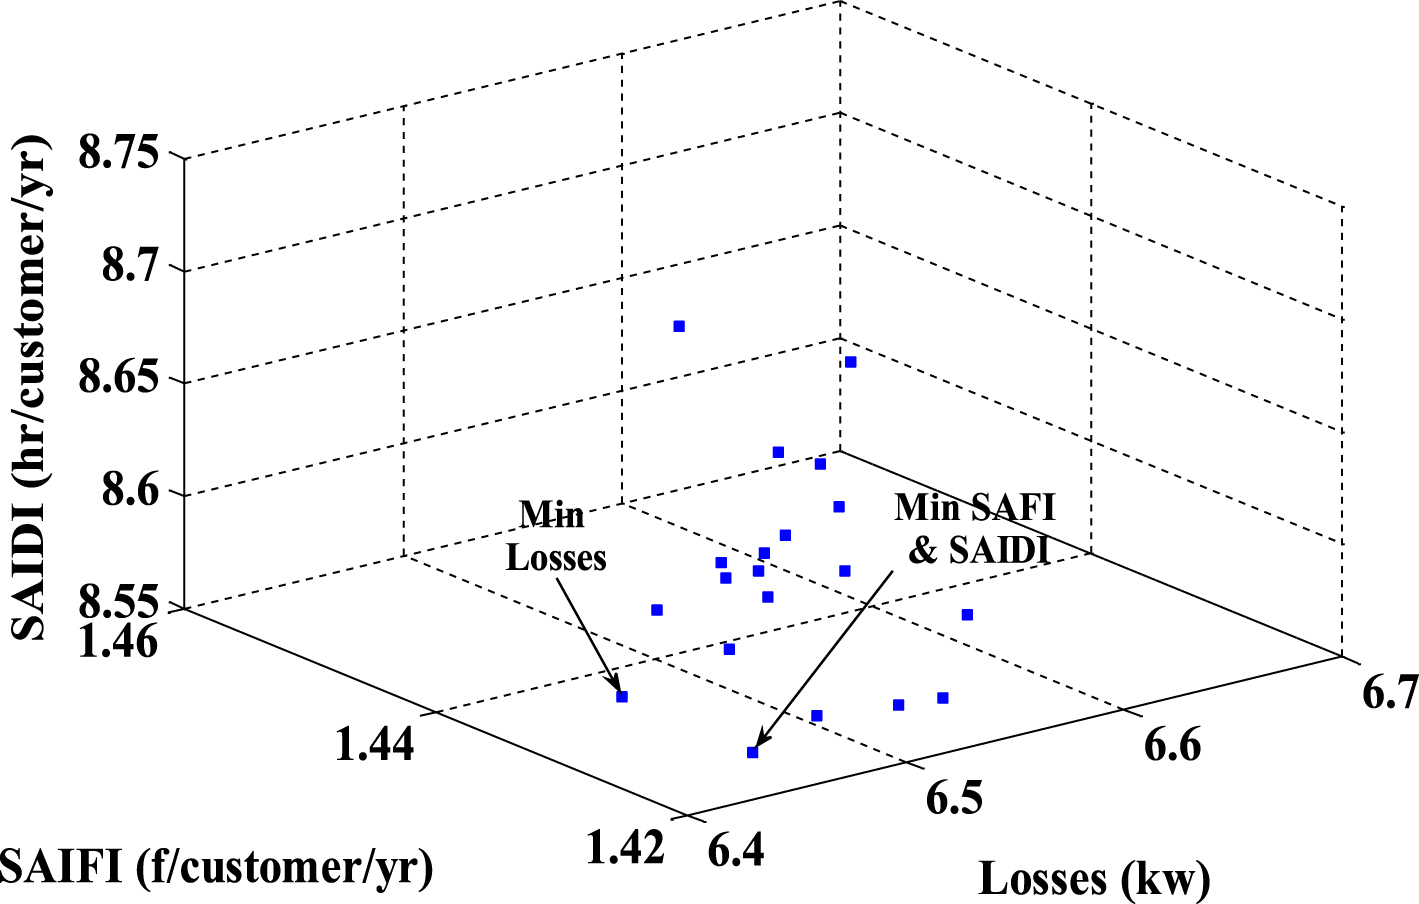
3-D plot of the Pareto optimal solutions found by multi-objective optimization neglecting voltage deviation.
3-D plot of the Pareto optimal solutions found by multi-objective optimization neglecting SAIDI.
3-D plot of the Pareto optimal solutions found by multi-objective optimization neglecting active power loss.
Also, the minimum values of the power losses (6.4236), SAIFI (1.4252), SAIDI (8.5515) and voltage deviation (0.0031) objective functions have happened in the 13th, 1h, 14th rows, respectively (written in the form of bold style). As shown in Table 5, the SAIFI and SAIDI objective functions exhibit the same behavior and their reduction and increase process are completely similar. This event shows the linear relationship between these two objective functions which verifies the proper selection of the proposed MSSO algorithm. On the other hand, volt/var control as the most important duty of the distribution network operator should be taken into account. Accordingly, determining an optimal schedule of the tap position of ULTC transformers and the ON/OFF status of the placed switched capacitors is the main purpose of the VVC problem.
The non-dominated solutions for the multi-objective DFR problem
Nevertheless, improving the voltage profile of feeders as well as power factor correction and minimizing the intended objective functions simultaneously are the other important factors which should be taken into consideration [33]. Table 6 shows the locations, ON/OFF status of the placed capacitors and tap position of ULTC transformers. Here, 7 capacitors are located with a predetermined capacity (Q c = 200 KVAR). As seen, the status of the placed capacitors at 54th, 62th, 20th, 21th, 24th buses is ON and the status of the placed capacitors at 61th, 21th buses is OFF, respectively.
ON/OFF states, location of capacitors and tap position of ULTC transformers
In order to better understand the performance of the proposed approach, voltage profile of feeders before and after DFR and capacitor placement is presented in Fig. 8. It can be observed that the voltage profile has enhanced 17.65% in average in all the buses of the network. Now, it can be said that mentioned problems should be aligned with the company’s strategic plan from distribution operator point of view. In fact, if strategies such as distribution automation are implemented in the operation and planning process, the developed plan would be more consistent with the strategic plan towards smart grid [3].

Magnitude voltage of buses before and after DFR from capacitor placement point of view.
The main goal of this paper is to inquire the role of DFR operation and switch placement planning strategies for the enhancement of system reliability. In this regard, based on the failure rate reduction approach in the two mentioned problems as well as SAIFI and SAIDI objective functions in DFR problem, the reliability of the system was evaluated. Moreover, in order to equipoise between utility oriented objective functions and system reliability goals, the conventional goals such as active power loss and voltage deviation from nominal are also chosen as objective functions in DFR problem. Also, a fuzzy clustering technique was used to control the size of repository which contains the Pareto optimal solutions. Nevertheless, in order to see the feasibility and superiority of the proposed methods, the 3-D plots of the objective functions were demonstrated. From another point of view, by selecting the locations and ON/OFF status of the switched capacitors as well as tap position of ULTC transformers, volt/var control was also investigated. The simulation results show that the DFR and switch placement as distribution automation operation and planning strategies can enhance the services of distribution networks especially from reliability perspective.