
Abstract
Lung abnormalities and respiratory diseases increase as side effects of urban life and development. Therefore, understanding the lung dynamics and its changes during the presence of abnormalities are critical in order to design more reliable tools for the early diagnosis and screening of lung pathology. The aim of this paper is to show the ability of recurrent fuzzy wavelet network (RFWN) to use as a reliable decomposer for lung sound (LS) signals. Since LSs have more dependency to their past states, we have considered recurrent connections in the model in which the ability of fuzzy structure in constructing a representative model was improved. Also, given the utility of wavelet neural network (WNN) as a powerful tool for time-frequency representation, we have adopted them in the consequent parts of the fuzzy rules. Furthermore, WNNs have the multi-resolution analysis (MRA) capability, and our proposed model exploits this characteristic to build an interpretable decomposition approach. Lung sound signals which captured by a multichannel data acquisition system decomposed by RFWN and then support vector machine utilized for classifying subjects using the features extracted from each decomposed line. As results show, a meaningful separability between healthy and non-healthy groups and also COPD and asthma diseases were achieved. In Addition, the recurrent structure could better model the time-dependent behavior of the lung sounds, and it improved the average accuracy of the classification. In particular, a classification accuracy of 95% was achieved using our proposed methodology when three different categorizes are considered.
Introduction
The auscultation of lung sounds is one of the most popular medical examination methods used for diagnosing many types of disorders. Lung sounds are produced by the movement of the air in the respiratory airways and their interactions which provide insight into the state of the lung in a non-invasive manner [1]. Lung sounds are nonlinear in nature; therefore, computerized analysis will enable us to reveal several aspects of them, such as their power spectrum, and hidden dynamic of respiratory system. In addition, computerized processing of lung sounds can assist in diagnosis and evaluation during the follow-up period and it can provide a relatively high facility for assessing the nature of LS complexities [2–4]. In the field of digital respiratory signal analysis, a couple of investigations have been undertaken. In this way, conventional methods such as the auto-regressive (AR) and multivariate auto-regressive (MAR) models [5, 6] are adopted to sift LSs. In addition, the mel-frequency cepstral coefficient (MFCC) [7, 8] approach and those relying on the time-frequency transforms [9, 10] are commonly applied for feature extraction. The nonlinear nature of lung sounds propelled researchers to use nonlinear analysis, dynamic modeling, and fractal analysis which has been proven to be useful for extraction of respiratory sound’s characteristics [11–13].
In the recent studies, the temporal changes of respiratory signals are considered to build a representative model of the signals. The most commonly applied computational intelligence (CI) approaches are neural networks, fuzzy systems, and wavelet networks in which the residual error of the input-output pairs are minimized [4, 15]. Beside the above approaches, there are some other studies focused on the modelling of the input signals by the theory of multiresolution analysis [16–18]. Among the aforementioned CI tools, the fuzzy rule-based (FRB) systems, which use the expert knowledge to create a human-like reasoning, have more consistency with the problem under study. Furthermore, the general approximation capability of fuzzy systems makes them powerful tools for modelling arbitrary non-linear functions.
The FRBs consist of a set of IF-THEN rules in which IF-part and THEN-part represent the antecedent (or the premise) and the consequence (or the conclusion) of each rule, respectively. By considering a prescribed function in the rule’s consequent parts, Takagi-Sugeno-Kang (TSK) fuzzy model have been introduced. A couple of studies have been combined different types of functions including quadratic functions [19, 20], functional link neural network [21, 22], and wavelet neural networks [23] with the FRBs. In the same way, the combination of fuzzy systems and wavelet theory has led to a number of new techniques: wavelet networks [14, 25] and fuzzy wavelet systems [18, 27]. Chunshien Li et al. [28] has presented a soft computing system based on fuzzy set theory and multiresolution analysis. Another work from Ho et al. [18] has proposed a fuzzy wavelet network inspired by the theory of multiresolution analysis. In addition, in this issue, some similar structures including feed forward and recurrent topologies have been proposed [23, 29–31].
The aforementioned systems have mostly been used in the time-series prediction field and control problems, and there have been rarely studies utilized them in the classification task [4, 14]. Specifically, regarding the fuzzy wavelet topology, it can be found a few studies in which the time-frequency characteristics of the wavelets are adopted for distinguishing the input patterns. In this study, the advantages of WNNs are exploited to achieve a novel fuzzy structures allowing the extraction of the distinctive information from the respiratory signals. Since, the FRBs can estimate an arbitrary function through the aggregation of the fuzzy rules, it can be possible to utilize such systems as a decomposer and the output of each fuzzy rule can be considered as a component of the input patterns. In fact, first recorded multichannel LS is modelled by the proposed fuzzy wavelet structure, then by removing the output node, the input pattern could be decomposed into a number of components. Furthermore, by controlling the scale and translation parameters of the WNNs, our proposed model exploits the multi resolution analysis (MRA) characteristics to build an interpretable decomposer structure. Also, in order to improve the reconstruction capability of the model, a recurrent structure of the model named recurrent fuzzy wavelet network (RFWN) approach is introduced.
In our study, we have considered three types of signals obtained from healthy subjects and those of suffering from asthma and COPD which are two of the most common lung diseases. The respiratory signals recorded from each subject are modelled using the proposed FWN and RFWN. Then, the components of each signal associated with each fuzzy rule are obtained, and feature vectors including statistical and nonlinear attributes are extracted for the classification task.
The rest of this paper is organized as follows: In Section 2, the detailed structure of our fuzzy wavelet network and its learning procedure are described. Then, the recurrent topology of the network is presented in Section 3. Our methodology, including the data acquisition protocol and the procedure followed to construct the feature vectors from the decomposed lines, is described in Section 4. Sections 5 and 6 are devoted to the results and discussion parts, respectively. Finally, the relevant conclusions are presented in Section 7.
Fuzzy wavelet network
A standard TSK fuzzy model can be stated by the following expression:
where,
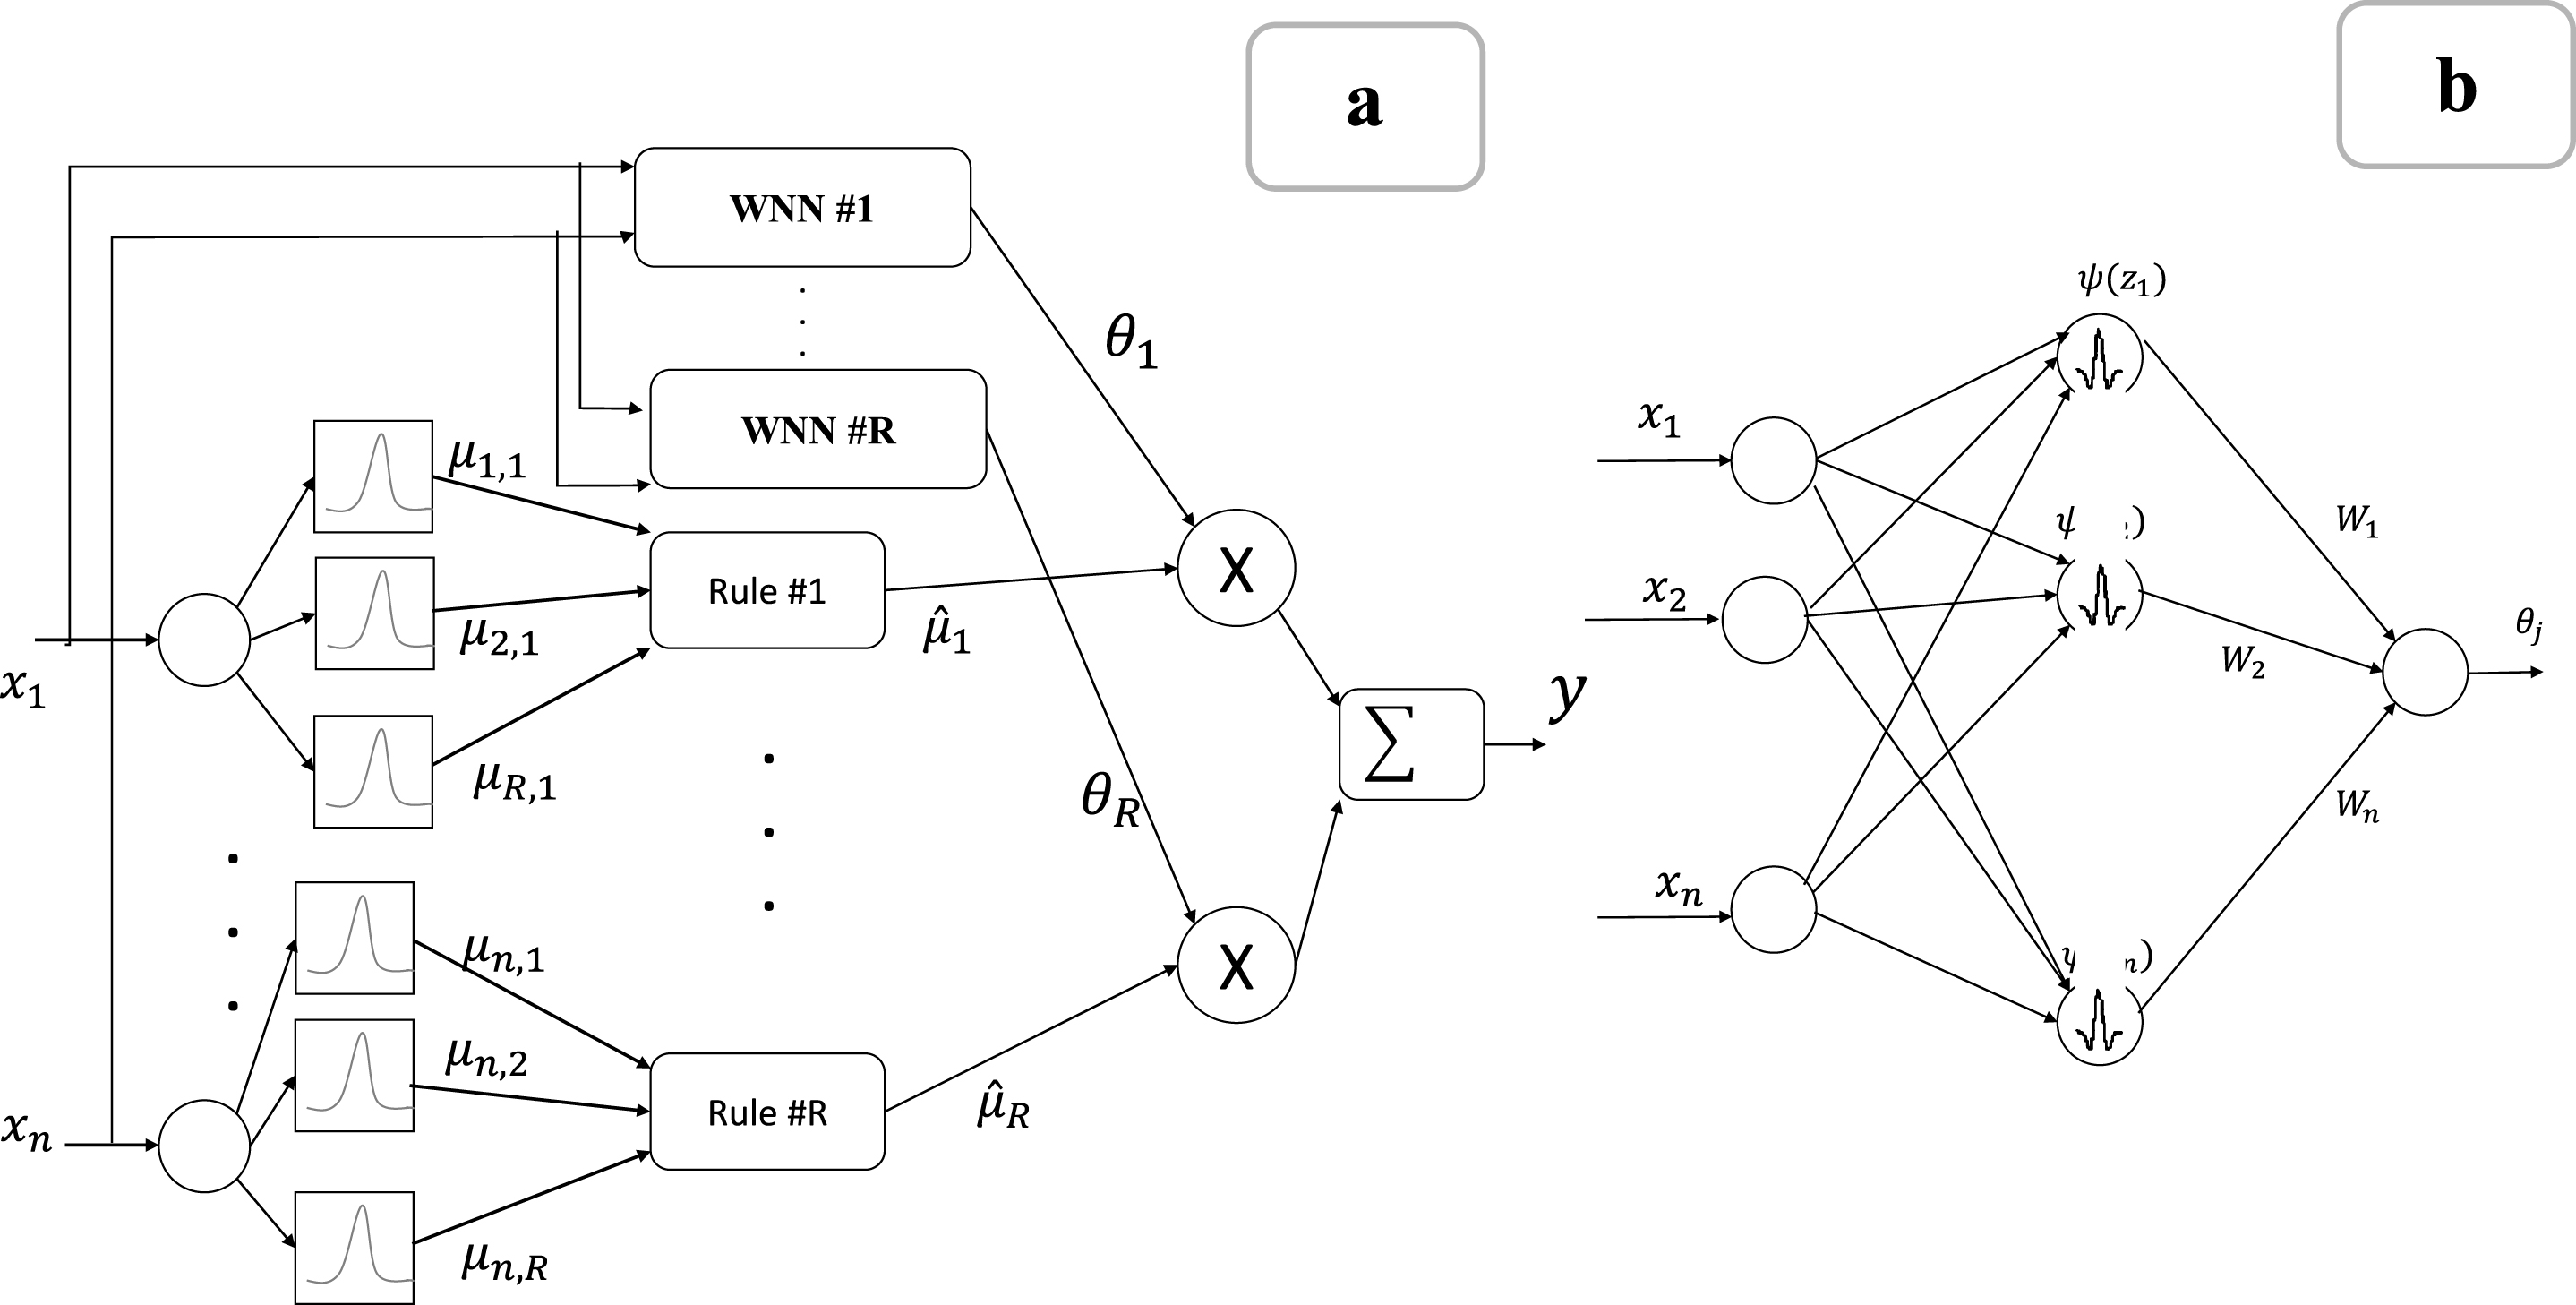
General structure of FWN. a) A rule based fuzzy network,
In order to take the advantages of the wavelet multi resolution analysis (MRA), in our methodology we set a unique translation parameter ki,j for each rule and a set of dyadic discrete numbers for the scale parameter. Therefore, the fuzzy rule based model is converted to the following statement:
where, L determines the number of translations. Even though, it might degrade the performance of the network in construction of a well representative model, it can influence the decomposition task of the fuzzy network because each WNN is related to a specific frequency component. With this regard, the structure of the WNN is reshaped to Fig. 2.
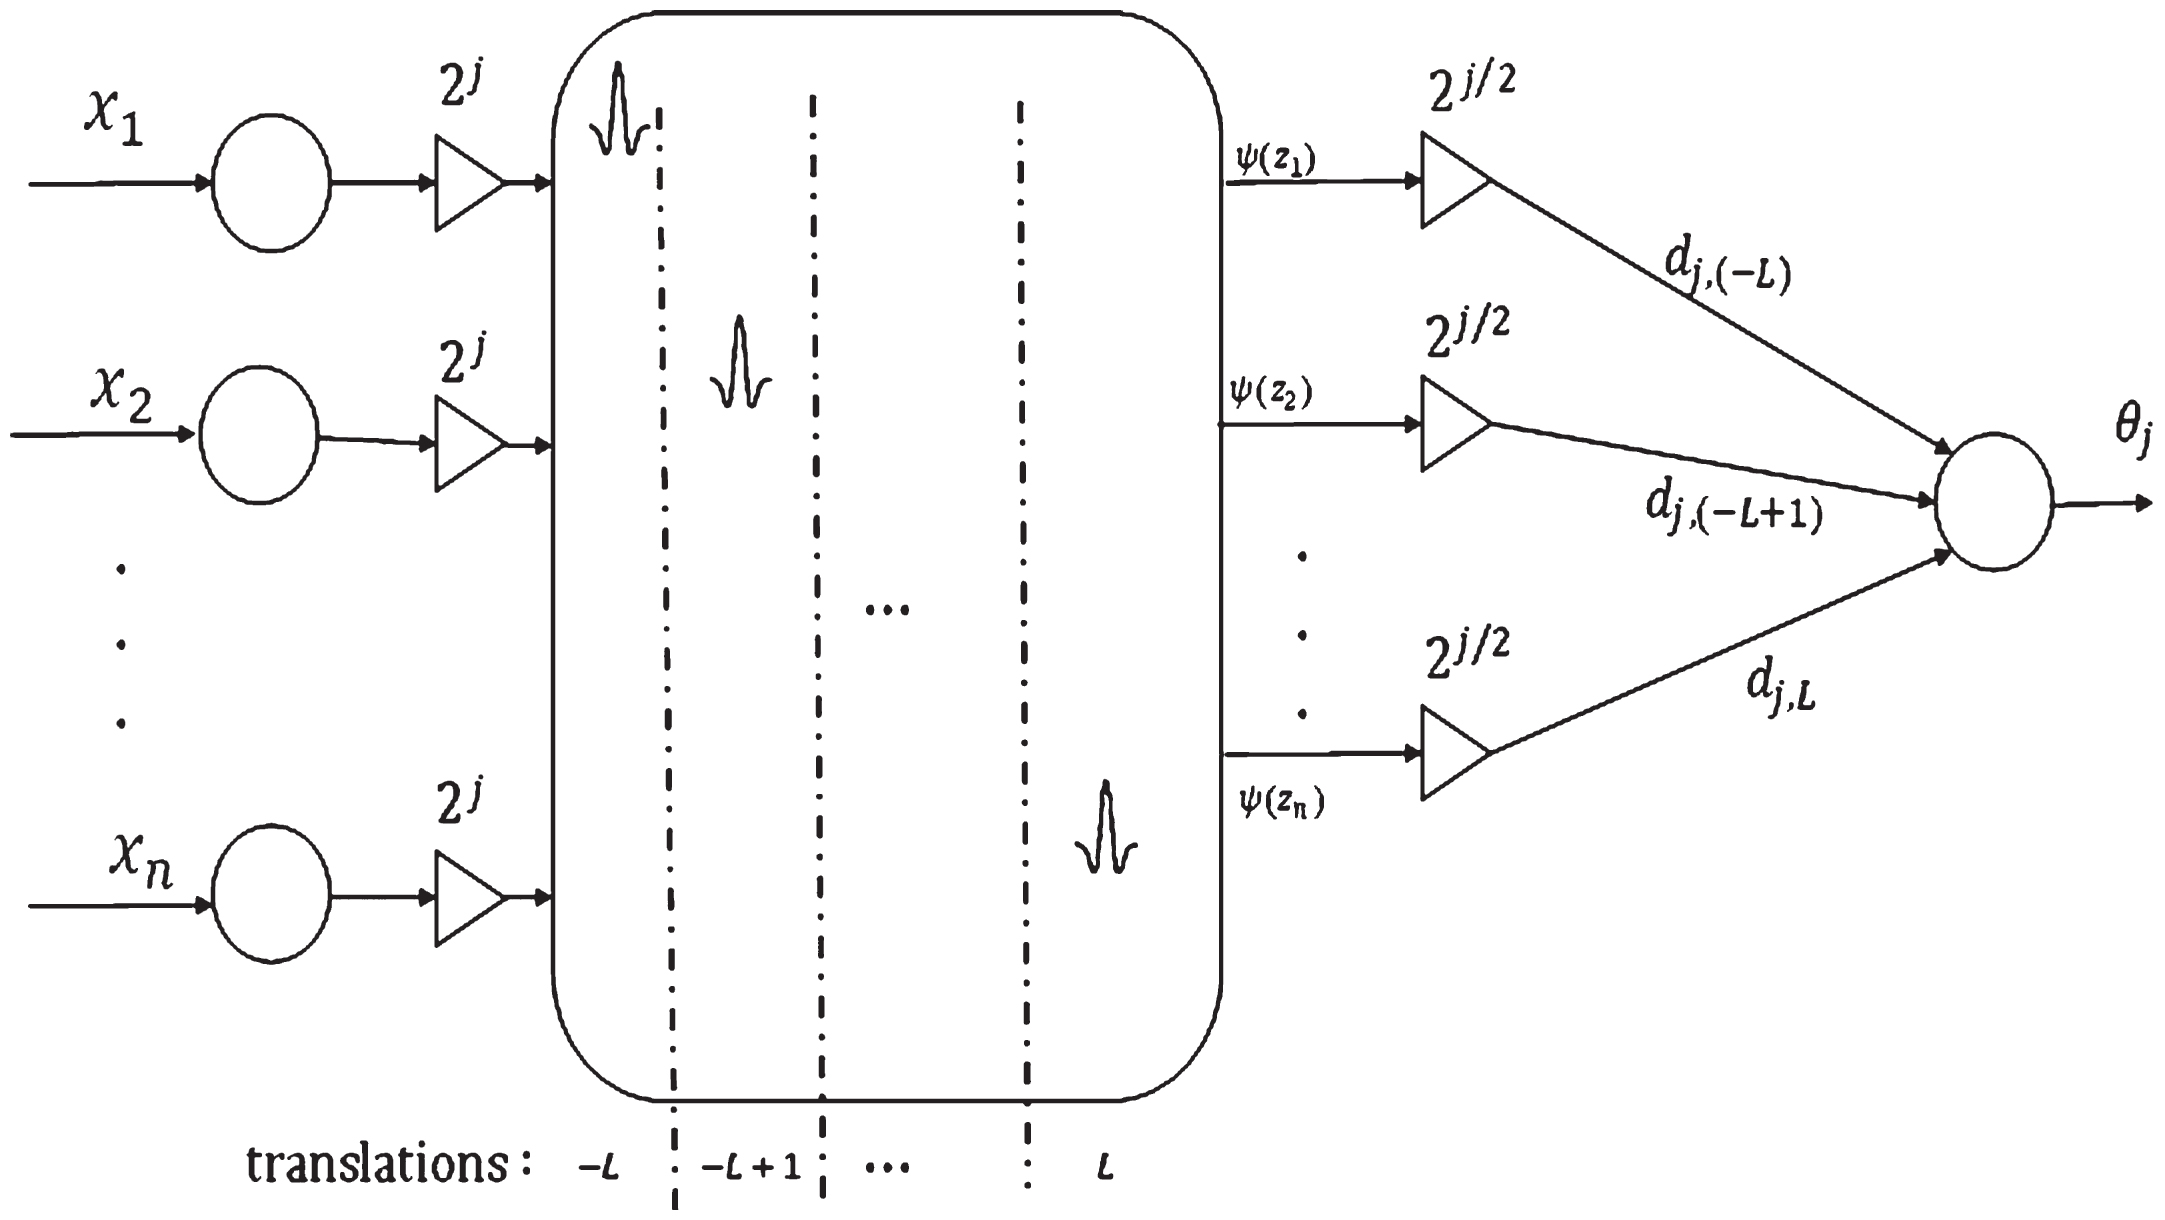
Consequent part of the j-th rule. In order to generate an interpretable decomposition, scale and translations are selected based on the wavelet theory and won’t be learned. The other parameters are learned based on the training data.
As can be seen in Fig. 2, each rule is being the summation of 2L + 1 terms. Also, the scale parameter is changed with the rule number in each rule. The total free unknown parameter number is 2nR + R (2L + 1), where R is the number of rules. In a similar structure used by Ho et al. [18], the translation parameters are tuned. However, here translation parameters are not tuned and they are selected integers for taking the advantages of the rigorous approximation theory of wavelet basis function expansion. By applying fuzzy product inference engine, singleton fuzzifier, center average defuzzifier, and Gaussian membership functions, the output becomes:
The free parameters of this structure are membership function’s centers cj,i, standard deviations σj,i, and wavelet expansion coefficients of dj,k. The translation parameters sets are taken from -L to +L. When the translation parameters are increased too much, the approximation accuracy is changed very slowly. However, very good performance can be obtained with the limited number of translation parameters. In this work, our task is to design the fuzzy wavelet system y (x) such that the matching error
The lung sounds have time dependent behavior which this characteristic can more easily be modelled by the recurrent network structures [4, 15]. Since the basis functions of WNN are orthogonal, the WNN provides a unique and efficient representation for the given functions. However, the WNN has a disadvantage that it can be used only for static problems due to its feedforward network structure. That is, the WNN is not the most suitable in solving temporal problems like predicting the behaviors of complex chaotic systems. Therefore, we employed a recurrent wavelet neural network (RWNN), which combines the properties of attractor dynamics of recurrent neural network with the wavelet network. There are two main categorizes of recurrent structures as local and global feedbacks. Some of the fuzzy structures such as, TSK type recurrent fuzzy network (TRFN) [34], the high-order recurrent neuron-fuzzy system (HO-RNFS) [35], and the recurrent self-organizing neural fuzzy inference network (RSONFIN) [36], have been proposed as global feedback structures. Some other fuzzy neural networks using only local feedbacks have also been proposed [27, 37]. By considering the success of the wavelet networks local feedbacks, in our model the effect of the placing local feedbacks in the consequent parts of the fuzzy rules are evaluated. In other words, for each training sample an extra input data corresponding to the previous output of each wavelet network is came back. So, the output of each fuzzy rule is stated as follows:
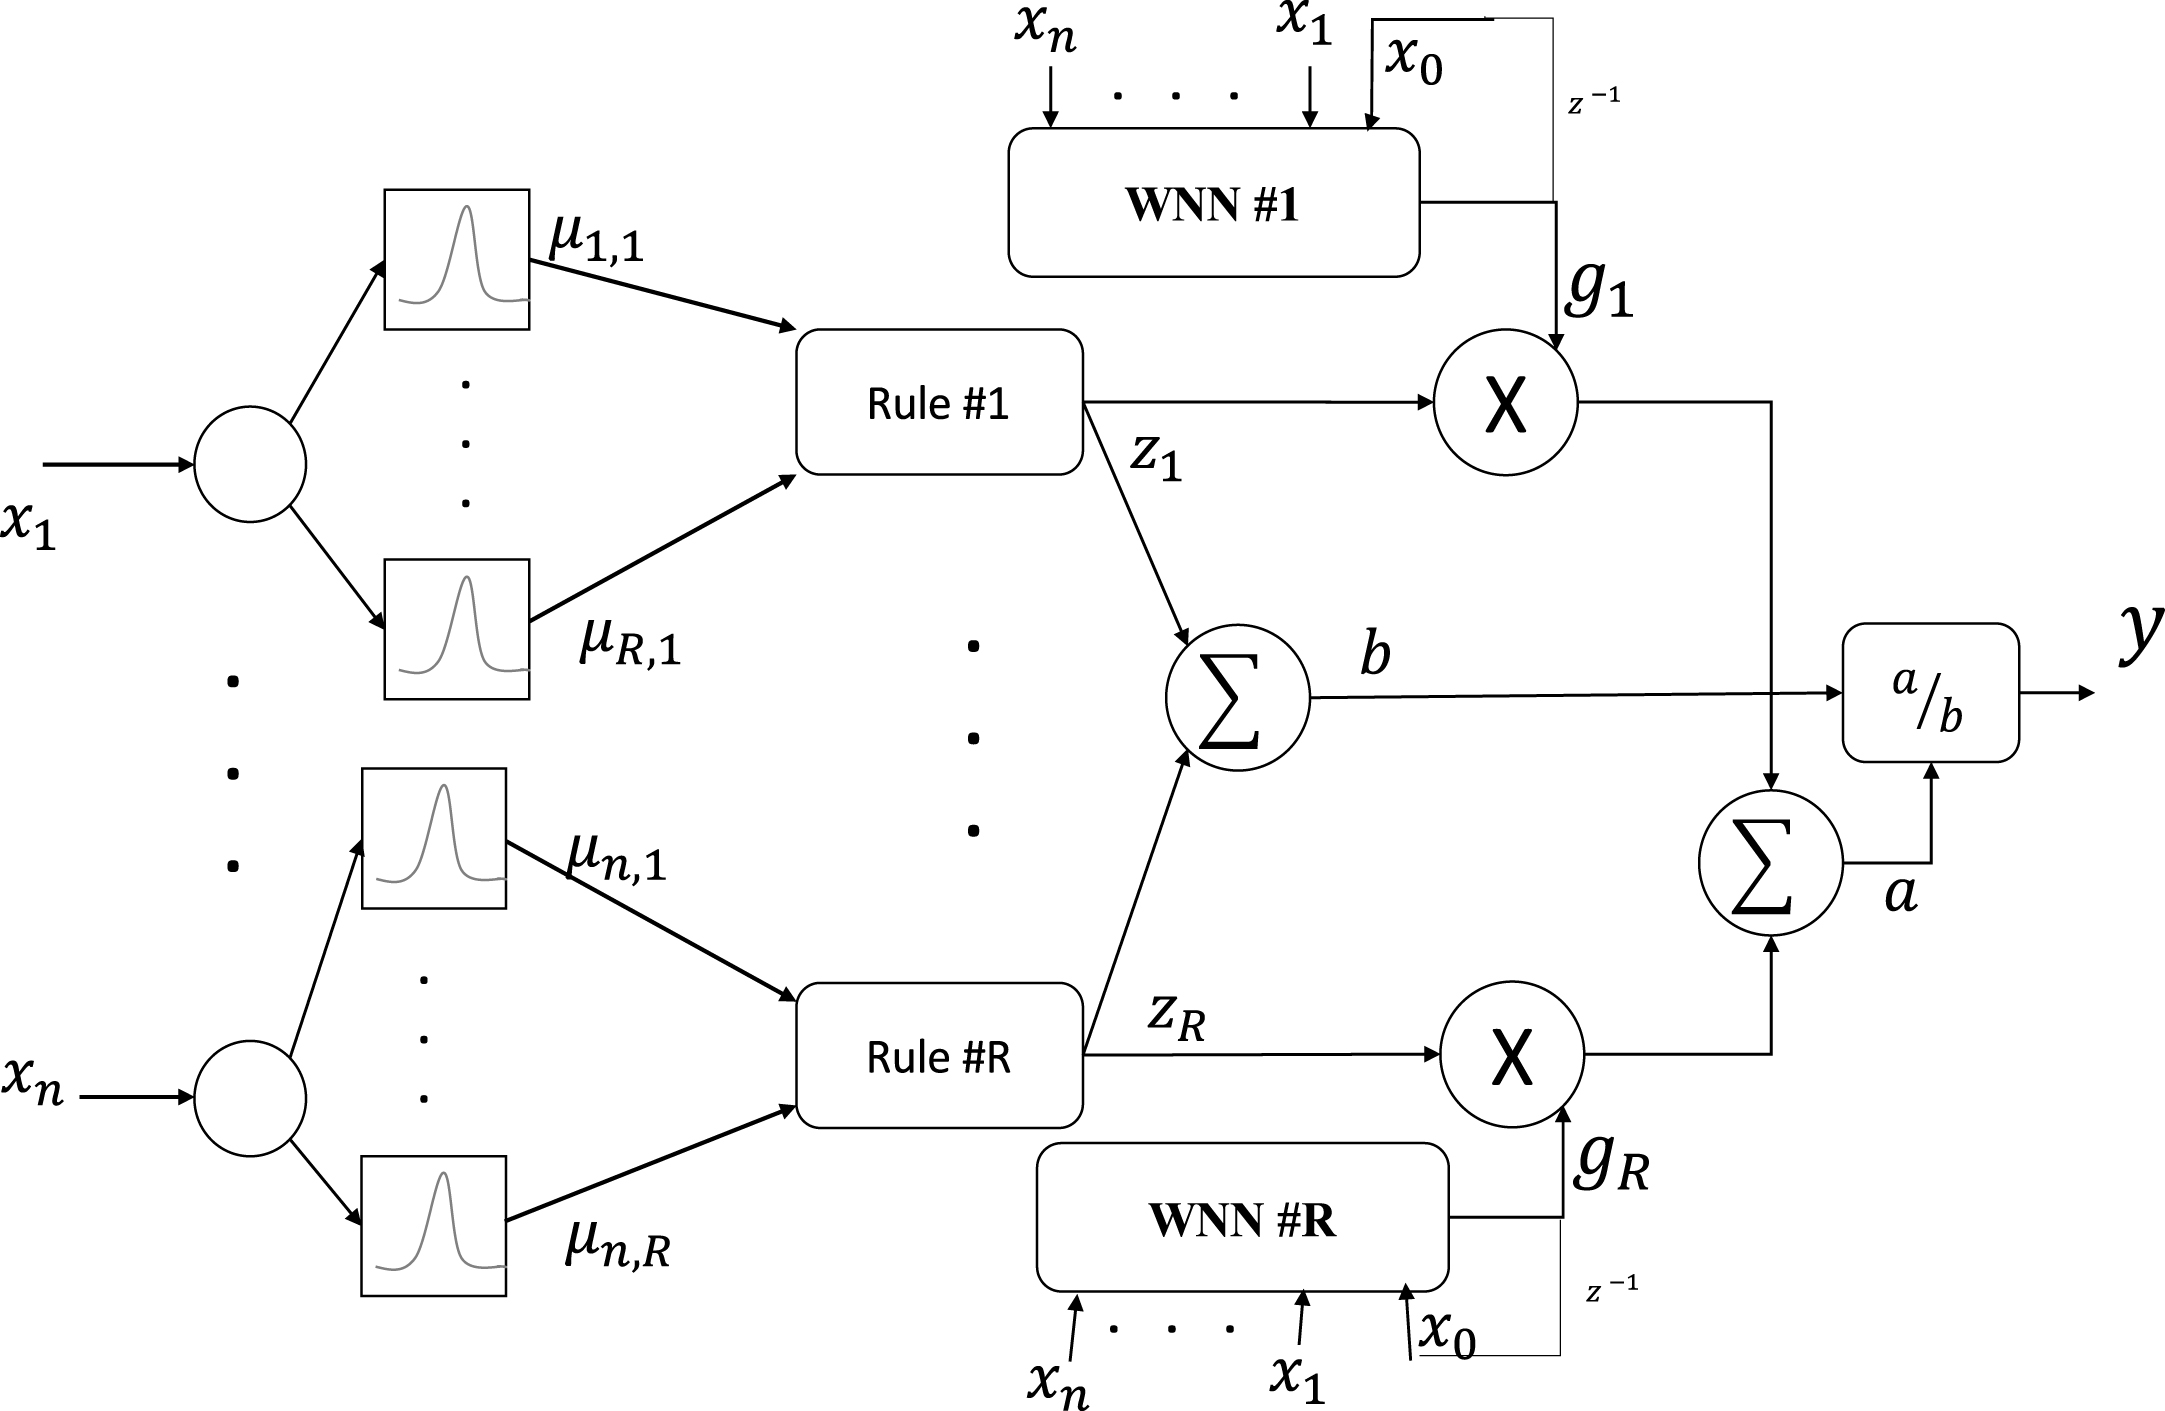
RFWN structure. The output of the nodes are labeled based on Equations 9–13.
After training the RFWN, the structure can be used as a decomposer. In this case, as can be seen in Fig. 4, same signal segment applied to the trained network, and y1 to y R outcome the decomposed signals. In the other words, by removing the node placed in the latest layer, we have eliminated a simple summation (aggregation) operator and each line corresponding to a distinct fuzzy subspace can be analyzed separately. Therefore, we have R decomposed line related to each WWN. In the next step, statistical and chaotic features are extracted from the decomposed signals and they applied to a classifier in order to obtain the ability of this decomposer in separation between healthy and non-healthy lung sounds.

Detailed structure of RFWND. The output node of the learned RFWN is removed and each rule’s output is considered as a component of the decomposition.
Lung sounds data acquisition
Signals were recorded from 40 healthy subjects (20–40 years old) and 40 patients suffering from COPD or asthma (25–55 years old) at the Department of Pneumology in Sharitai Hospital. All subjects gave informed consent prior to sound acquisition process. Body-mass indices of the subjects ranged from 19 to 33kg/m2. Data was recorded in a regular room, using a 6-channel respiratory sound acquisition device, which designed and implemented in the bioinstrumentation and biological signal processing Laboratory, Amirkabir University of Technology. The system was comprised of 6 electret microphones (Sony ECM-44BPT) fitted into conical cavities. The cavities attached on a wearable jacket, which fit them at positions on the posterior chest wall (3 microphones on the right and 3 on the left, aligned symmetrically with respect to the spine). Figure 5 depicts the location of the sensor array attached on the posterior thoracic surface of the subjects [4, 38].

Sensor array attached on the posterior thoracic. The microphones were aligned symmetrically with respect to the spine [4].
We use Littmann master classic II type chest piece as cavity in our acoustical system which recommended by pulmonologists and has outstanding frequency response in comparison with the other types of chest piece as well as stay in acceptable frame-work; also, frequency response of microphones is flat between 100 and 5 KHz [38]. An analog filter unit drived microphone and filtered output signals, which was then digitized at 20 KHz by a data acquisition device (AD Instruments, PowerLab) and transferred to the computer using an interface developed in MatLab environment.
An example of two successive respiratory cycles from a healthy subject acquired at ch5 is shown in Fig. 6. As can be seen, the amplitude of LS in the inspiratory phase is higher in comparison with the expiratory phase. On the other hand, Fig. 6(b) shows the LS from a patient on the same channel where spikes occur in the inspiratory phase. The zoomed-in version of the patient’s LS containing the adventitious sound can be seen in Fig. 6(c).
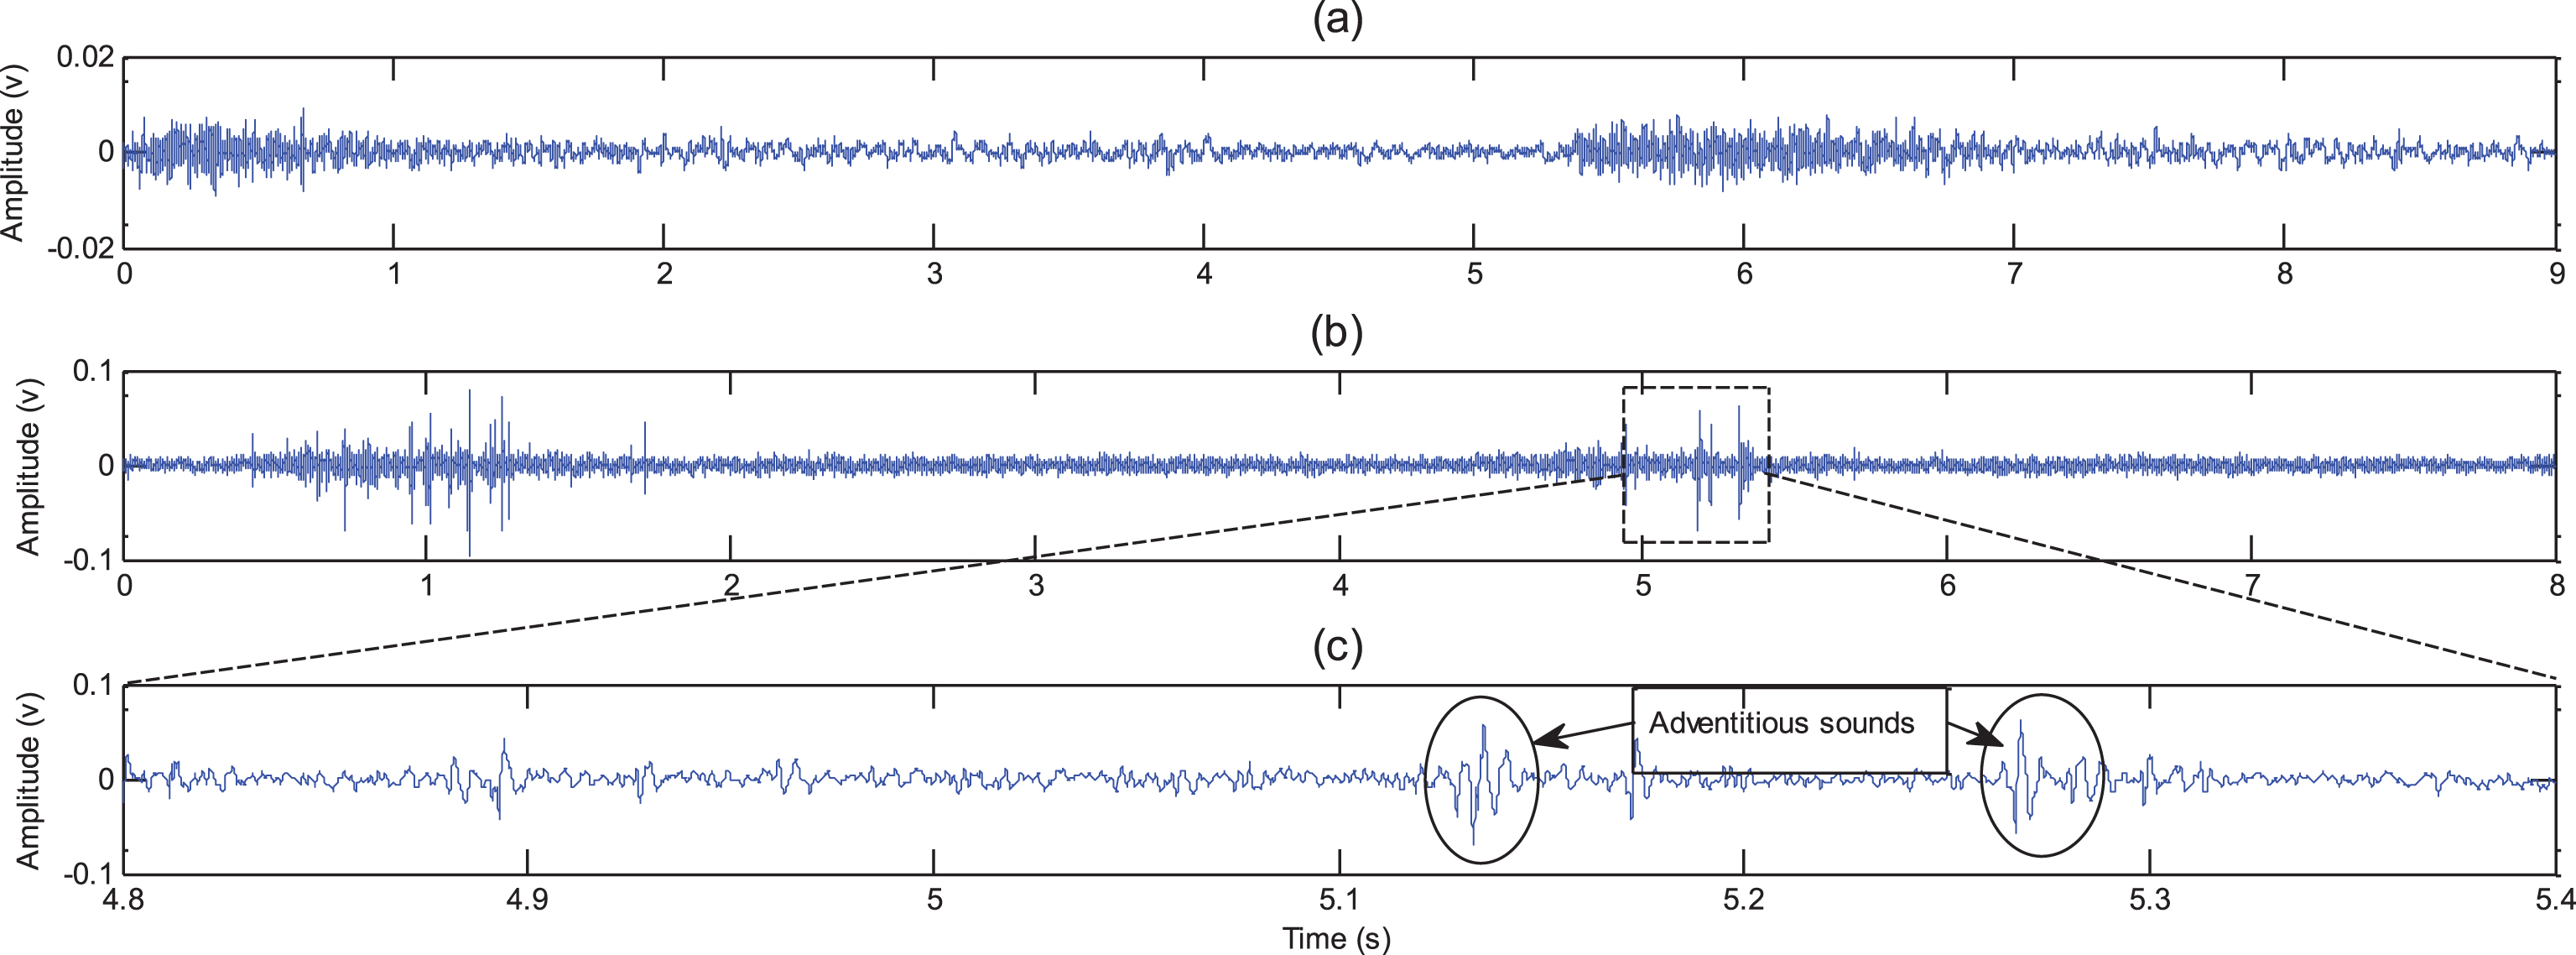
Recorded LS at location ch5. (a) A healthy subject (b) A COPD subject, and (c) Time-expanded waveform of the patient. The adventitious sounds corresponding to a specific disease is shown here [4].
The main advantage of multi-channel lung sound recording method lies in its power to cover the whole lung and to capture all possible deformations in respiratory sounds in a single recording. Moreover, it enabled us to determine the location of abnormalities. Subjects were asked to stay calm and relaxed and were instructed to breathe in a specific normal rate in order to prevent turbulent flow and control flow rate. Each record contained 3 inhales and exhales with 1 second pause after each section.
Pre-processing
Before starting the procedure of LS modelling, we had segmented them into the shorter time intervals. According to the sample rate and the characteristics of LS, 4000 and 10000-point segments with 25% overlap are selected, then segmented samples were normalized. The segment length was chosen based on the time duration of the adventitious sounds which are the symptoms of the abnormalities, in order to be assured that each segment can contain a complete event [4]. Totally, we extracted 1000 segments from healthy subject’s LS and 1000 segments from non-healthy subjects. Then, each segment is modelled by the proposed RFWN. In order to model the temporal sequences of each segment it is necessary to have its behavior in the reconstructed state space (RSS). Based on Taken’s theorem, the RSS of a time series should be generated by its estimated embedding dimension, m and delay τ. Therefore, points of the time series are embedded in another space with dimension m as:
There is no single criteria to decide whether given signals are chaotic; however, chaotic behavior of the signals can be determined through some features. The chaotic indices used in this research will be introduced in the following subsections.
Largest Lyapunov Exponent
The method of Lyapunov characteristic exponents serves as a useful tool to quantify chaos, and specially, to measure the rates of convergence or divergence of the nearby trajectories. In other words, Lyapunov exponent is a quantitative measure of the dynamics of trajectory evolution in the state space. Negative values of Lyapunov exponents mean that the two trajectories are drawn closer to each other whereas positive values illustrate divergence. Therefore, positive Lyapunov exponent can be used as one of the chaos indicators [38].
Mutual Information
Mutual information is the quantity that measures how much one random variable tells us about another. A high mutual information value indicates a large reduction in uncertainty, whereas low mutual information indicates a small reduction in uncertainty and zero mutual information of two random variables means that variables are independent [39].
Correlation Dimension
As the most widely used quantitative parameter to describe attractors, correlation dimension is a measure of the complexity of the system related with its degrees of freedom. For a chaotic system, the correlation dimension at first increases with embedding dimension. Finally, it asymptotically approaches to a true value. Moreover, as much as signal approaches to chaotic condition, its correlation dimension will be greater.
Randomness features
Variance to Mean Ratio (VMR)
The dispersion index or variance to mean ratio (VMR) is a normalized measure of the dispersion of a probability distribution. The geometric distribution and the negative binomial distribution have VMR > 1 while the binomial distribution has VMR < 1, and the constant random variable has VMR = 0. Therefore, as much as VMR is closer to one, related time series has greater randomness [39].
Autocorrelation
X1, …, X
N
are independent and identically distributed random variables. Hence, the 95% confidence limit for the correlogram can be plotted at
The classification scheme
The feature vectors (FV) extracted from the model which served as the chaotic and randomness features related to the decomposed lines are fed to a classifier. As a common classification technique, SVM is a very popular machine learning algorithm which aims to find the optimally placed hyper planes to discriminate the classes from each other.
The closest samples to these hyper planes are called support vectors, and the solution is defined in terms of this subset of samples which limits the complexity of the problem. We have used SVM as our classifier without any optimization. Also, we separated input data into two groups, test and train. To achieve a reliable result we randomly extracted 20% of sample data as the test and used the remaining samples as the train. The aim of the classifier is to build a predictive model through features which capable of distinguishing between compared groups and show the ability of decomposer in compare with the other decomposing methods.
Figure 7 shows the flow chart of the training and decision making system. First the recurrent fuzzy model receives input signal and allows RFWN to be trained, then model coefficients are transferred to the same structure and input signal apply to it for decomposition. A distinctive diagram similar to Fig. 7 is considered for each channel and the input segment is categorized in all of the 6 recording channels. The given time series segment is considered as healthy if at least three out of six channels labeled it as healthy, otherwise, it is categorized to the non-healthygroup.
Finally, in order to make a decision about the subjects group, all of its segments labels are counted and it’s most repeated decisions is considered for the subject.
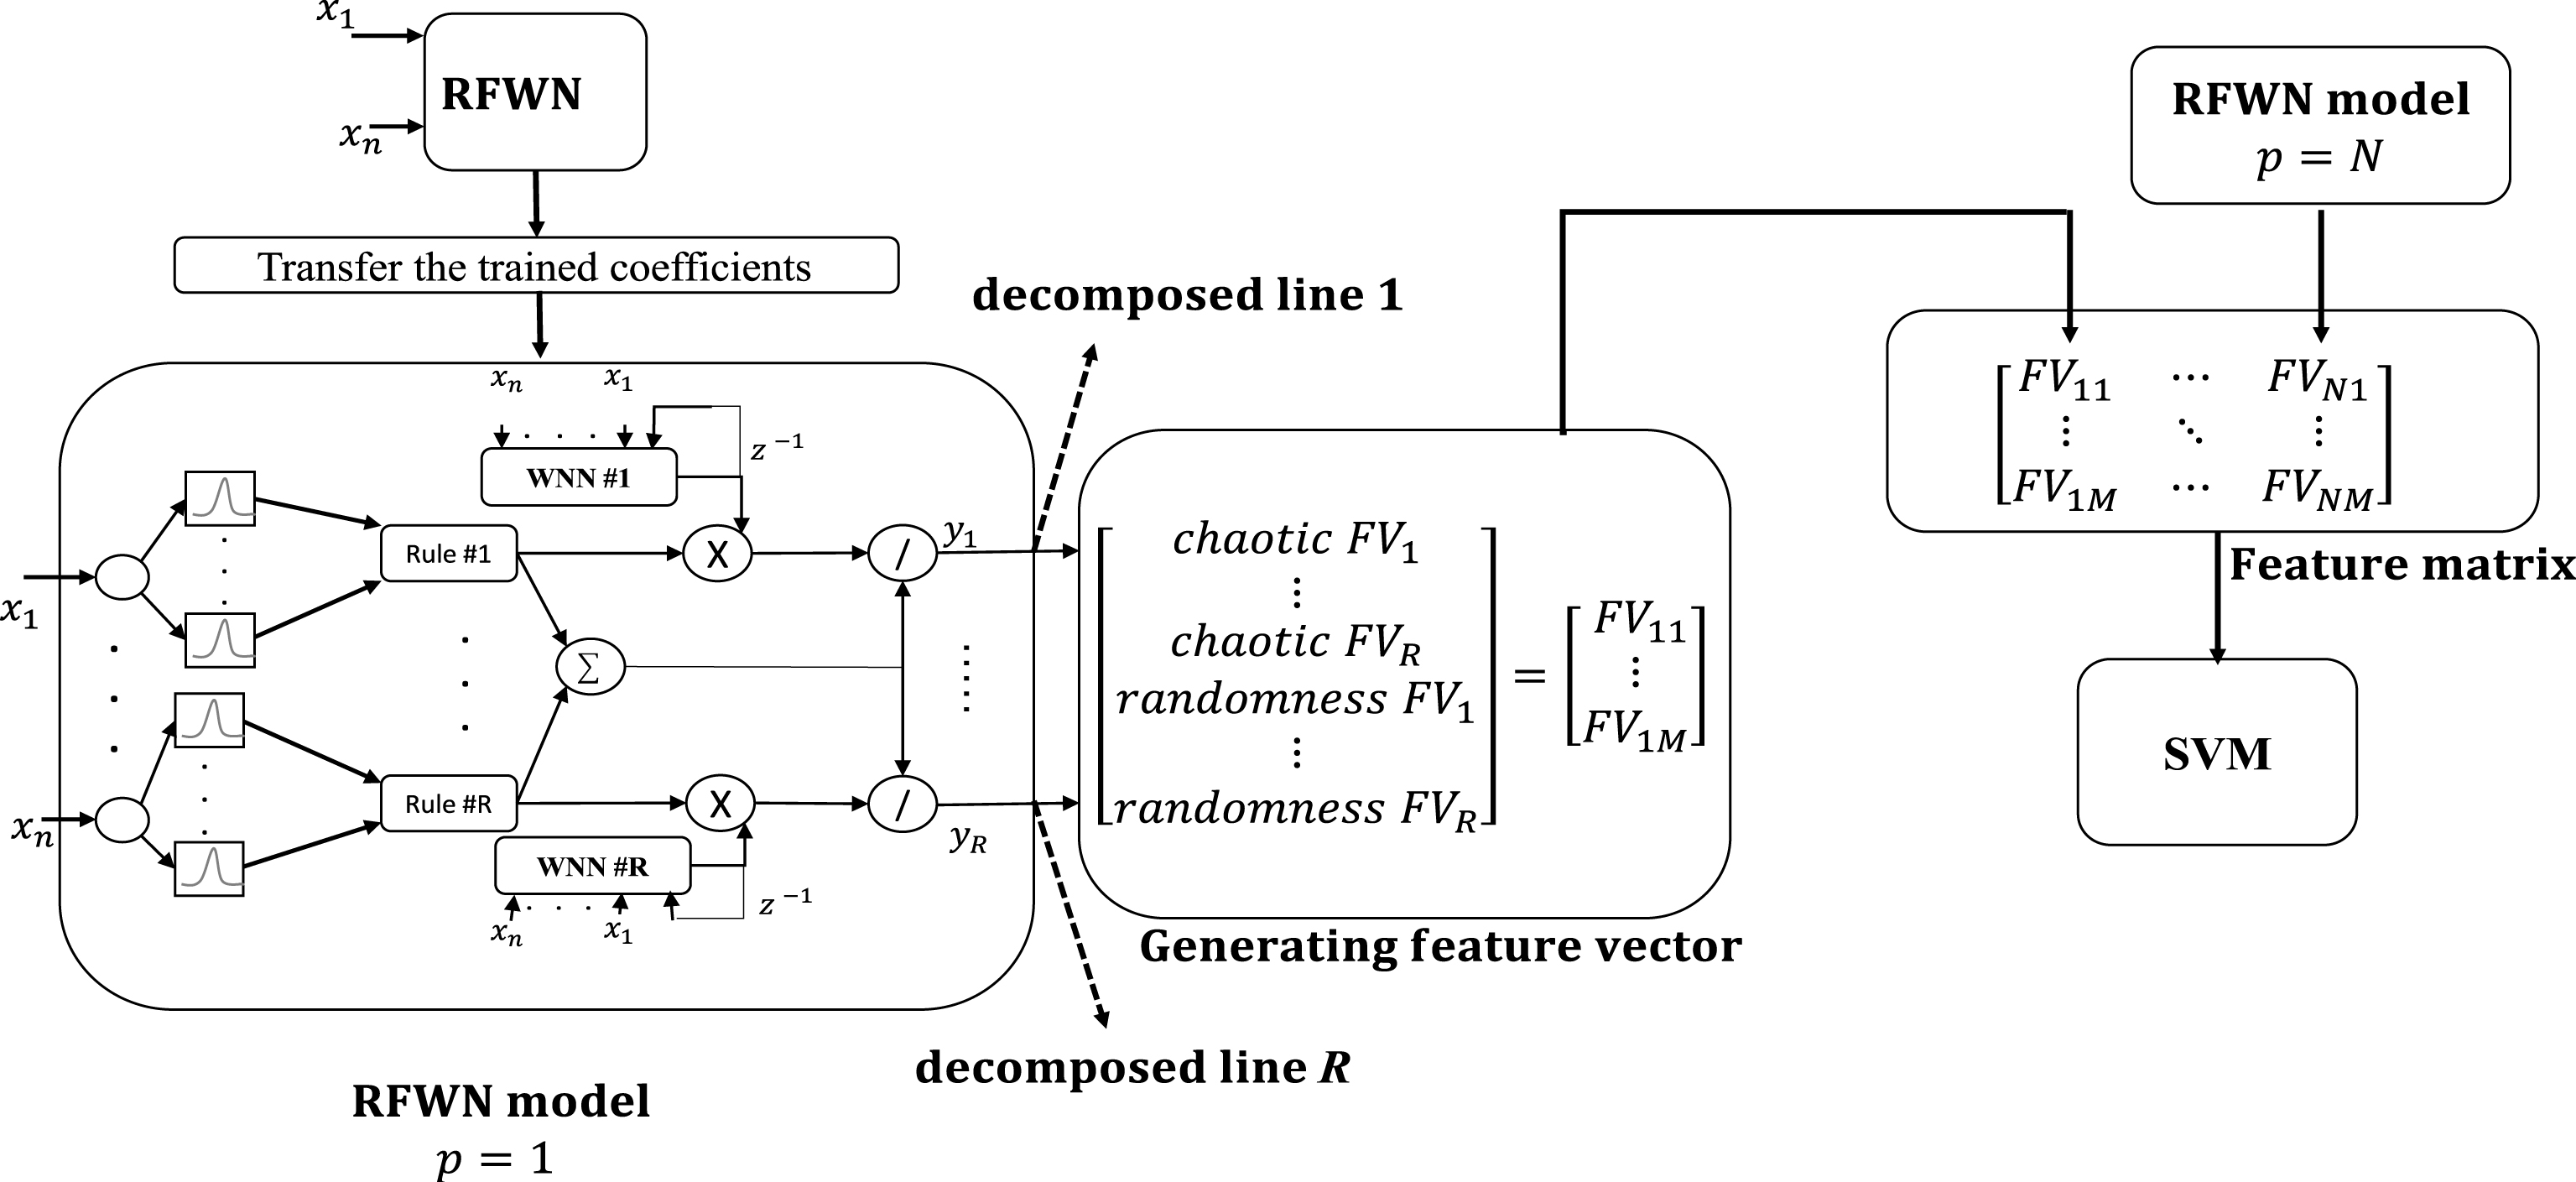
The RFWN methodology LS modelling. The input-output pairs of each segment were applied to the RFWN. After decomposition and feature extraction, the generated features were selected to perform the classification task. M, N are the length of the feature vectors and the number of subjects, respectively. For each subject, a distinctive RFWN model is trained and the illustrated feature matrix is achieved. Then a SVM classifier based on the training LS signals are trained.
In order to implement our approach, the number of fuzzy rules (R) is set to 5. This parameter was chosen empirically due to the fact that its high values causes some problems such as increase in the complexity of the network and increase in length of FVs leading to the low performance of the classifier. As mentioned in Section 0, the total unknown parameters of the network is 2nR + R (2L + 1). By these considerations, the number of model parameters as well as the length of FVs are determined.
For choosing the parameters m and τ, minimum embedding dimension (MED) and mutual information (MI) approaches are applied, respectively. Since it may leads to the different values for these two parameters, in order to consider a unique fuzzy model for all of the subjects, it is necessary to have a fixed m value for all subjects because this value is directly related to the number of our model’s first layer nodes. To do this, we examined MED approach in the calculation of m for a couple of subjects. Figure 8 depicts the histogram of the calculation of the embedding dimension for one hundred subjects. Given that, most of the subjects showed m = 6, this value was set for the embedding dimension.

The histogram of the obtained values for embedding dimension.
In contrast, the delay (τ) indicates the dynamic of the signal in the state space and it does not affect the topology of our network. Therefore, the delay value corresponding to each subject is applicable in the model.
We have compared 4 decomposition methods to each other, RFWN, FWN, WNN, and independent component analysis (ICA) as well as two other fuzzy wavelet approaches [26, 27]. Results of RFWN, compared with the other decomposing methods can be seen in the following tables. Table 1 shows the comparing results of the decomposing algorithms for classifying healthy and non-healthy LS from 4000-point and 10000-point segments. The performance of the models are firstly compared in sense of minimum mean squared error (MMSE), and then the classification performances among these groups are illustrated. Additionally, the ability of all methods are compared based on two alternative statistical measures namely sensitivity and specificity. Also the outcomes of some similar fuzzy wavelet structures [26, 27] are compared with the other approaches. Since ICA and WT decompose the given signals without modeling them, it’s not meaningful to address their performance with MMSE criterion in the tables. The ability of our methodology for distinguishing between the patients suffering from asthma and COPD is also listed in Table 2. Similar to the previous table, in Table 2 the results of 4000-point and 10000-point segments are compared together.
Classification results for healthy and non-healthy LS. The results contain the accuracy, sensitivity, and specificity precisions based on the 10-fold cross validation
Classifying results for COPD and asthma LSs. The results contain minimum, maximum, and mean precisions based on the 10-fold cross validation
According to the last two tables the highest performance was achieved by the RFWN method demonstrating the classification results in 97%. The results indicate that in the classification of healthy and non-healthy subjects, the performance of RFWN is superior to the others when the time-series are split into 4000-point segments. In contrast, the performance declines for the categorization of the two patient groups achieved in the 10000-pointsegments.
Also, some of the most applied methods in LS analysis containing AR coefficients [5, 6], wavelet transform [7, 8], and MFCC [10, 11] are compared with our fuzzy wavelet models in Table 3. In addition, this table contains the performance of the methodologies sated in the literature.
The classification results of the different approaches
*differentiating between healthy and non-healthy classes. **differentiating between healthy, COPD, and asthma.
The results generally indicates that our methodology is capable to find an appropriate model of time-series and to obtain a promising performance in differentiating three types of LS. However, there is not noticeable difference between the MMSE of RFWN and FWN. We have compared 3 decomposition methods containing wavelet network, independent component analysis (ICA), and our proposed method. This comparison indicates that, in the sense of MMSE the results are close to each other.
In another way, the classifier results demonstrate a better separation between healthy and unhealthy lung sounds for 4000-point and 10000-points segment decomposed by the RFWN. It can be seen from Tables 1 and 2 that MMSE for RFWN is lower than FWN, and this result confirms that RFWN could built a better generative model of lung sound signals than the others. The result confirms that using recurrent WNN in FWN structure improves the average accuracy of the classifier and this outcome is in accord with the claim that recurrent networks could better model the time-dependent and chaotic behavior of LS. Considering these results, we observed accepted separability between healthy and non-healthy groups besides COPD and asthma using RFWN decomposer.
Due to the differences in the acquisition hardware and the variations in the modelling methodology of our study, comparing our results with those presented in the literatures would be deniable. So, we implemented some of the well-known methodologies on our database. In [5], the pathological and the healthy subjects were categorized by AR representation and the acquired LS only recorded from two positions of the chest and classification performance was reported in two classes. Also, implementing the other CI approaches [4, 11] in our database showed that, our methodology has the higher performance in the distinguishing between the three types of subjects while it uses fewer lengths of FV.
In another set of literature, there are some studies in which the same dataset of this paper were analyzed. Goudarzi et al. [40] extracted the FVs based on the recurrent links of a novel form of fuzzy functions system. A correct classification rate of 75% using the recorded LS from a single channel was achieved, while our multichannel approach leads to a better classification rate. Another related work is our recently published study [4], which represent the application of the temporal sequence modeling of LS by a novel fuzzy functions approach. In another way, our new insight into the LS modelling verifies the ability of such fuzzy wavelet models to decompose the respiratory sound signals.
Conclusion
The aim of this paper is to show the ability of RFWN to use as a proper decomposer for lung sound signals. In our methodology, first a representative model of the given signals is generated, then the trained model is utilized for decomposing the input pattern to a set of components. Recurrent structures of the proposed fuzzy model could increase its ability to model LS time-series in comparison with the feed-forward structures. In addition, since we had used a well-structured WNN with predefined scaling and translations in the fuzzy rules, the decomposition lines become related to the specific time-frequency bands. This consideration could reproduce a set of interpretable components of the LS in the output layer of RFWN. Results with a high level of accuracy were achieved by our proposed methodology. Also, considering the temporal changes of LS as the model’s input verified that dynamic information of the respiratory system could represent distinctive information of the abnormalities through a number of chaotic and randomness features. Although the results demonstrate that the combination of the recording channels exhibits encouraging performance in the categorizing of the subjects, combining the local information of the microphones by adding spatial filters to the fuzzy models could be a good suggestion to improve the differentiation scheme.