



Abstract
Emotions, which are now commonly portrayed in social media, play a fundamental role in decision making. Having this into account, this work proposes a model to predict (forecast) emotions in social networks. This model specifically predicts, for a user, the proportion of comments that will be published with a particular emotion; this proportion is defined as an emotional intensity of the user in a particular time period. On the contrary of other models, which are focused on a single emotion, the proposed model considers a basic scheme of four emotions and employs these in an interdependent manner. The model, moreover, utilizes three types of features: (1) user-related, (2) contact-related, and (3) environment-related. Prediction is performed using linear regression. Nearly 20 models, including ARIMA, are outperformed by the proposed model (with statistically significant results) when evaluated over a dataset extracted from Twitter. Some potential applications include massive opinion monitoring and recommendations to improve the emotional wellness of social media users (for example, the recommendation of joyful memories).
Introduction
Emotions play an important role in decision making. For example, Small and Verrochi [35] show, for a publicity campaign, that displaying a sad face has a significant impact on charity donations, as opposed to displaying a happy face or a face that reflects no emotion. By affecting the human organism and influencing its behavior, emotions can move humans towards executing minor actions, such as buying a product [9], or more radical actions, such as initiating a war [34] or hurting themselves [5, 27].
Emotions are also present in social media, and this has led to research on their representation, detection, analysis, and prediction on these media. Social networks such as Twitter and Facebook have enabled the study of not only individual users [30], but also entire populations [7]. Thanks to these networks, it has been possible to identify patterns in emotional changes due to climate [11] or emotional transitions at a collective level [25]. Other works have studied emotions in social networks with specific aims, such as preventing stress in teenagers [20, 43], detecting bipolar disorder [4], and preventing depression [24]. However, these studies are based on limited emotions or emotions labeled simply as positive or negative [23]. As a result, patterns related to other emotions (such as sadness or anger) have not been discovered, and more sophisticated schemes have not been included. For example, Ekman [8] found evidence on the existence of six basic emotions (joy, sadness, disgust, anger, fear, and surprise), and more recent studies have proposed the existence of only four basic emotions (joy, sadness, fear, and anger) [15]. If these schemes were considered, emotion prediction in social networks could discover more valuable information.
Furthermore, some works are narrowed down to a single emotion, such as joy [7]. In some cases, for example, just one emotion is predicted [14, 43]. In other cases, the emotional state of the user (i.e. the emotions present in the user) is treated as a binary label [42], in the sense that it is assumed that only one emotion can be experienced by the user in a time window (one hour, one day). Other times, focusing on a single emotion implies ignoring that emotions coexist, i.e. treating emotions as independent from each other when performing predictions; consequently, the future value of the predicted emotion depends exclusively on the past values of the emotion itself and not the rest of the emotions experienced by the user. However, it has been observed that emotions affect perception and tend to remain for a certain period of time; for this reason, a present event can be augmented or diminished depending on distinct past emotions [6, 41]. Therefore, emotions can be considered as interdependent.
Another limitation of current related works is that the majority of the ones focused on text are confined to the English language, since also the majority of the available resources are only available in this language.
For these reasons, a model to predict emotions — specifically, user emotional intensities — within a time frame called time window is proposed (the emotional state of a user being thus conceived as a vector conformed by these intensities). First, this model considers a set of basic emotions, as opposed to models devoted to predicting a single emotion. Second, the model combines different past emotions to predict the intensity of a given current emotion (emotion interdependency). Third, the model uses three types of features: user-related, contact-related, and environment-related. Fourth, Twitter is utilized as a case study and Spanish is the language employed.
In summary, the contributions of this work include the aforementioned model the introduction of the emotional intensity concept the usage of basic emotions the consideration of emotion interdependency the incorporation of emotional contagion into the model the creation of basic emotion classifiers.
The rest of this document is organized as follows: Section 2 introduces pertinent background on emotion theory, manual annotation, and Twitter, while Section 3 describes related work. Section 4 explains the proposed approach and Section 5 provides experiments and results. Section 6, finally, provides conclusions and future work.
Background
The purpose of the current section is to describe concepts related to emotion theory, global label selection for training instance generation (i.e. how to select a label when having multiple manual evaluations), and vocabulary related to the Twitter social network.
Emotion theory
Currently, there is not a global accepted definition for the concept of emotion. In general, emotions arise from a stimulus, imply a physical reaction, can be learned, and are present both in human beings and animals [17]. Basic emotions are associated with a particular facial configuration and can be found in primates [8, 28]. Note that, in this work, the terms emotion, mood, and sentiment will be used interchangeably — even though these terms imply particular meanings from the psychological point of view.
Emotion transmission from one person to another is known as emotional contagion; according to Hatfield and Cacioppo [12], this phenomenon is the tendency to imitate and automatically synchronize with movements, postures, and vocalizations from another human being and, consequently, to emotionally converge. From a psychological perspective, Hoffman [13] proposes several mechanisms through which emotional contagion can be initiated. One of these is through language, where either spoken or written expressions provoke for the observer to think in a situation where the given reaction was similar. Another mechanism consists, conversely, of picturing oneself (the observer) in the described situation to experience a similar emotion.
Intercorrelation agreement
In machine learning, a set of instances is, for the usual, manually labeled by several evaluators to produce training examples; this process is called manual annotation. However, selecting a global label that accurately represents the collective evaluation of annotators is an issue. One option, for example, is to choose the label voted by the majority, but this label is not always representative. The problem of selecting a global label becomes of special importance when attempting to emulate the labeling by an expert, which is relevant in certain contexts. To address this problem, Qing et al. [29] propose a method called intercorrelation agreement in the context of selecting the most appropriate label for a comment with different user evaluations. The quality or reliability of annotator i is given by
Twitter is nowadays one of the most popular social networks online. It allows users to post a maximum of 140 characters per message
1
, where messages are termed tweets. Each user may follow or be followed by other users, where the former are known as the user’s followees and the latter are known as the user’s followers. Tweets published by followees appear in the user’s timeline, which can be seen as the user’s personal webpage. The user can also be mentioned in other users’ tweets, regardless of following these users. To make a mention, the user’s name has to be placed in the tweet (for example
Related work
Related literature differs from the proposed approach in four main aspects: representation of the user’s emotional state, scheme of emotions utilized, number of emotions predicted, and manner of handling emotions for prediction. With respect to the first aspect, the user’s emotional state refers to the set of emotions present in the user in a given time window. Several works represent this state using a single label, which is equivalent to using binary disjoint vectors where only one emotion can be present at a time (for example, the user is labeled with either anger or joy at time t i but not with both). This is the case of MoodCast [37, 42], since future emotional states are predicted by learning an objective function based on the user’s history, contacts history, and various environmental features. This approach, also in contrast with our proposal, works with abstract emotions (positive, negative). Similarly, Mogadala and Varma [23] predict emotional transitions (positive, negative, no change) in Twitter using regression and features such as retweets, mentions, and specific emotion key words; to recognize emotions in tweets, an unsupervised method based on WordNet and LiveJournal moods are used. Emotional transitions are as well studied by Nguyen et al. [25] at a collective level in Twitter by considering retweets, contact information, and different granularity, lengths for the historical period, and slacks.
As in the aforementioned work, emotions have also been studied collectively. For example, Dodds et al. [7] use a word-based approach to analyze population patterns of happiness reflected in Twitter along time, finding peaks of happiness in weekends. Hannak et al. [11] analyze the effect of different weather-related features (e.g. temperature and humidity) over the emotions of a population using Twitter data as well, where emotion recognition is performed by means of emoticons; humidity was found to have a negative effect on people’s emotions.
Other works focus on predicting a single emotion, such as stress or depression 2 . Li et al. [20] predict teenager stress (three-level scheme) by building a historical stress sequence from stressful event-related and tweet features such as emoticons, negative emotion words, and linguistic content; SVARIMA (Seasonal Autoregressive Integrated Moving Average) is used for prediction. Maxhuni et al. [21] manage a three-level scheme (high, moderate, low) to predict stress in workers, where intermediate classifiers are first trained to infer emotion-related features and these features, in turn, are used to finally predict the stress level; emotion-related features are inferred using accelerometer data from smartphones. Zhao et al. [43] manage a four-level scheme to predict teenager stress by using content and response features (e.g. number of likes to a comment) in a time window. Depression is predicted in the context of bipolar disorder using questionnaire data transmitted via SMS and techniques such as Gaussian process regression and exponential smoothing — this emotion still being difficult to predict across patients [24]. With respect to this last issue, van Breda et al. [38] point out that full predictive models that employ historical values and other features (e.g. support vector machines) perform better than models that use only historical values (e.g. ARIMA).
As we will see later, another difference with respect to other works is that our approach predicts a given emotion by taking all other emotions of the scheme into account (interdependency) — for example, to predict future intensities of sadness, former intensities of joy, anger, and fear are also considered.
Emotional intensity prediction
The proposed approach consists of a model to predict user emotional intensities in a social network. Prediction is in the sense of forecasting, where the latter means estimating future values for a target variable given a set of input variables or features. The values for the input variables are, normally, historical — that is, they span a period sett1 … t k of k units of time, and each t i unit is called time window; note that t i could be punctual or a time interval. In this case, k is the length of the historical time period. The predicted time window, as the name indicates, corresponds to the time window tk+p for which the prediction is going to be made. Formally, this can also be denoted with value p, where p ≥ 1. When p > 1, there is a slack between the historical time period and the predicted time window.
Time can be measured using different types of temporal granularity (minutes, hours, days, months, and so forth). For the sake of simplicity, the same granularity is used for the target and input variables.
As will be seen later, a previous step for predicting emotional intensities is emotion recognition in comments (which will be discussed in Section 4.3).
Emotional intensity
The target variable is the emotional intensity of a social network user for a given basic emotion in a given time window. The set of considered emotions to make the prediction is defined as ξ. Since recent works have found evidence to support the scheme of four basic emotions (joy, sadness, fear, and anger) [16], this scheme is considered. However, the proposed model has the capacity to adjust to other schemes.
It is assumed that users express their emotions throughout their written publications (comments), such that these emotions can be automatically detected. Having this into account, the emotional intensity Iu,e (t
i
) for user u and emotion e ∈ ξ is defined as the proportion of comments with e published by u in t
i
. Formally:
Since ζu,e (t i ) ⊂ ζ u (t i ) and ∀t i |ζu,e (t i ) |≥0, ∀t i Iu,e (t i ) ∈ [0, 1].
To better understand the concept of emotional intensity, assume that Iu,s (t i ) =2/5, where s represents sadness. This implies that user u published five comments in time window t i (where t i could be one hour, for example), out of which two expressed sadness. As a consequence, the emotional intensity for u with s is 0.4 for the analyzed time window.
The proposed prediction model for user emotional intensity takes into account three types of features: (1) user-related, (2) contact-related, and (3) environment-related — where the environment is either internal or external to the social network. In this case, user features consist of the user’s emotional intensity history, contact features consist the user’s contacts emotional intensity history, and environmental features consist of the day of the week in which the prediction is being made. With respect to the user’s contacts, these concern a manner of incorporating emotional contagion into the model. Two types of contacts are considered: (a) the user’s followees and (b) the user’s mentions by other users. While the former’s comments can be seen from the timeline, and thus are in the position of affecting the user’s emotions, the latter have the peculiarity of generating a notification for the user, which could catch the user’s attention and affect emotions as well. With respect to the day of the week, there exists broad evidence that environmental factors affect emotions; for example, Dodds et al. [7] showed that the day of the week has an impact on happiness, and Hannak et al. [11] showed that environmental moisture has a negative effect on the amount of published comments in Twitter.
User, followee, and mention emotional intensity histories are respectively recorded in matrices
In this matrix, Iχ,j (t
i
) is the intensity for an emotion, measured from the comments published in t
i
, with 1 ≤ j ≤ |ξ| and 1 ≤ i ≤ k. Consider that
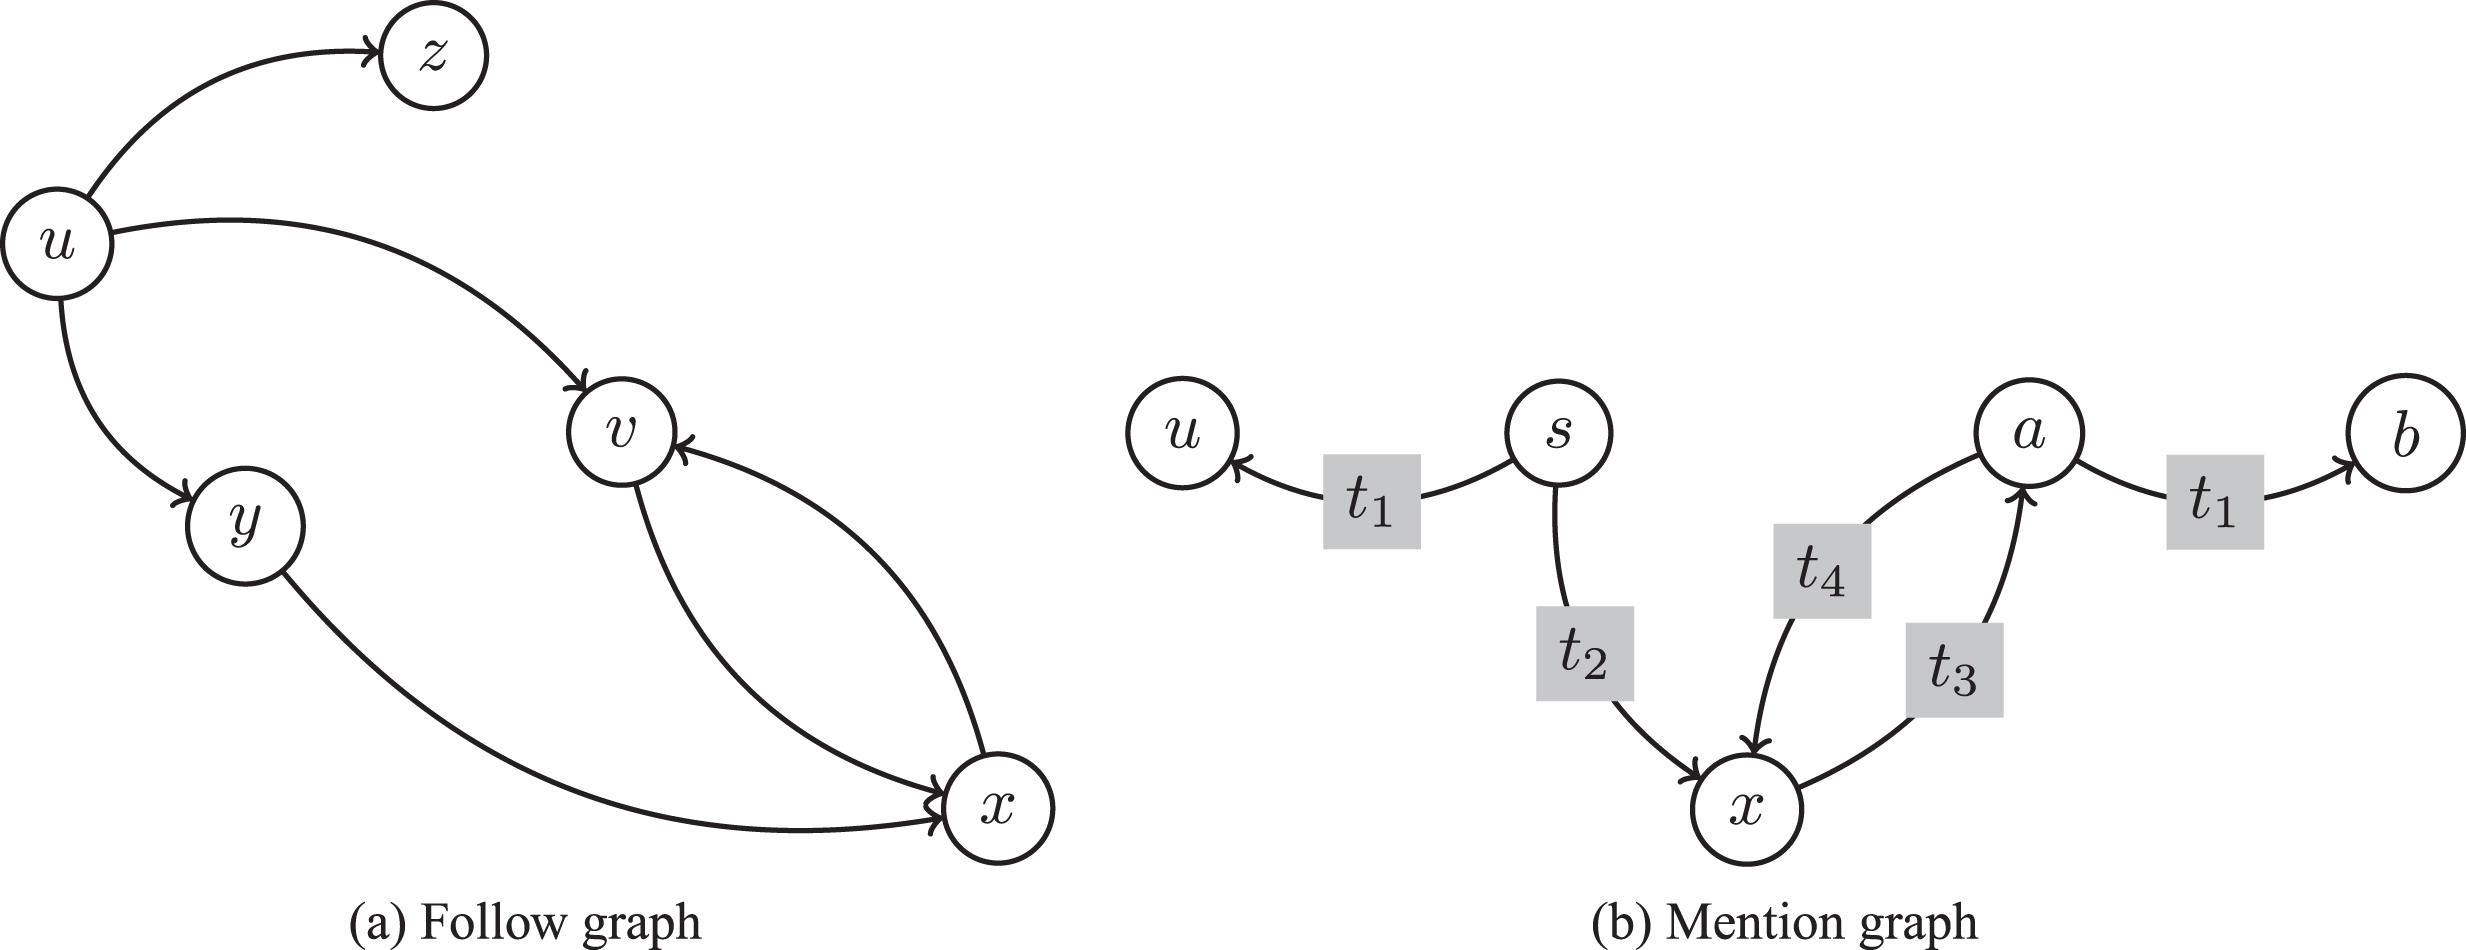
Social networks from which features are extracted. In the follow graph, edge (a, b) implies that user a follows user b. In the mention graph, an edge (a, b, t i ) implies that user a mentions user b in time t i .
We define matrix
To make the prediction, a function that associates the input matrices to the target variable is learned:
where the scalar product between two vectors is denoted by “·”. In this manner, the problem is reduced to estimating the components of vectors νU,j, νf,j, νm,j, and ν E , and likewise the parameters β0 and ɛ.
In contrast to other models, the proposed model considers emotion interdependency, which could be useful if one takes into account that all past emotions could influence the intensity of a user’s future emotions. For example, being sad yesterday (e.g. for the death of a relative) could impact one’s level of joy tomorrow. In that sense, different studies have shown that specially negative emotions tend to linger for longer periods of time in the human being [39], this implying that these “older” emotions could mix with “newer” emotions experienced [18]. Furthermore, basic emotions could be more informative than just abstract emotions such as “positive” or “negative” (in particular, a numeric intensity could be even more granular than a categorical label).
To predict emotional intensity, it is necessary to recognize emotions in comments. As illustrated in Fig. 2, this task is performed by collecting a set
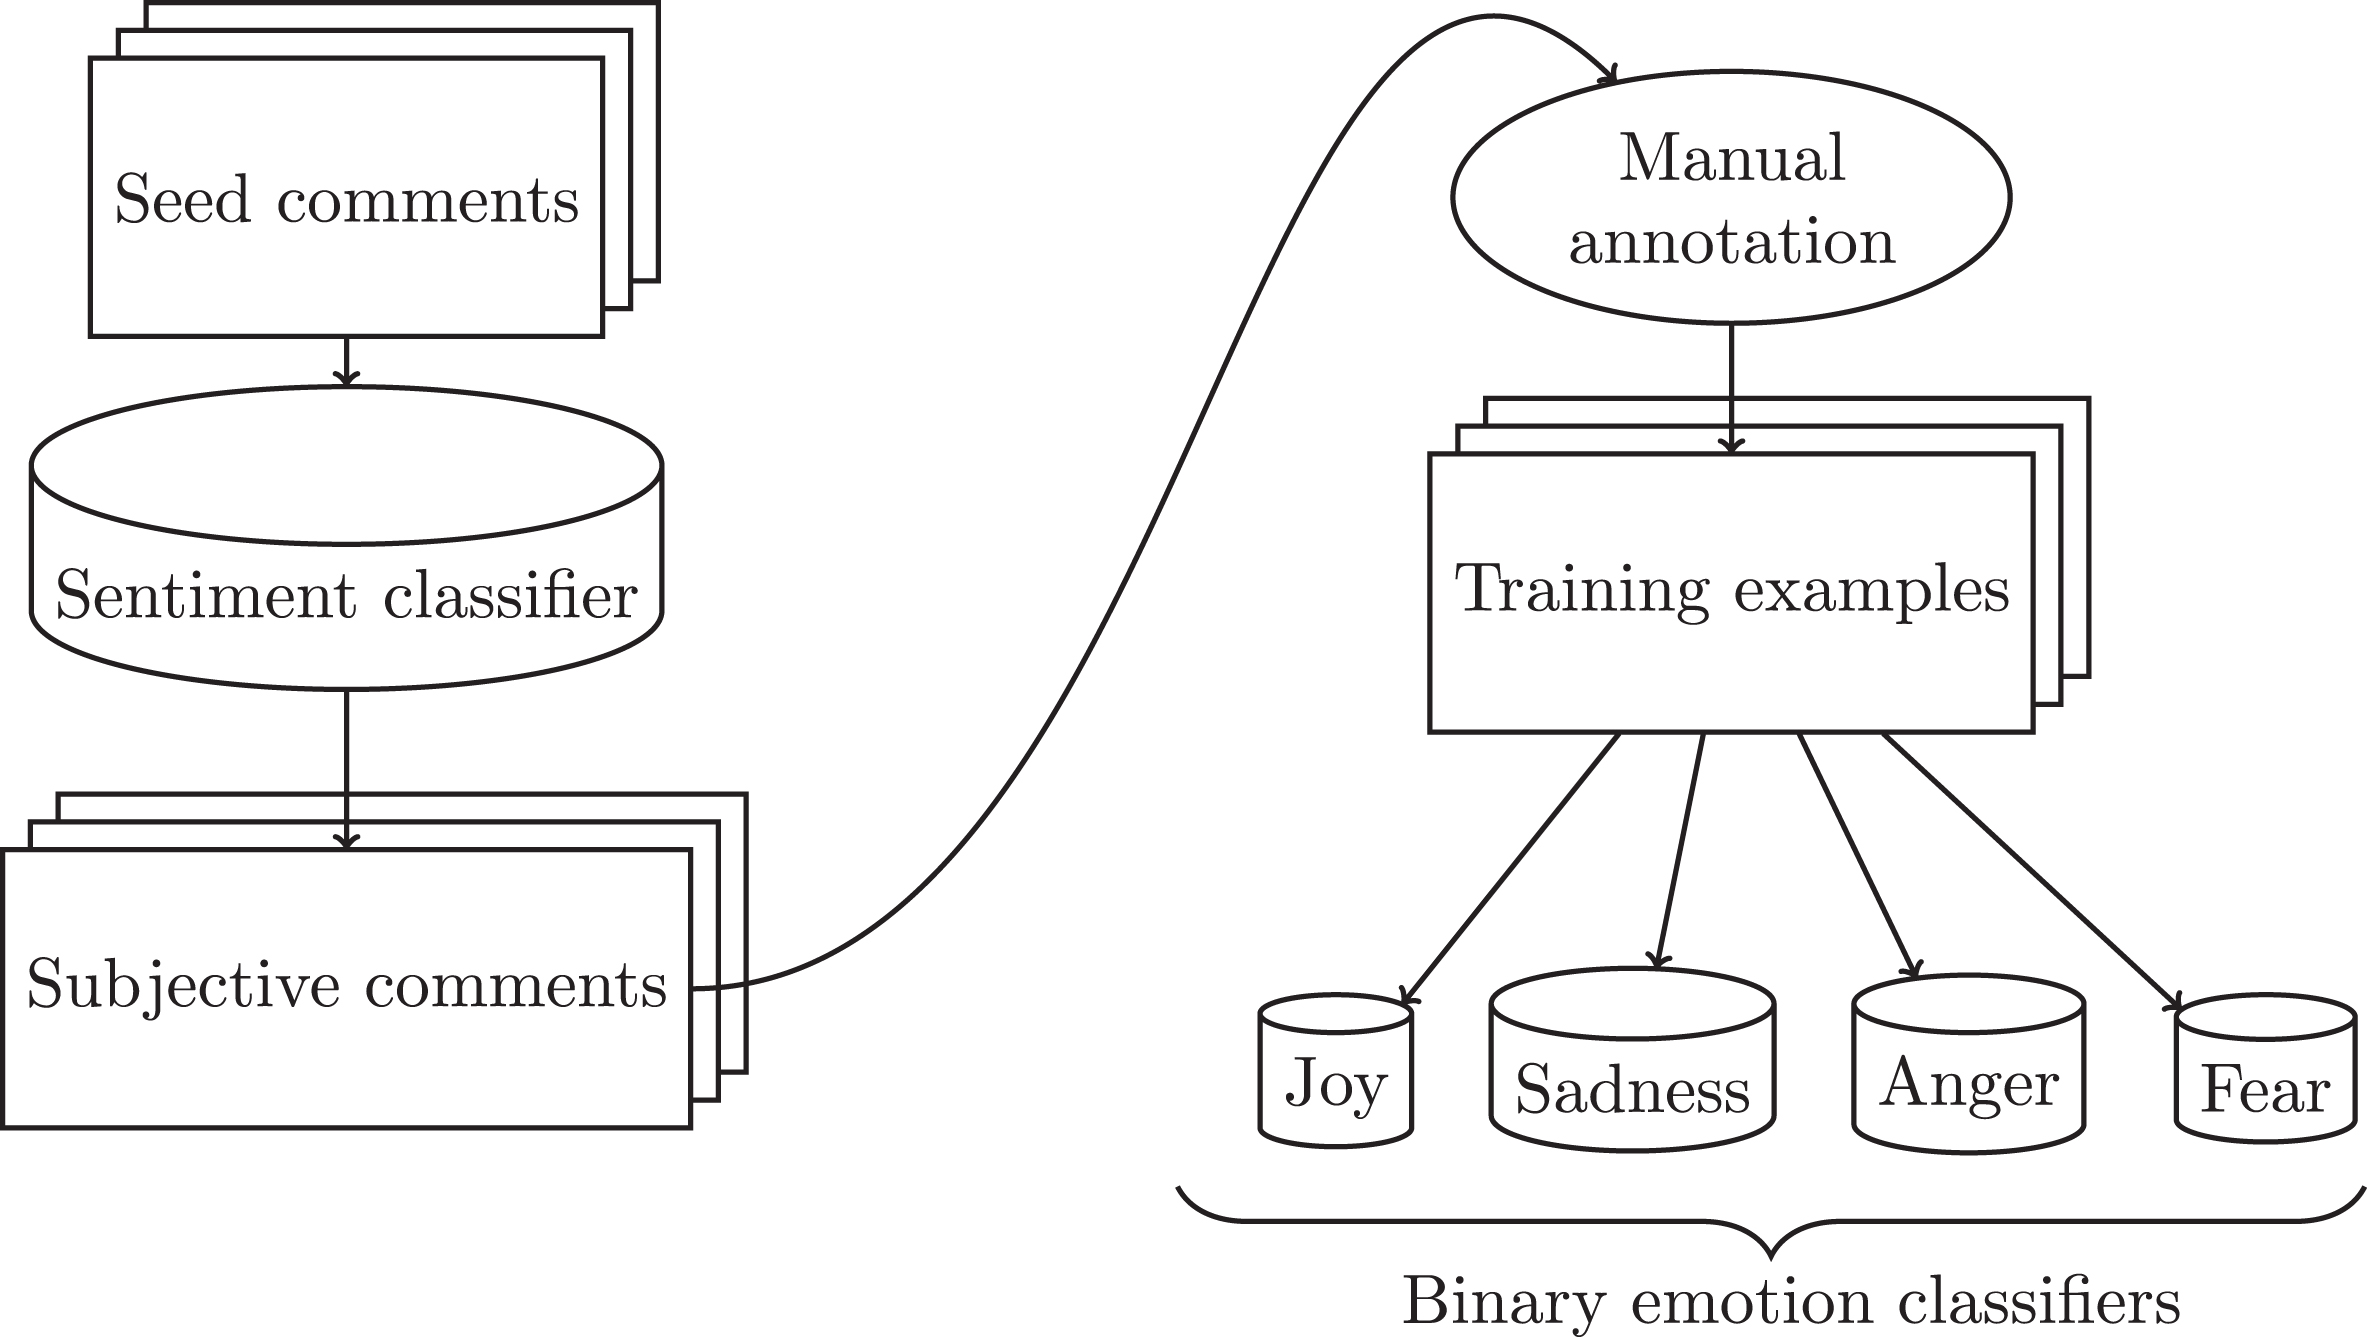
Emotion recognition process.
For sentiment classification, an unsupervised term-weighting strategy called Twitter Opinion Mining, which has shown to outperform other strategies for sentiment classification in Spanish is utilized [33]; however, the use of other types of classifiers for other languages is not discarded.
With regard to manual annotation, it is assumed that each comment can express more than one emotion. Consequently, to determine if a comment should be labeled with emotion e, the proposed methodology combines (a) expert annotation approximation with (b) global label assignment. With respect to the former, it has been reported that a minimum of seven non-expert evaluations estimate the labeling of an expert [36]. With respect to the latter, the assignment of a representative label can be carried out by means of the intercorrelation agreement (previously explained in Section 2.2), used to weight the scores assigned by different annotators [29].
The intercorrelation agreement, in this case, would be given by considering a label set L = seta, p that indicates the absence (a) or presence (p) of each emotion e ∈ ξ in a comment c. The labeling function consists of assigning to c, given e, the label that obtains the highest score:
With the annotated comments, it is possible to collect instances to train binary emotion classifiers (one for each emotion of set ξ). In this case, support vector machines — a type of classifier that is well suited for text classification [1, 40] — are used. As feature vectors, unigram frequencies are employed; even though this is a simple representation, as it will be shown later, it has given acceptable results for the purpose of emotion recognition.
With the trained classifiers, the comments used for emotional intensity prediction can be automatically classified and thus historical intensities for the user (matrix
Two classes of experiments were performed: experiments to validate the emotion recognition methodology and experiments to validate the emotional intensity prediction model.
Dataset
Twitter was used as a case study, as it is one of the most visited and popular social networking sites with more than 67 million users, ranking 13th in Alexa’s Top Sites 3 . Since works in Spanish are scarce, working with this language was part of the proposed contributions. To ensure users would employ expressions similar to those understood by annotators, comments extracted from a single location were used (the location being the authors’ city of origin). This repository of comments has been used for several data mining tasks in the past [32, 33], it contains ≈40 million comments and ≈ 81,000 users. The decision to use this repository is based on the following assumptions: it contains a sufficiently large base of users and comments, it is in Spanish (the selected language to work with), native annotators are acquainted with the language and particular expressions of the users from this location, and emotional contagion could be present with a higher probability. From this repository, users with at least 30 followees and at least 400 comments — both the user and the followees — were selected.
For over a year, students from the authors’ university annotated the selected comments using an online system, in which they indicated the presence or absence of each basic emotion. Each comment to annotate was randomly selected and up to twelve evaluations were permitted per comment. If a comment reached twelve evaluations, the system continued with the next comment. In total, 4090 comments were annotated and 141 different annotators evaluated the comments. If an emotion was detected in a comment, this comment received preference to be evaluated again by another annotator.
To decide if an emotion was present in each comment, the intercorrelation agreement was used (see Section 2.2) with |K|=2 to train the binary classifiers. Emotions were distributed as shown in Table 1. Because fear was present in a very low quantity of comments, it was discarded from the analysis; it will be considered for future work.
Emotion distribution in annotated comments
Emotion distribution in annotated comments
Classical pre-processing was performed to each comment by means of tokenization and stopword elimination (Spanish stopwords were extracted from Freeling [26]). To evaluate each classifier, 70% of the instances (from the classifier’s respective emotion) were used for training and the remaining 30% for testing. WEKA 4 was used for classifier implementation. To have balanced classes, random undersampling was used.
Results for each classifier were evaluated using precision, recall, and F-score (see Table 2). As it can be appreciated, all F-scores are above 70%, which is considered as a suitable value for proceeding with emotional intensity prediction. It is interesting to note that all classifiers behave similarly, since the manually annotated comments for anger and sadness represent only 20% of the annotated comments for joy — i.e. the comments for this emotion are considerably higher. In that sense, the classifiers for anger and sadness obtained a comparable quality with a smaller amount of training instances. This could be due to comment pre-processing, the use of the intercorrelation agreement, and class balancing.
Evaluation for emotion recognition
Evaluation for emotion recognition
The proposed model for emotional intensity prediction was evaluated by means of gathering feature matrices of a set of users for a determined historical period and attempting to predict the emotional intensity for the immediately succeeding time window — both with different emotions and different time granularity. The obtained results were compared against 19 models using different metrics. As it will be seen, some of the results coincide with works by other authors.
Setup
To validate the proposed model, test instances were created. From the previously mentioned Twitter repository, 5000 users at random were selected, and the most recent 1000 comments were extracted for each user. These comments range from July to November 2011.
With regard to the length k of the historical time period, because Twitter has shown patterns that repeat on a weekly basis [7], k = 7 was selected using three types of granularity: one day, one hour, and a block of 15 minutes. The prediction comprises the first succeeding time window of the historical period, i.e. p = 1, since this is the first value that could be explored.
Considering k, p, the selected sample of users, and — in general — the information available in the repository, test instances were extracted, where each instance consists of the matrices
[P i ] Assumes that emotional intensity is given by the average emotional intensity up to n preceding time windows. In this case, models were developed for i = 1 to i = 15 (i.e., 15 models were created using the P i strategy).
To see a more comprehensive comparison against 27 models, the reader is referred to [31].
Results and discussion
The results obtained are shown in Tables 3 and 4, as well as visually in Fig. 3 and 4. As it can be seen from these results, the proposed model is superior — with a statistically significant advantage — to every other model, except for All and All + Contagion (which are actually models derived from the proposed model). It is noteworthy that anger obtained the best results, both for the MAE and correlation; consequently, anger obtained the best prediction for intensity. In addition, sadness obtained the second best correlations.
Model comparison using mean absolute error (MAE). Best values are indicated in bold. If an asterisk is placed next to the value, differences are also statistically significant (does not apply for values enclosed in parentheses). P1-15=Average of preceding time windows 1-15, A+C=All emotions + Contagion
Model comparison using mean absolute error (MAE). Best values are indicated in bold. If an asterisk is placed next to the value, differences are also statistically significant (does not apply for values enclosed in parentheses). P1-15=Average of preceding time windows 1-15, A+C=All emotions + Contagion
Model comparison using correlation

Mean Absolute Error (MAE) for predicted emotional intensities. R= Random, P= Previous time windows (1-15 average), A= ARIMA, S= Single emotion, E= All emotions, C= All emotions + Contagion, M= Proposed Model.
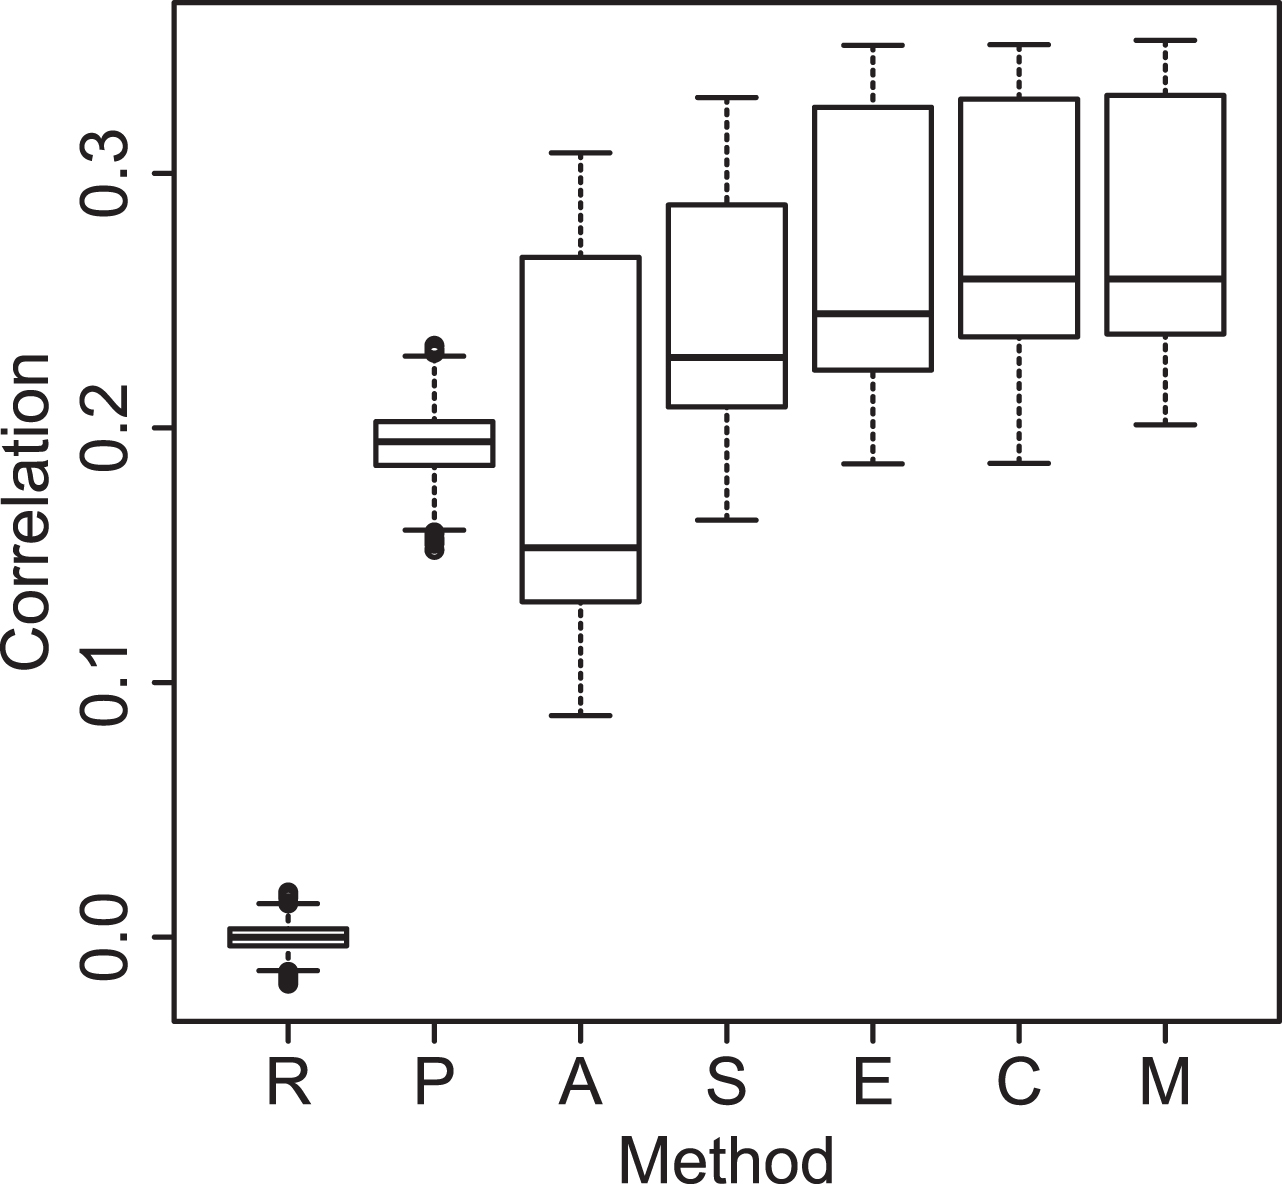
Correlation for predicted emotional intensities. R= Random, P= Previous time windows (1-15 average), A= ARIMA, S= Single emotion, E= All emotions, C= All emotions + Contagion, M= Proposed Model.
According to Brans and Verduyn [2], both sadness and anger are amongst the most intense and lingering negative emotions, therefore it is not surprising that models can more successfully predict intensities for these emotions given their stability. As a consequence, the obtained findings match those of the previously mentioned authors — although their results favor sadness above anger. The obtained results, in contrast, probably favor anger because, on one hand, the nature of social networks makes negative emotions spread more easily [3]. This may also be due to the nature of the used repository, which includes events that span negative emotions, such as the intentional fire in the Casino Royale of Monterrey in 2011, which caused a general negative sensation in the public opinion.
With regard to the advantage obtained with respect to ARIMA, it is possible to observe that the proposed model was better in all cases. This could be due to ARIMA using only one time series of the corresponding emotion for each user. That is, it utilizes information coming from a single user and a single emotion to make the prediction, due to the nature of the method; this same disadvantage had already been mentioned by van Breda et al. [38]. Meanwhile, linear regression uses information from multiple users and emotions to train and test in an independent set. This could be one of the main reasons for ARIMA not being able to overcome the proposed method. There exist other variants for ARIMA, such as VARIMA, which can work with several time series; this remains as future work.
A model for predicting emotion intensity in social networks has been presented. This model uses features related to the user (past emotional intensities), to the user’s contacts (past emotional intensities), and to the environment (day of the week); a scheme of four basic emotions — joy, sadness, anger, and fear — is considered, and the intensity for a given emotion is predicted by taking into account past intensities from all emotions in the scheme (not just intensities from that same emotion). A model is learned via linear regression. This model was evaluated using a Twitter dataset and compared against 19 different models (including baselines, partial models, and ARIMA), which were outperformed.
The proposed model can be applied in several forms. For example, to stabilize users’ mood, different contents — including happy or pleasant memories — can be recommended in social networks when sadness or anger are predicted. Furthermore, emotion intensity prediction can be used for damage control in publicity campaigns, strategic marketing, and government strategic planning (e.g. emotional health monitoring of a population). Also, emotion prediction can be used to leverage tasks such as bipolarity, depression, and cyberbullying detection — which are major problems nowadays.
With regard to future work, multiple lines are possible. On one hand, the emotion classifier can be enhanced to include the fear emotion; moreover, other features or an ontology can be used to further improve the results. On the other hand, the model can be extended to predict complex emotions, such as jealousy, hopelessness — which is found in suicide notes [5] — and loneliness, among others. Also, historical events could be added to the set of features.
Footnotes
Since 2017, Twitter is testing a 280-character limit.

Available at
Available at