
Abstract
Optimization algorithms are important in problems of pattern recognition and artificial intelligence, i.e., the image recognition, face recognition, data analysis, optical recognition, etc. Estimation distribution algorithms (EDAs) is kind of optimization algorithms based on substituting the crossover and mutation operators of the Genetic Algorithms by the estimation and later sampling the probability distribution learned from the selected individuals. However, a weakness of these algorithms is the efficiency in terms of the number of evaluations of the fitness function. In this paper, a Cellular Gaussian Estimation Algorithm (CEGA) for solving continuous optimization problems is proposed. CEGA is derived from evidence-based learning of independence and decentralized schemes of local populations. The experimental results showed that the present proposal reduces the number of evaluations of the fitness function in the search for optimums, maintaining its effectiveness in comparison to other algorithms of state-of-art using the same benchmark of continuous functions.
Introduction
Estimation of Distribution Algorithms (EDAs) [1, 2] have been widely used to find solutions in discrete [3] and continuous [4] optimization problems. These kinds of algorithms are based on substituting the crossover and mutation operators of the Genetic Algorithms (GAs) [5, 6] by the estimation and later sampling the probability distribution learned from the selected individuals. In every optimization problem, there are dependencies between the variables, which are not inferred by most of the current optimization methods (Genetic Algorithms, Particle Swarm Optimization, etc.). To detect the dependencies, EDAs use statistical techniques. The main advantage of EDAs over GAs is that they estimate the values of each variable using a probability distribution, while Genetic Algorithms seek a solution to a problem by directly coding the variables. For continuous optimization problems, several EDAs have been proposed: UMDA c [4], PBIL c [7], MIMIC c [8], EMNA (and its variants) [8–10] and PolyEDA [11]. However, a weakness of these algorithms, as well as the EDAs for discrete optimization, is the efficiency in terms of the number of evaluations of the objective function. In order to deal with this weakness for discrete optimization, a new kind of EDAs named the CellularEDAs was proposed [12, 13], which allow for the decentralization of the individuals in the population. But in the best of our knowledge, this idea has not been used for continuous optimization problems.
In this paper, a new kind CellularEDA, the Cellular Estimation Gaussian Algorithm (CEGA), which learns the structure and parameters of Gaussian networks from local populations using independence tests and decentralized schemes to reduce the number of evaluations, preserving their effectiveness in the solution of continuous optimization problems is presented.
This paper is organized as follows. Section 2 presents a brief review of related work. Section 3 provides basic concepts. Section 4 describes the proposed algorithm. Section 5 presents the experimental results. Section 6 shows statistical validations and finally, Section 7 contains conclusions of this study.
Related work
The simplest of the EDAs used to find solutions in problems of continuous optimization is UMDA c (Univariate Marginal Distribution Algorithm for Continuous Domain) [4], which assumes in each generation that the variables are independent following a normal distribution (other distributions can be taken into account).
Other EDAs developed for problems of continuous optimization are PBIL c [7], MIMIC c [8], EMNA (and its variants) [8–10], PolyEDA [11], RECEDA [14], EBCOA [15] and CMA - ES [16, 17] and sEDA [18].
PBIL c (Population Based Incremental Learning for Continuous Domain) [7] follows a scheme similar to the UMDA c . While MIMIC c algorithm (Mutual Information Maximization for Clustering for Continuous Domain) [8] is an extension of the MIMIC algorithm [19], in which the variables take real values, sets the model to the empirical data and analyzes only the relationships that exist between pairs of variables in the same way as UMDA.
EMNA (Estimation of Multivariate Normal Algorithm) [9] uses a multivariate normal density function to learn the factorization of the selected individuals. Alternatives to this algorithm (also known as EMNA global ) are EMNA a and EMNA i [10]. Both generate a single individual. The first is adaptive, incorporating the individual if it is better than the worst in the population. The second is incremental, adds the individual to the population. Likewise, the EGNA (Estimation of Gaussian Network Algorithm) [8] uses learning and simulation of Gaussian networks. One of the proposed variants is the EGNA BGe [10]. In this variant the induction of the model is done by a scoring method that uses a Bayesian measure. The EGNA BIC [10] follows a similar scheme but uses the BIC metric for continuous domain and the EGNA ee [10] (Algorithm with Gaussian Network Estimation with Arcs Exclusion) uses independence detection to build the Gaussian network.
PolyEDA [11] is a combination of estimation algorithms of distributions and constraints with linear inequalities.
RECEDA [14] (Real-Coded Estimation of Distribution Algorithm) uses only the means and covariance matrix of the variables estimated from the selected promising individuals of a population, to generate offspring.
EBCOA [15] (Evolutionary Bayesian Classifier-based Optimization Algorithm) generates the probabilistic graphical model that will be applied for sampling the next population, taking into account the fitness function as a new variable.
CMA - ES [16, 17] (Covariance Matrix Adaptation Evolution Strategy) uses information embedded in the evolution path to accelerate the convergence. It is a completely derandomized self-adaptation scheme, which the full covariance matrix of the probability density function is adapted for the mutation of the objective parameter vector.
sEDA [18] (Screening EDA) identifies important variables and uses these to control the degree of covariance modeling in the Gaussian EDA model. The algorithm provides improved numerical stability and can use a smaller selected population.
On the other hand, a cellular EDA for discrete optimization is a collection of collaborative and decentralized EDAs, also called member algorithms that develop overlapping populations [12, 13]. A distinctive feature of this kind of algorithm is that they are decentralized at the level of the algorithms and selection in another evolutionary algorithm usually occurs at the recombination level. The organization of the cellular EDAs is based on the traditional structure of grids, where each grid contains a set of neighboring individuals, which form a cell.
Basic concepts
In this section the relevant concepts for the proposed algorithm like probabilistic graphics models, Gaussian networks, regularization of probabilistic parameters, learning strategy, neighborhoods and benchmark of continuous functions, are provided.
Probabilistic graphics models
The main characteristic of most EDAs (cellular or not) is the use of probabilistic graphic models to detect the dependencies between the variables of the problem to be solved. It is the most complex step lies within the estimation of the probability distribution.
The Graphical Models (MGs) are tools that allow representing joint probability distributions. Probabilistic Graphical Models (MGPs) are graphs in which the nodes represent random variables and the arcs represent conditional dependence relations. These graphs provide a compact way to represent the probability distribution [20].
The MGPs used by the EDAs vary depending on the domain of the problem variables. If these variables are discrete, Bayesian networks are used. If, on the contrary, they are continuous variables, Gaussian networks are used. There is the possibility of generating hybrid probabilistic models, adapted for problems with discrete and continuous variables, but its out of the scope of this paper.
Gaussian networks
Gaussian networks are described in [21] as Interaction Graph Models for the multivariate normal distribution. These models in the Graphical Gaussian Model (GGM) is based on conditional independence. They only contain non-directed arcs and this makes them not only one of the conceptually simplest models but also one of the most applied.
In the X data is assumed to be mutually independent, with a normal p-varied distribution N
p
(μ, Σ), a mean vector μ = (μ1, . . . , μ
n
)
T
and the defined positive matrix of variance-covariance Σ = (σ
ij
), where 1 ≤ i, j ≤ p. Using the formula σ
ij
= ρ
ij
σ
i
σ
j
, the covariance matrix can be decomposed into components of variance, with
In exponential terms, the alternative parameterization is given through canonical parameters that are defined as Ω = Σ-1 and β = Σ-1μ, so the multivariate normal density of the above equation can be redefined as:
The proposed algorithm CEGA is based on the estimation of the covariance matrix.
Regularization techniques are used frequently in statistical learning to obtain a more robust estimation of probabilistic models with a small prediction error. The regularized estimation model tries to reduce the general prediction error of the estimation model by reducing the large variance caused by the prediction of new samples, at the cost of introducing a small margin of error in the model.
The estimation model in the EDAs presents some characteristics that motivate the use of regularization techniques. The lack of adequate statistics can lead to the model becoming very partial in specific regions of the search space, this reduces its ability to generalize which is an important factor when sampling the model. The use of regularization can reduce the general error of the model estimated in the EDAs.
Another important aspect is the scalability of the EDAs with respect to the size of the problem since estimating the model of the probability distribution of large search spaces requires large populations, given that the estimation of the model and the subsequent sampling in the EDAs are large consumers of time, the performance of the algorithm can drop precipitously if the size of the population is very large. Estimating a comparable quality model using much smaller populations is an important requirement in these algorithms [22].
In [23] a discussion of the estimation technique with contraction or restriction, this gives the EDA the ability to build better models of the search distributions on small populations, was proposed. The merit of this contraction technique is that it improves the efficiency and precision of the estimation and provides a well-conditioned and positively defined covariance matrix, which is an important aspect to calculate its inverse. The idea of the estimation with contraction is simple, assuming that we have an unrestricted model of large dimensions and a reduced submodel with restricted dimensions, by adjusting each of the two different models to the corresponding observed data we obtain estimates. The unrestricted estimate will exhibit a relatively high variation due to the greater number of parameters that need to be adjusted, while its small-sized counterpart will have lower variance, but potentially it will also be considerable as an estimator of the true unrestricted model [23].
Learning strategy
A critical issue in a cellular EDA is the use of a strategy that they learn from the probabilistic model because they are usually not efficient from the evaluative point of view, which can affect the performance of the algorithm, so the learning of the structure and parameters from local populations, can be one of the alternatives to solve this problem. As The proposed algorithm CEGA uses the Shrinkage estimator algorithm from the covariance matrix of a data set [24] as learning operator.
Neighborhoods
In a cellular EDA the reproductive cycle is executed within each number of individuals of the local population, which is usually called a cell, they have their own local populations defined by neighboring subpopulations and at the same time, a cell belongs to many local populations. The set of all the cells defines a partition of the global population.
A neighborhood is a set of individuals that are neighbors to a given one, that is, they are located close to it in the population according to a given spatial topology of the grid [25]. The neighborhood of 5 individuals, commonly called NEWS (North, East, West, South), considers the central individual and the immediately superior, inferior, left and right. There are other neighborhoods, as in the case of One, L9, C9, C13 or compact C25 and C41, using a neighborhood of smaller radius causes the solutions to spread more slowly through the population, inducing a lower global selective pressure and maintaining greater genetic diversity than when using larger neighborhoods, as shown in Fig 1.
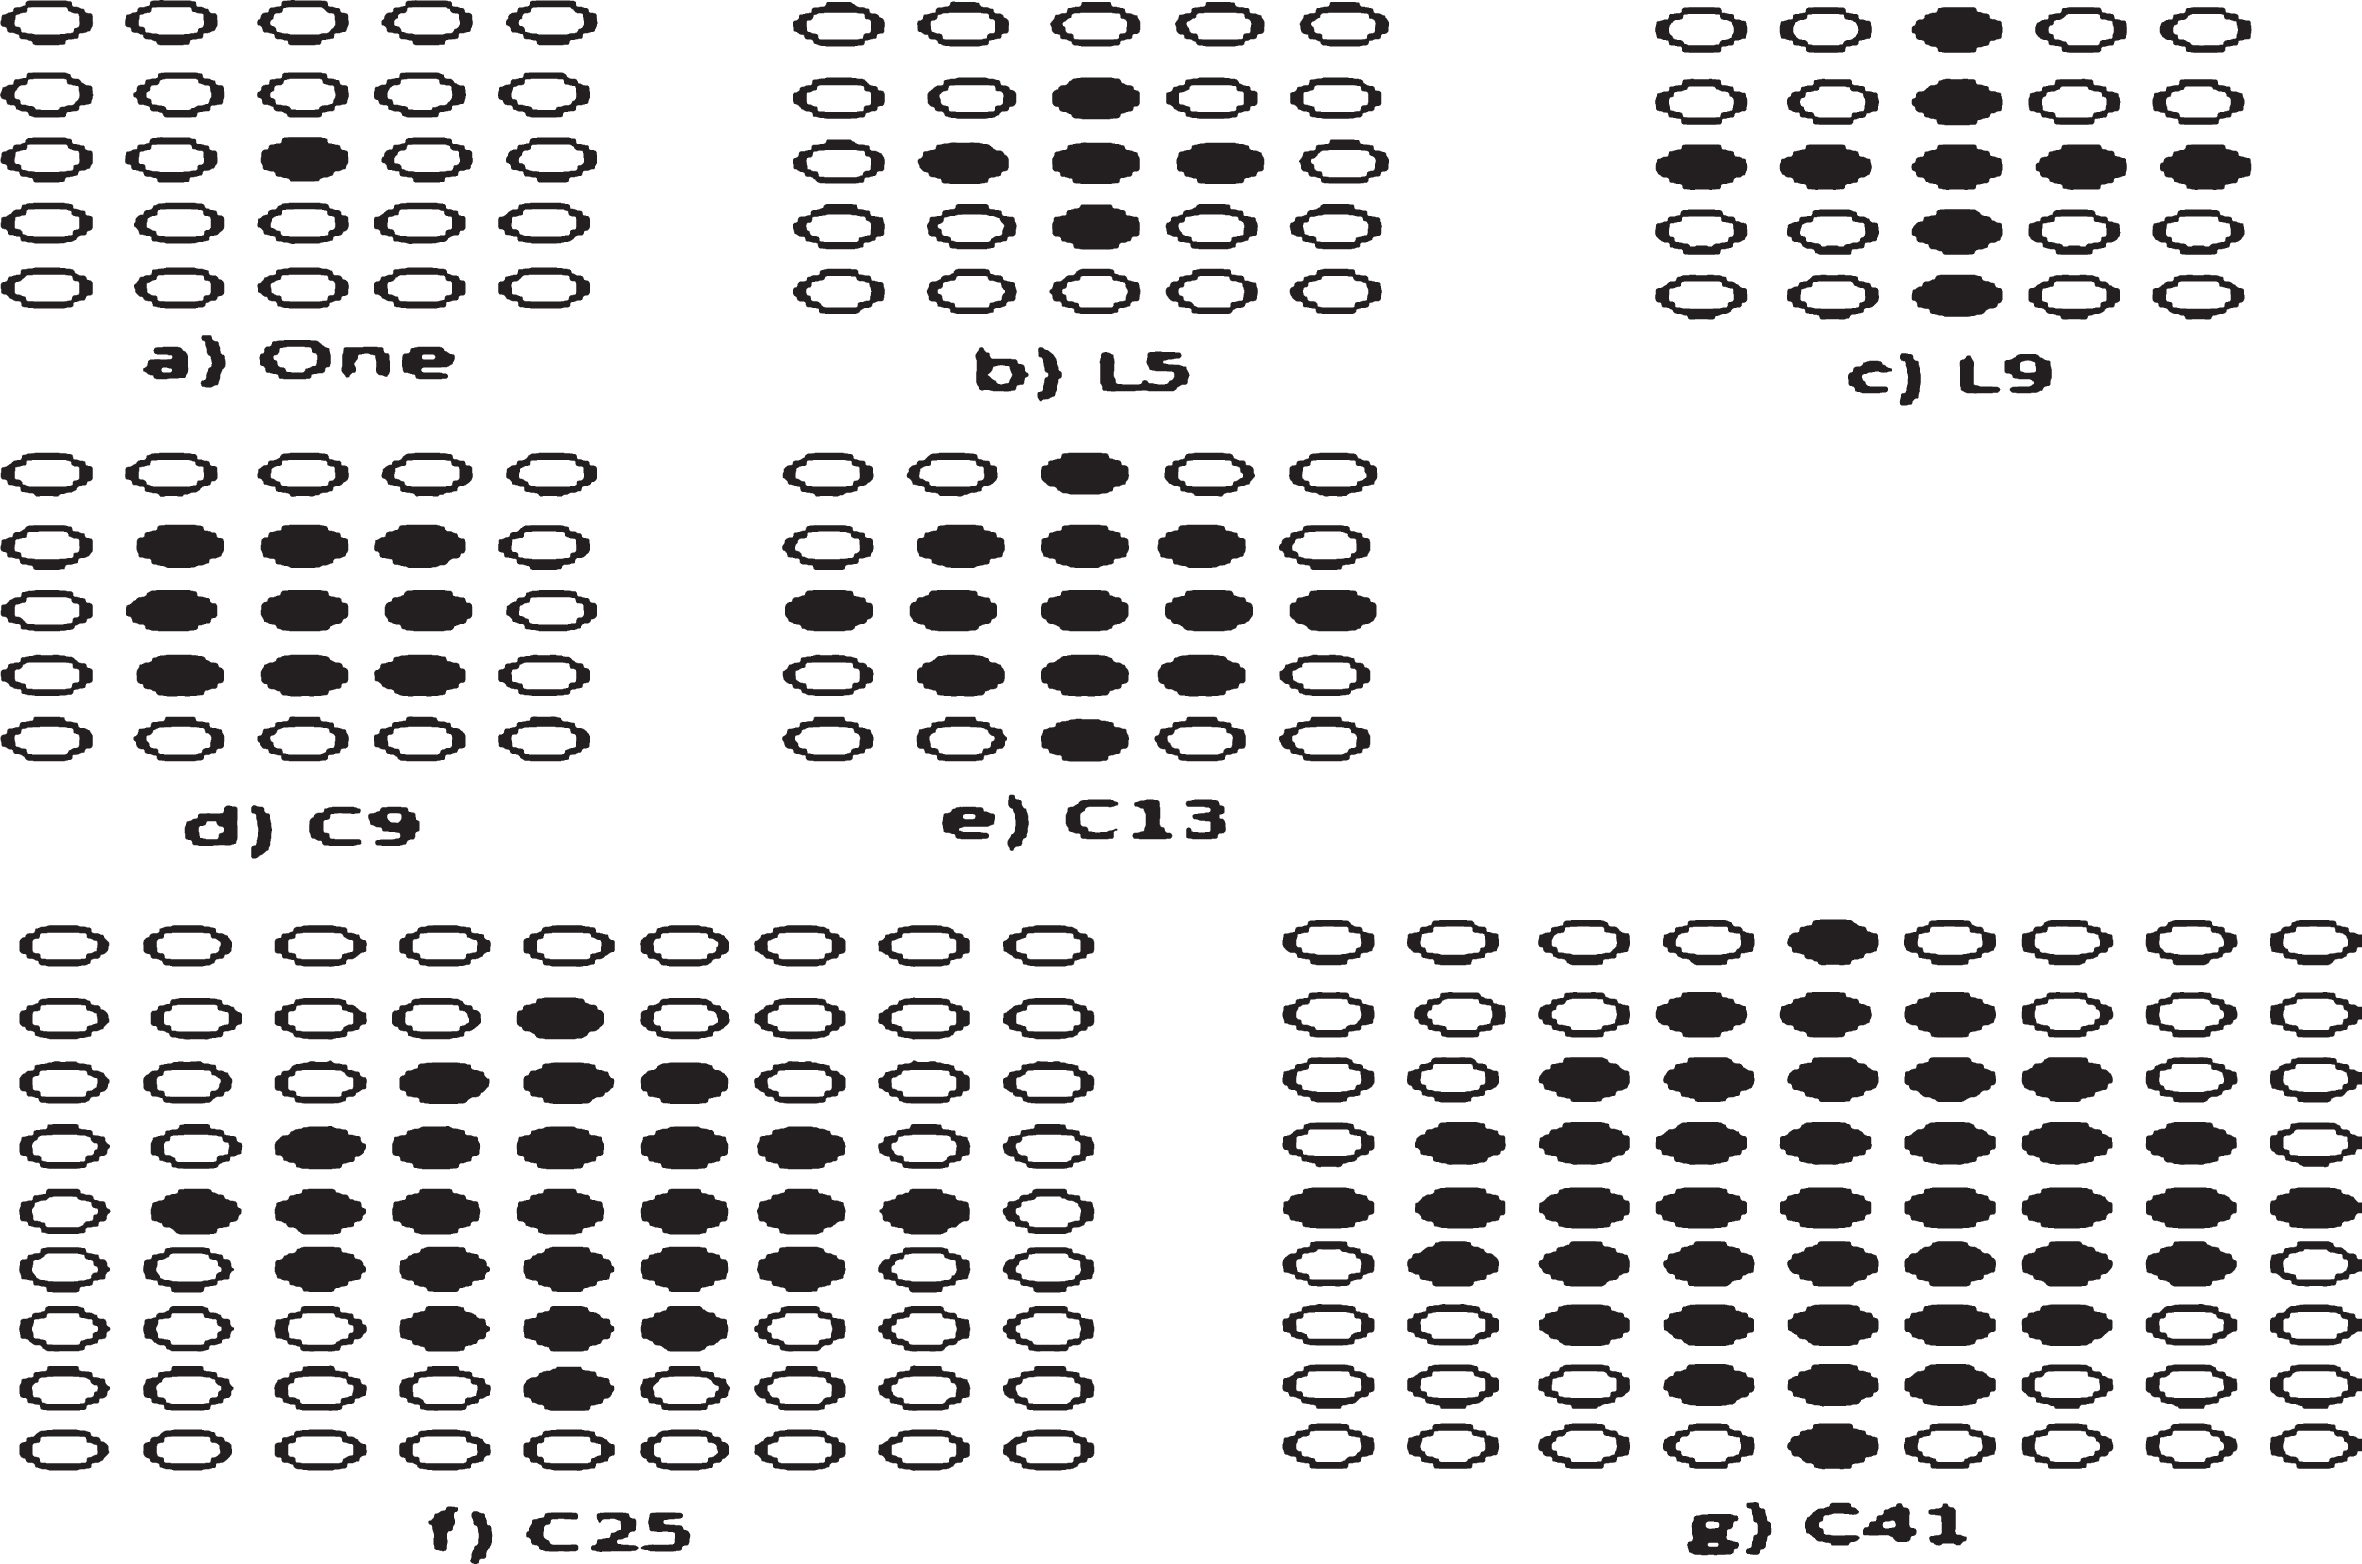
Representation of different neighborhoods.
The proposed algorithm CEGA uses the neighborhoods One, L5, L9, C9, C13, C25 and C41.
Let x = (x1, x2, ···, x
N
) be a N-dimensional vector,
Griewangk function:
Rastrigin’s function:
Rosenbrock’s function:
Sphere function:
Ackley’s function:
Starting from a population randomly generated, Cellular Estimation Gaussian Algorithm (CEGA) consists of loop of iterations until a termination criteria be met. For each iteration of CEGA exactly one iteration of all the member algorithms is done. Each of these member algorithms is responsible for updating exactly one subpopulation, and this is made by applying a local EDA model to the population composed of its individuals and those of its neighbor subpopulations (steps 5 to 7). The new individuals generated by the local learning and sampling steps a replaced in a temporal population (step 8). The successive populations replace each other at once (step 10). In this step, the old population can be taken into account (i.e., replacing a individuals if the new one is better) or not (always adding the new string to the next population). Finally, computing basic statistics in step 11.
The pseudo code of the proposed algorithm, CEGA, is presented in Algorithm 1.
1: t ← 1
2: GenerateNindividualsrandomly
3:
4:
5; Select locally M ≤ SizeOf (Neighborhood) × SizeOf (cell) individuals of the neighborhood
6: Estimate the Gaussian distribution G (x, t) of the M selected individuals
7: Generate SizeOf (cell) new individuals according to the distribution G (x, t)
8: Insert the generated individuals in the same cell of an auxiliary population
9:
10: Replace the current population with the auxiliary one
11: Compute and update the statistics
12: t ← t + 1
13:
Experimental results
In this section, the behavior of the proposed algorithm CEGA is evaluated. First, a comparison in terms of the approximation to the optimum and the numbers of iterations and evaluations needed, for different neighborhoods is presented over the continuous functions: Griewangk, Rastrigin’s, Rosenbrock’s, Sphere and Ackley’s. After that CEGA is compared with the other continuos EDAs reported in the literature for the same continuous functions.
To evaluate the behavior of the proposed algorithm CEGA, it was executed 25 times, for each objective function and each neighborhood shown in the Fig 1, using 1E - 8 as margin of error, 0.3 as truncation threshold and selection elitism of an individual. The dimension N of the vector x was set at 10. Table 1 shows the results (gray cells contain the best values). In addition to the optimal value obtained for each case, Table 1 shows, the amount of the evaluations of the fitness functions, and the standard deviation of both for the 25 executions.
Results of CEGA for the functions: Grienwankg, Rastrigin, Rosenbrock, Sphere and Ackley
Results of CEGA for the functions: Grienwankg, Rastrigin, Rosenbrock, Sphere and Ackley
The obtained results show that CEGA for the Grienwangk function, the L9 neighborhood yielded the best result, with the value of the found optimum being -1.08E - 13. On the other hand, the best result for the Rastrigin function was using the C25 neighborhood, with an optimum value of -3.41E - 02 obtained. Moreover, for the Rosenbrock function, the neighborhood C41 yielded the best result, with the value of the found optimum being -5.59E - 11. In addition, for the Sphere function, the best neighborhood was C41, with an optimum value of -3.82E - 02. Likewise, the best result for the Ackley function was the neighborhood C41, with an optimum value of -4.44E - 16.
To compare the behavior of the proposed algorithm CEGA with the other continuous EDAs reported in the literature (RECEDA [14], EGNA BGe [10], EGNA ee [10], EMNA global [9], sEDA[18], EBCOA NB [15], UMDA c [4], MIMIC c [8], CMA - ES [16, 17]), all algorithms was executed 25 times, for each objective function with similar conditions. Table 2 shows the results (gray cells contain the best values) 1 .
Results of CEGA and other continuous EDAs reported in the literature for the functions: Grienwankg, Rastrigin, Rosenbrock, Sphere and Ackley
As observed in Table 2, the proposed algorithm CEGA yields the best performance for all fitness function. CEGA with neighborhood C41 yields superior performance than other algorithms reported in the literature, for the functions: Ackley, Sphere, Rosenbrock, while CEGA with neighborhood L9 was the best for the Griewangk’s function and CEGA with neighborhood C25 was the best for the Rastrigin’s function, evidenced by the lowest optimum value, achieved with, the least number of evaluations.
With the experimental results of CEGA, two alternative methods were carried out based on non-parametric tests [27–29]: Application of Iman and Davenport’s test [30] and Holm’s method [31] as post hoc procedures. The first test can be employed to see whether there are significant statistical differences among the algorithms in certain groups (three or more algorithms). If differences are detected, then Holm’s test is used to compare the best ranking algorithm (control algorithm) with the remaining ones. Application of the Wilcoxon [32] matched-pairs signed-ranks test. With this test, the results of two algorithms can be directly compared.
Analysis of neighborhoods
For this comparison, the amount of the evaluations of the fitness functions is taking into account for the continuous functions: Ackley, Sphere, Griewangk, Rosenbrock and Rastrigin. Wilcoxon’s test is applied to compare if exist the difference statistically significant or not between different Neighborhoods. In this test, the values of R- and R+ (associated with the control algorithm in comparison) are specified (the lowest ones, which correspond to the worst results), together with the p-values computed for this test and whether the hypothesis is rejected (the p-value is lower than the significance value) or not. The results of this test are showed in the Table 3.
Results obtained by the Wilcoxon’s test for all algorithms
Results obtained by the Wilcoxon’s test for all algorithms
It can be seen from Table 3 that CEGA - one obtained better results than the CEGA - L5 (the R+ values are higher than the R- ones), but this difference is not statistically significant, which p - value > 0.05. Moreover, the CEGA - L9 obtained better result than CEGA - one, CEGA - L5 and CEGA - C9, but this difference is not statistically significant with regard to CEGA - one, while it was statistically better than CEGA - L5 and CEGA - C9. Additionally, CEGA - C9 is not statistically better than CEGA - one, but is statistically significant than CEGA - L5. The CEGA - C13 was statistically better than CEGA - L5, but this difference is not statistically significant with regard to CEGA - one, CEGA - L9 and CEGA - C9. In addition, CEGA - C25 is not statistically better than CEGA - one, CEGA - L5, CEGA - L9, CEGA - C9 and CEGA - C13. Finally, CEGA - C41 is statistically significant than CEGA - one, CEGA - L5, but this difference is not statistically significant with regard to CEGA - L9, CEGA - C9, CEGA - C13 and CEGA - C25.
In this study, the non-parametric tests are applied to analyze the behavior of CEGA, in order to obtain the best algorithm, taking into account the fitness evaluations for the continuous functions: Ackley, Sphere, Griewangk, Rosenbrock and Rastrigin. In Table 4 and Fig. 2 the average ranking based on the Friedman [33] test of the all algorithms is showed (gray cell in table contains the best rank).
Average ranking of the algorithms based on the Friedman test
Average ranking of the algorithms based on the Friedman test
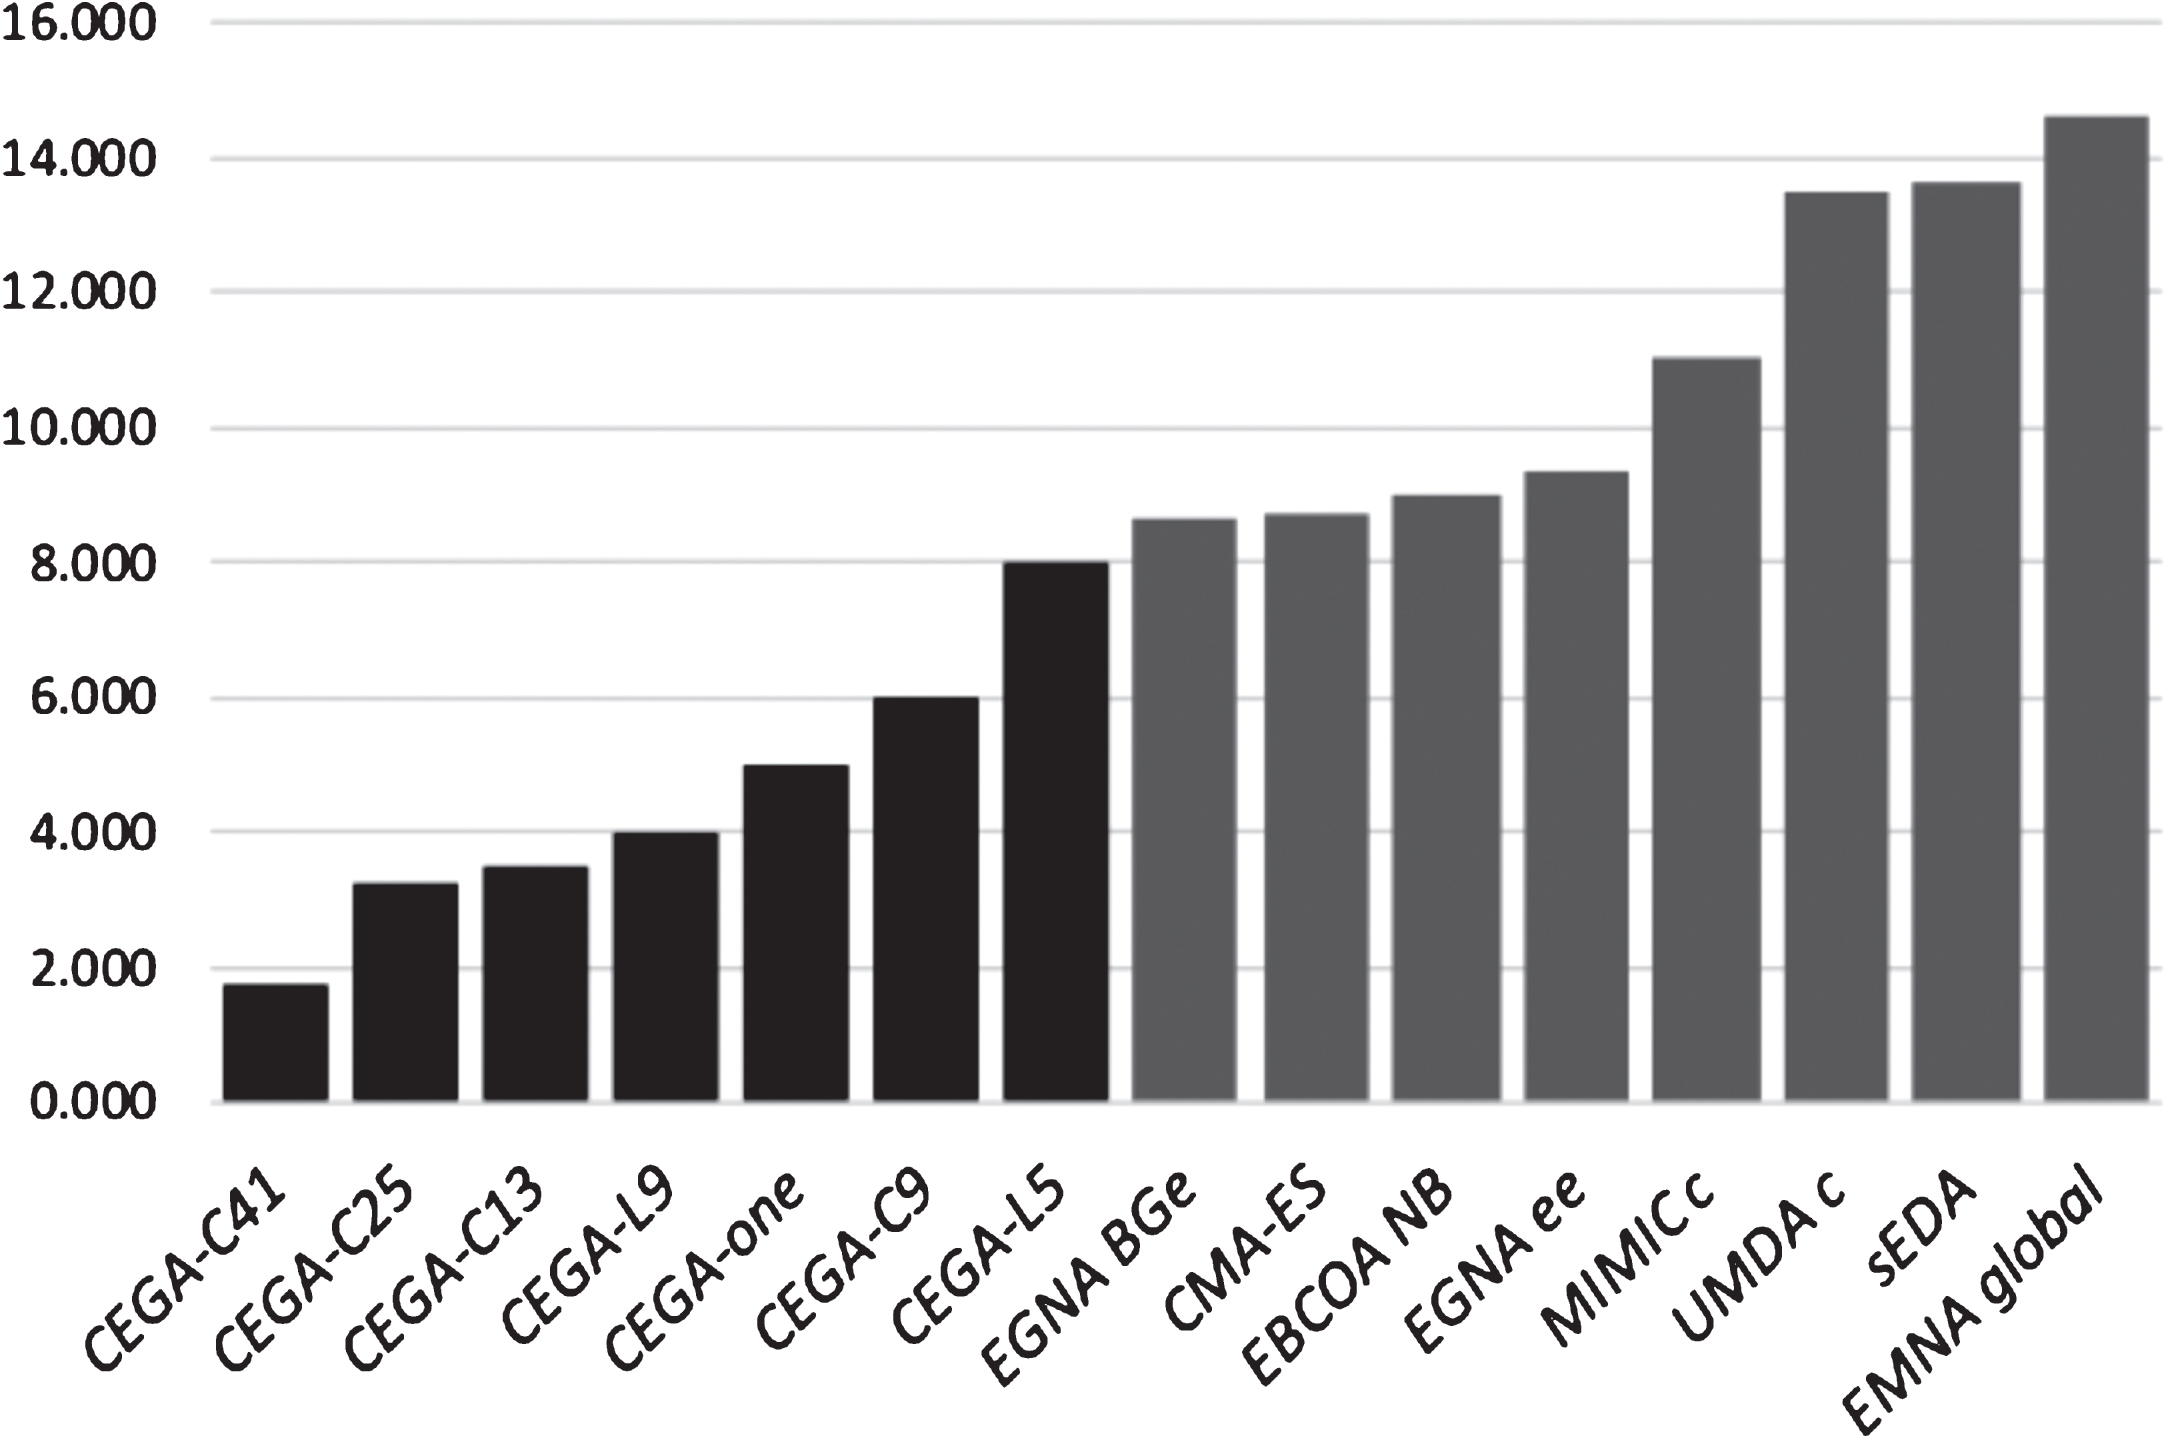
Average ranking of the algorithms based on the Friedman test.
As can be observed, the best ranking is obtained by CEGA - C41, the second place, CEGA - C25 and third, CEGA - 13, which had good development.
Iman-Davenport’s test is carried out (employing F-distribution 14 degrees of freedom for Nds = 45.9), in order to find statistical differences among the algorithms, obtaining a p - value of 0.000029. The results of Iman-Davenport’s test show that CEGA - 41 presents indeed significant performance differences in the group (p - value < 0.05).
Holm’s test is applied to compare CEGA - C41 with the rest of algorithms; for this test, the algorithms are ordered in descending order, according to rank. Table 5 contains all the computations associated with Holm’s procedure (
Holm’s test applied to compare CEGA - C41 with the rest of algorithms
For this comparison, the results obtained with CEGA - C41 are significantly superior to EMNA global , sEDA, UMDA c , MIMIC c , EGNA ee , EBCOA NB , CMA - ES, EGNA BGe and CEGA - L5, which the test is rejected, but the differences are insignificant with CEGA - C9, CEGA - one, CEGA - L9, CEGA - C13, CEGA - C25, which the test is accepted.
In this paper, the Cellular Gaussian Estimation Algorithm (CEGA) for solving continuous optimization problems was proposed. The experimental results showed that CEGA can reduce the number of evaluations of the fitness functions in solving continuous optimization problems. This was evidenced through the results obtained when studying the different neighborhoods of local populations. In addition, it was shown that CEGA decreases number of the evaluations of the fitness functions, compared to other EDAs in the literature for solving continuous optimization problems.
From statistical analysis performed, it can be concluded that the use of different neighborhoods by CEGA does not produce significantly better result, according to Wilcoxon’s test. However, CEGA using any neighborhoods, has better performance than the other continuous EDAs in the literature according to the ranking determined by the Friedman’s test, taking into account the fitness evaluations.
The best ranking position was achieved by CEGA using the neighborhood C41 and the Iman-Davenport’s test shows that this choice is significantly superior to other continuous EDAs in the literature.
As future work, applying and adapting CEGA for practical problems where there are dependencies amongst the variables and the number of evaluations of the fitness functions is restricted, will be an interesting and imperative research direction. Another interesting work will be compare CEGA with other algorithms like Differential Evolution Algorithm, Particle Swarm Optimization and Firefly Algorithm in this kind of problems.
Footnotes
The symbol * represents that there are not results reported in the literature for this algorithm and fitness function.