
Abstract
Using the panel data for China’s 30 provinces from 2008 to 2016, this paper analyzes the impact of producer services agglomeration on green economic efficiency at its spillover effects, through spatial autocorrelation test and the establishment of spatial econometric models. It comes to the results as follows: First, China’s regional green economic efficiency is significant positive spatial dependence. Second, the producer services specialized agglomeration not only inhibits the green economic efficiency of one region but also has significantly negative spatial spillover effects on adjacent areas, while the producer services diversified agglomeration only enhance the green economic efficiency in the region. Third, the impact of the agglomeration mode selection of producer services industry on green economic efficiency in the eastern region is basically consistent with the empirical analysis at the national level, while the green economic efficiency improvement in the central region only benefits from producer services specialized agglomeration, and the green economic efficiency in the western region is not significantly affected by the producer services agglomeration mode selection.
Keywords
Introduction
Green Economic Efficiency (GEE) comprehensively considers the cost of economic growth, resource conservation and environment. The efficiency value obtained is the “green” economic efficiency value obtained by integrating resource input and environmental loss value on the basis of traditional economic efficiency. The key of green economy development is to improve the efficiency of green economy, that is, to improve the quality of economic growth [1]. Under the dual constraints of resources and environment, it has become a hot research topic to find space to improve the efficiency of green economy and to explore the main factors affecting the improvement of the efficiency of green economy. A large number of studies have shown that the decisive factor affecting the efficiency of green economy is the transformation and upgrading of industry [2]. The Guiding Opinions on Accelerating the Development of Productive Services and Promoting the Adjustment and Upgrading of Industrial Structure, adopted in July 2014, clearly pointed out that, guided by the needs of industrial transformation and upgrading, we should further accelerate the development of Productive Services and promote the gradual transformation of China’s industries from production-oriented to production-oriented. In the past 40 years of reform and opening up, the modern service industry with producer services as the main body has maintained a good momentum of development. In 2014, the proportion of added value of producer services in China’s GDP has exceeded 1/4, which has made an important contribution to the stable and healthy development of the economy under the new normal conditions. At the same time, producer service industry has the characteristics of high degree of industrial relevance and strong cross-border service, and there is a widespread phenomenon of agglomeration. All provinces and municipalities in China also attach great importance to the development of producer service agglomeration areas and service functional areas [3]. From the perspective of factor agglomeration effect, producer services agglomeration has obvious spatial spillover effect. It can not only enhance the productivity of the industry itself, but also create a good environment for comprehensive industrial development. Therefore, the focus of this paper is to introduce the spatial effect into the analysis framework of producer services agglomeration and green economic efficiency, to explore the spatial spillover effect of producer services agglomeration on regional green economic efficiency and its effective mode of action, and to provide theoretical reference for the formulation of producer services development policies and the realization of green development in the region.
Related work
With the shift of industrial agglomeration research from industry to service industry, service industry has gradually replaced traditional industry as an important driving force for regional economic development. Compared with manufacturing industry, service industry has a strong spatial agglomeration effect, and has a significant impact on economic growth and its quality through technological progress [4]. At present, most of the literature on service industry agglomeration mainly focuses on the evaluation method of service industry agglomeration, the theoretical mechanism of service industry agglomeration and the influencing factors of service industry agglomeration, etc. [5]. A few of the literature is to analyze the mechanism of the role of producer service industry agglomeration in promoting economic efficiency. Generally, the conclusions of these studies are mainly divided into two kinds: the first conclusion is that the agglomeration of producer services significantly promotes economic efficiency. Eswaran et al. [6] believe that the agglomeration of producer services can help improve the investment environment, accelerate technological innovation and technological progress, and further promote labor productivity and economic growth by attracting high-level talents to the region. Aslesen et al. [7] found that the agglomeration of producer services contributes to the emergence of new technologies and thus to the acceleration of economic growth, while the rapid economic growth will have more demand for new technologies, which in turn will promote the agglomeration and development of producer services. Wood [8] pointed out that increasing the agglomeration scale of producer services will help to improve the efficiency of technology diffusion, thus guiding producer services enterprises to use new technologies and new technologies to enhance the potential of economic growth. In addition, Chinese scholars also support the conclusion that the agglomeration of producer services can promote economic growth. Zhang Haoran [9] based on the panel threshold model, proves that the agglomeration of high-end producer services can promote urban economic efficiency, while the agglomeration of low-end producer services has no significant impact on urban economic efficiency. Huiwei et al. [10] found that the agglomeration of producer services can significantly improve labor productivity, but the agglomeration effect has obvious regional differences, which is only conducive to the improvement of labor productivity in the eastern and Western regions. The second conclusion is that the choice of agglomeration mode of producer services has significant difference on economic efficiency. Marshall [4] holds that there is a positive correlation between enterprise agglomeration and technological innovation efficiency in the same industry, that is, the externality of MAR brought by specialization agglomeration. Jacobs [11] believes that the more diversified industrial agglomeration environment, the more beneficial to the efficiency of technological innovation, that is, the Jacobs externality brought by diversified agglomeration. Rivera-Bratiz [12] emphasizes that the diversity of the urban service sector can lead to a greater agglomeration economy. From the perspective of consumption, diversified services can help to increase consumer welfare; from the perspective of production, the specialization of producer services can help to improve urban labor productivity. Hanfeng et al. [13] set up an econometric model from the comprehensive perspective of Marshall, Jacobs externalities and new economic geography, proving that the spatial agglomeration of producer services has obvious technology spillover effect on economic growth. The impact of specialization agglomeration on economic growth increases from east to west, while the impact of diversification agglomeration decreases from east to west [16–18].
In summary, domestic and foreign scholars have systematically studied the mechanism of producer services agglomeration on economic growth and its efficiency, but there are still some problems as follows: First, a large number of literatures focus on the impact of producer services agglomeration on economic growth, and few literatures discuss the relationship between producer services agglomeration and green economic efficiency [19]. The traditional index GDP, which is used to evaluate the economic performance of a certain region, only pays attention to the economic quantity without considering the resource constraints of production and the negative effects on the environment, which does not meet the requirements of sustainable economic development. Secondly, insufficient attention has not been paid to the spatial spillover effect of the agglomeration of producer services, especially the spillover effect of the agglomeration of producer services on the improvement of green economic efficiency in adjacent areas [20, 21]. With the rapid development and diffusion of information technology, the productive services needed by the economic development of a region come not only from the region, but also from other regions, especially the surrounding areas [22]. Therefore, on the basis of the existing research, from the perspective of spatial econometrics, this paper makes an empirical study on the relationship between producer services and green economy efficiency improvement by using the spatial panel model [23].
Research design
Spatial panel model
Anselin [14] first studied the spatial econometric model based on cross-sectional data. Later, it was found that the spatial lag term and spatial error term could be incorporated into the spatial panel model when there was spatial dependence between sample units, namely, the spatial lag model (SLM) based on panel data and the spatial error model (SEM). Lesage et al. [15] extended the spatial lag model and proposed a spatial Durbin (SDM) model, which includes both the lag term of the interpreted variable and the lag term of the interpreted variable.
Spatial lag model (SLM) reflects the essential spatial correlation. Its economic implication is that the subject only considers the influence of explaining the variable itself, but it is difficult to predict the change trend of the variable. If the influence caused by spatial structure is added to the model, the impact of spatial effect can be well controlled. The basic form of the model is as follows:
In formula (1), y
it
the interpreted variable (i = 1, 2, . . . , N ; t = 1, 2, . . . , T) representing unit I in t period, β the interpreted variable 1 × K represented by the corresponding parameter vector β, and the interaction
Among them, w ij represents the component elements of dimension non-negative spatial weight matrix W set according to the characteristics of sample space units; ρ is an endogenous parameter to measure the spatial interaction between interpreted variables; ɛ it is a random error term; μ i represents space-specific effects; and λ t represents time-specific effects.
Spatial error model (SEM) reflects the spatial correlation and spatial perturbation correlation. Its economic significance is that the impact generated in a spatial unit will be transmitted to the adjacent spatial unit in the form of a special covariance structure, which has a long lasting effect, and the lasting effect is weakening continuously, that is, the spatial impact has a high-order effect [24]. The mathematical expression of the model is as follows:
Formula (2) δ denotes the spatial error correlation coefficient and
Spatial Durbin Model (SDM) considers not only the spatial correlation of interpreted variables, but also the spatial correlation of interpreted variables. That is to say, the interpreted variables in a region are influenced not only by the interpreted variables in the region, but also by the lagged interpreted variables and the lagged interpreted variables in other regions. The spatial Durbin model is constructed as follows:
Formula (3) is a space lag exogenous variable of dimension, similar to that of dimension vector. It should be emphasized that according to the OLS model, the spatial econometric model will be affected by three aspects: endogenous, exogenous and error. The direct effect is the influence of endogenous variables on the interpreted variables, and the indirect effect is the influence of exogenous variables on the interpreted variables [16]. In order to reasonably explain the regression coefficients of spatial econometric models, Lesage et al. (2009) proposed a partial differential method of spatial regression models. The effects of explanatory variables on the interpreted variables were divided into direct effects and indirect effects. The sum of the two effects was total effects. The specific forms of decomposition are as follows:
By presetting the number of sums on the right side of the equation W ρ, we can avoid the tedious matrix (I - ρW) -1 inversion process and better reflect the direct and indirect effects of each sampling.
When using spatial measurement method, we first need to test the spatial correlation of the variables to be interpreted. Spatial correlation test methods are mainly divided into two categories: (1) error correlation test including spatial error autocorrelation or spatial error moving average, such as LM-error and Robust LM-error; (2) spatial lag correlation test, such as LM-lag and Robust LM-lag. In addition, some statistics can not only test the spatial error correlation between objects, but also test the spatial lag correlation, such as spatial correlation Moran’s I test and Geary test. At present, Moran’s I statistic is the most commonly used method of spatial correlation test. Moran’s I statistics can be divided into global Moran’s I statistics and local Moran’s I statistics, in which global Moran’s I statistics are used to investigate the global spatial autocorrelation of the subjects, while local Moran’s I statistics are used to reflect the local spatial distribution characteristics of the subjects.
The global Moran’s I statistic was first proposed by Moran in 1948. Its expression is as follows:
Formula (5),
Standardized Moran’s I statistics are:
In formula (7), the expected value of the Moran’s I index is:
The variance of Moran’s I index is:
Formula
The value of Moran’s I statistic is generally between [-1,1], and greater than 0 means positive spatial correlation, that is, high value is adjacent to high value, low value is adjacent to low value; less than 0 means negative spatial correlation, that is, high value is adjacent to low value. The closer to 1, the closer the relationship between spatial units is, the closer to -1, the more significant the difference between spatial units or the less centralized the distribution is, and the closer to 0, the more random the spatial distribution is, and there is no spatial autocorrelation.
Local Moran’s I statistics are defined as:
In formula (10), the high (low) value of positive region I is surrounded by the high (low) value around it, while the negative region I is surrounded by the low (high) value around it.
On the basis of local Moran’s I statistics, Moran scatter plots can be drawn to further reflect the diffusion or polarization between a region and its adjacent regions. The first and third quadrants in Moran scatter plot represent the positive spatial correlation of observations, the second and fourth quadrants represent the negative spatial correlation of observations, and the first quadrant represents the high-value agglomeration (H-H), i.e., the high-value regional units are surrounded by the high-value regions, reflecting the diffusion effect in spatial correlation; the second quadrant represents the low-high-value agglomeration (L-H), indicating the observation value. The low region unit is surrounded by the high value area, and the transition characteristics are obvious; the third quadrant represents the low value agglomeration (L-L), which indicates that the low observation area unit is surrounded by the low value area; the fourth quadrant represents the high and low value agglomeration (H-L), which shows that the high observation area unit is surrounded by the low value area, and reflects the polarization effect in spatial correlation.
Calculation of Green Economy Efficiency
(1) Measuring and calculating method
The commonly used methods for estimating economic efficiency include stochastic frontier analysis (SFA) and data envelope analysis (DEA), in which the SFA method must set the specific form of production function and error items in advance, which may lead to the deviation of estimation results, while the non-parametric DEA method can avoid this situation. However, traditional DEA methods such as BCC, CCR and so on are radial or angular. They do not fully consider the relaxation of input or output, nor can they accurately measure the efficiency value with unexpected output. To this end, Tone [18] proposed a method based on Slacks-based Measure (SBM) to evaluate the relative efficiency of decision making units. Unlike the traditional DEA model, the SBM model directly introduces relaxation variables into the objective function, so that its economic interpretation is not only to maximize the benefits, but also to maximize the actual profits. It not only overcomes the problem of input-output relaxation, but also solves the problem of measuring the efficiency of unexpected output. In order to further distinguish efficient decision-making units, this paper uses Super SBM-DEA model proposed by Tone [19] to measure green economic efficiency.
Tone did not give a programming formula for the SBM super-efficiency model with bad output, but combined with the SBM model, the super-efficiency SBM model with unexpected output can be deduced. There are n DMUs, each of which contains input m, expected output and non-expected output. Vector forms are expressed as x ∈ R
m
, y
d
∈ Rr1 and y
u
∈ Rr2 are defined as:
Then, the mathematical expression of the SBM model is as follows:
Formula (14) shows that DMU is DEA effective if and only if ρ = 1, that is w- = 0, w
d
= 0, w
u
= 0. DMU is DEA effective; ρ < 1 then DMU is DEA ineffective, and efficiency can be improved by adjusting input, expected output and non-expected output. If the decision making unit is efficient, the super-efficient SBM model can be expressed as follows:
(2) Indicator selection and data description
Due to the serious lack of statistical data in Hong Kong, Macao, Taiwan and Tibet, this paper takes 30 provinces, municipalities and autonomous regions in mainland China as production decision-making units, and the provincial annual data from 2008 to 2016 as sample data. Four kinds of indicators are needed to measure the efficiency of green economy: non-resource input (capital stock, labor), resource input (energy resources), expected output (GDP), and non-expected output (industrial “three wastes” emissions). Among them, the capital stock is calculated by the perpetual inventory method, and the data are from China Statistical Yearbook. Labor input is measured by the number of employed people in provinces and cities at the end of the year. The data are from the China Population and Employment Statistics Yearbook. Energy input is expressed by converting the total energy consumption of provinces and cities into standard coal. The data are from China Energy Statistics Yearbook. The gross domestic product (GDP) is based on 2008 and is replaced by the actual value of the consumer price index (CPI) converted by provinces and cities. The data are from the China Statistical Yearbook. Industrial “three wastes” include industrial wastewater, industrial waste gas and industrial solid wastes. The comprehensive pollution index is calculated by using the entropy method as an unexpected output. The data are from the China Environmental Statistics Yearbook.
Explanatory variables
(1) Core explanatory variables. The agglomeration of producer services. For producer services, Howells et al. [20] defines the service object and the type of service included, and considers that producer services are industries that provide services to other companies, such as providing commercial services such as banking, finance, advertising design, market research, as well as scientific services such as law, accounting, research and development. Marshall and others [21] believe that producer services are services that provide services related to personal support, information consultation and physical goods, including R&D, media, commodity sales, equipment maintenance and repair, etc. Based on the existing research and combined with the statistical caliber of employment in different provinces and municipalities, six industries, namely “transportation, warehousing, post and telecommunications industry”, “leasing and business services industry”, “information transmission, computer services and software industry”, “financial industry”, “real estate industry”, “scientific research, technicalservices and geological exploration industry”, are added together to represent producer services. Considering the availability of data and the consistency of data, based on the practice of Yu Binbin et al. (2014) [22], this paper uses RZ index and RD index to express the degree of specialization and diversification of producer services respectively. The specific calculation method is as follows:
Among them, S ji the number of employees in productive service industry J in I province accounts for the proportion of the total number of employees in that province, S i while the number of employees in productive service industry J in all provinces accounts for the proportion of the total number of employees in the whole country.
(2) Control variables. The level of economic development (EL), Rapid economic growth provides material basis for environmental pollution control, technological innovation and R&D funds. The logarithm of per capita GDP is used to measure the level of economic development. Industrial structure (IS), Generally, the larger the proportion of tertiary industry, the more conducive to the improvement of green economic efficiency. The industrial structure is represented by the proportion of the gross output value of the tertiary industry to GDP. Foreign direct investment (FDI). FDI inflows may improve local production and sewage treatment through technology spillovers, or they may be pollution transfer. FDI is expressed by the proportion of FDI to GDP. Investment in Pollution Control (ENV). The government plays an important role in dealing with energy and environment problems. Investment in environmental pollution control is an important indicator reflecting the government’s efforts to solve pollution problems. Therefore, the proportion of local fiscal expenditure on environmental protection in the general budget of local finance is used to measure the intensity of pollution control in various regions. Urbanization level (UR). Compared with rural areas, cities often have technological advantages in improving resource utilization efficiency and pollution control level, so urbanization level may have a certain impact on green economic efficiency. The urbanization level is measured by the proportion of urban population to the total population at the end of the year. The data of control variables come from the statistical yearbooks of provinces and municipalities.
Spatial autocorrelation test
Firstly, we use Moran’s I method to test the global spatial correlation of green economic efficiency in China. The specific results are shown in Table 1. Energy resources in China was shown in Fig. 1.
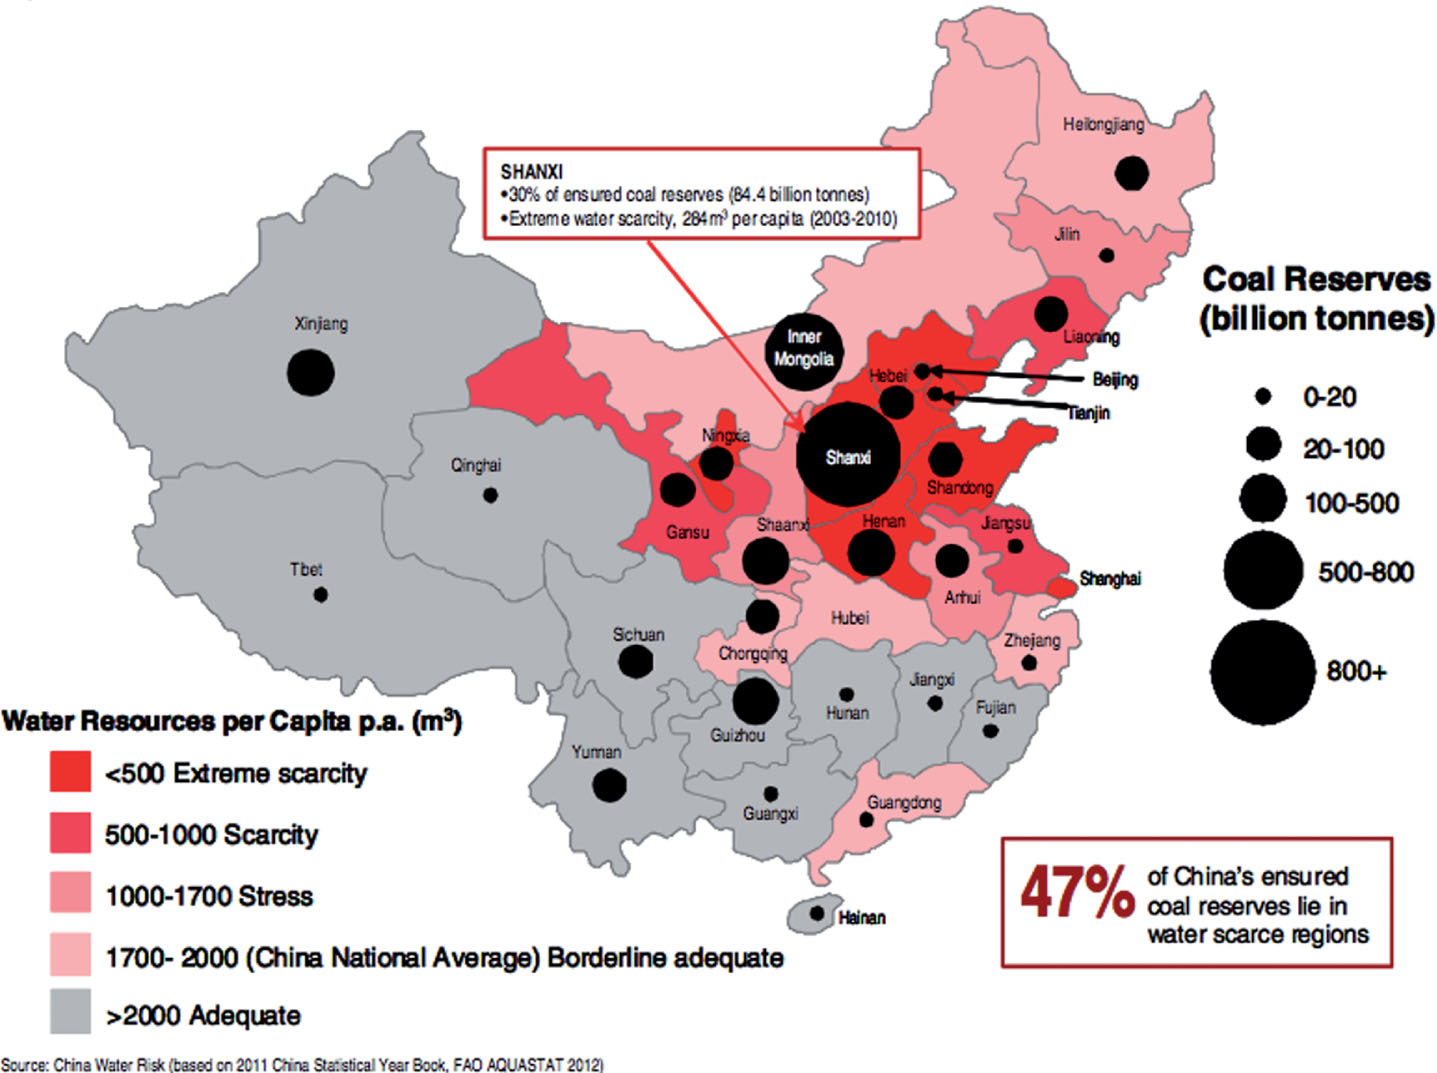
Distribution of Energy Resources in China.
Moran’s I Spatial Autocorrelation Test Results of China’s Provincial Green Economic Efficiency (2008-2016)
It can be seen that the global Moran’s I of China’s green economic efficiency in 2008-2016 is greater than 0, and all have passed the significant test. This shows that there is a significant positive spatial correlation between the green economic efficiency in all regions of China. That is to say, the spatial distribution of China’s provincial green economic efficiency is not in a completely random state, but shows a similar level of efficiency. The provinces tend to be spatially concentrated. In order to further visualize the types and spatial distribution of local spatial correlation of provinces and cities, Figs. 2–5 gives the local Moran scatter charts of green economic efficiency of China’s provinces and cities in 2007, 2010, 2013 and 2016 respectively.

Moran scatter plot of provincial green economic efficiency in 2007.

Moran scatter plot of provincial green economic efficiency in 2010.
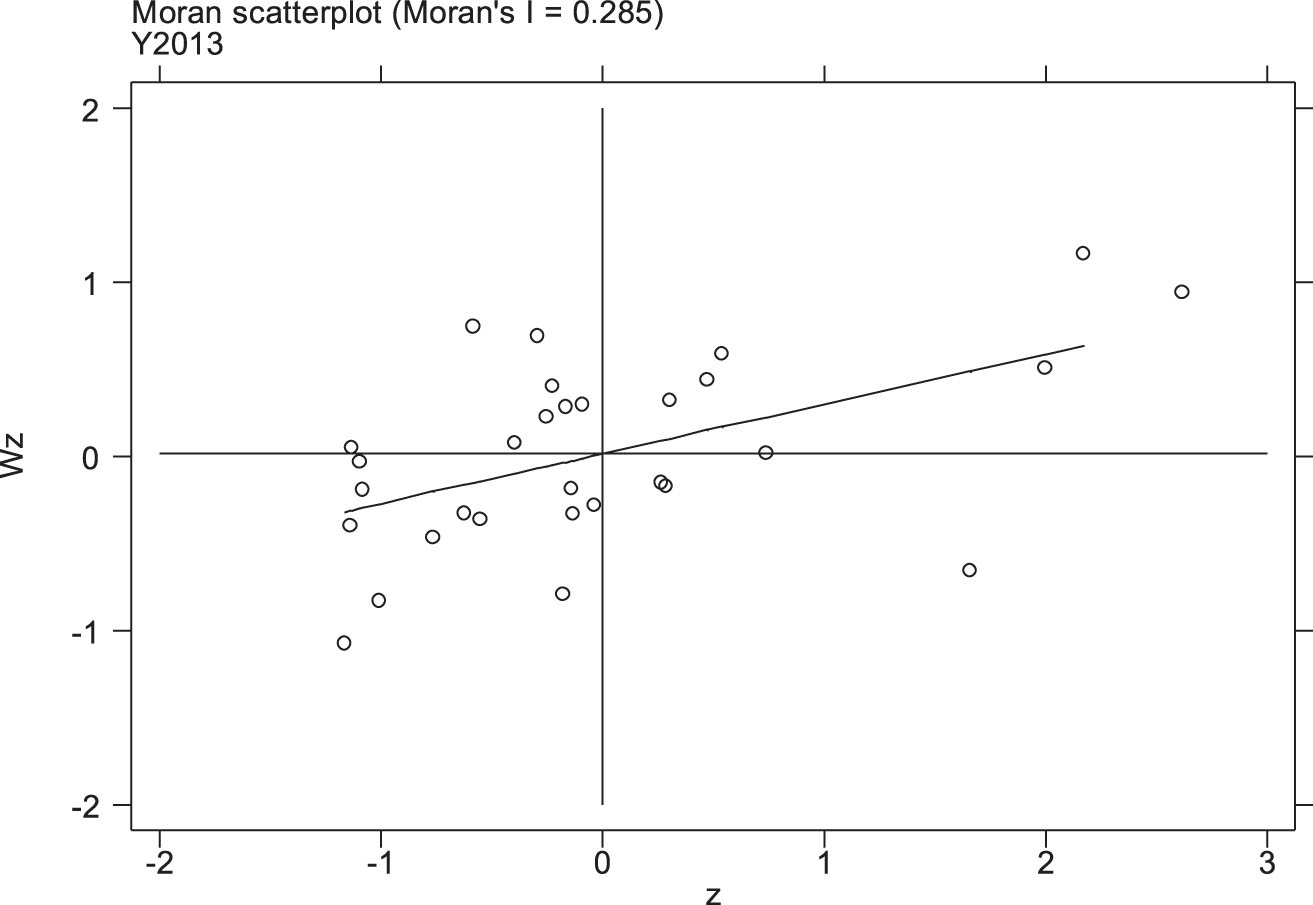
Moran scatter chart of provincial green economic efficiency in 2013.
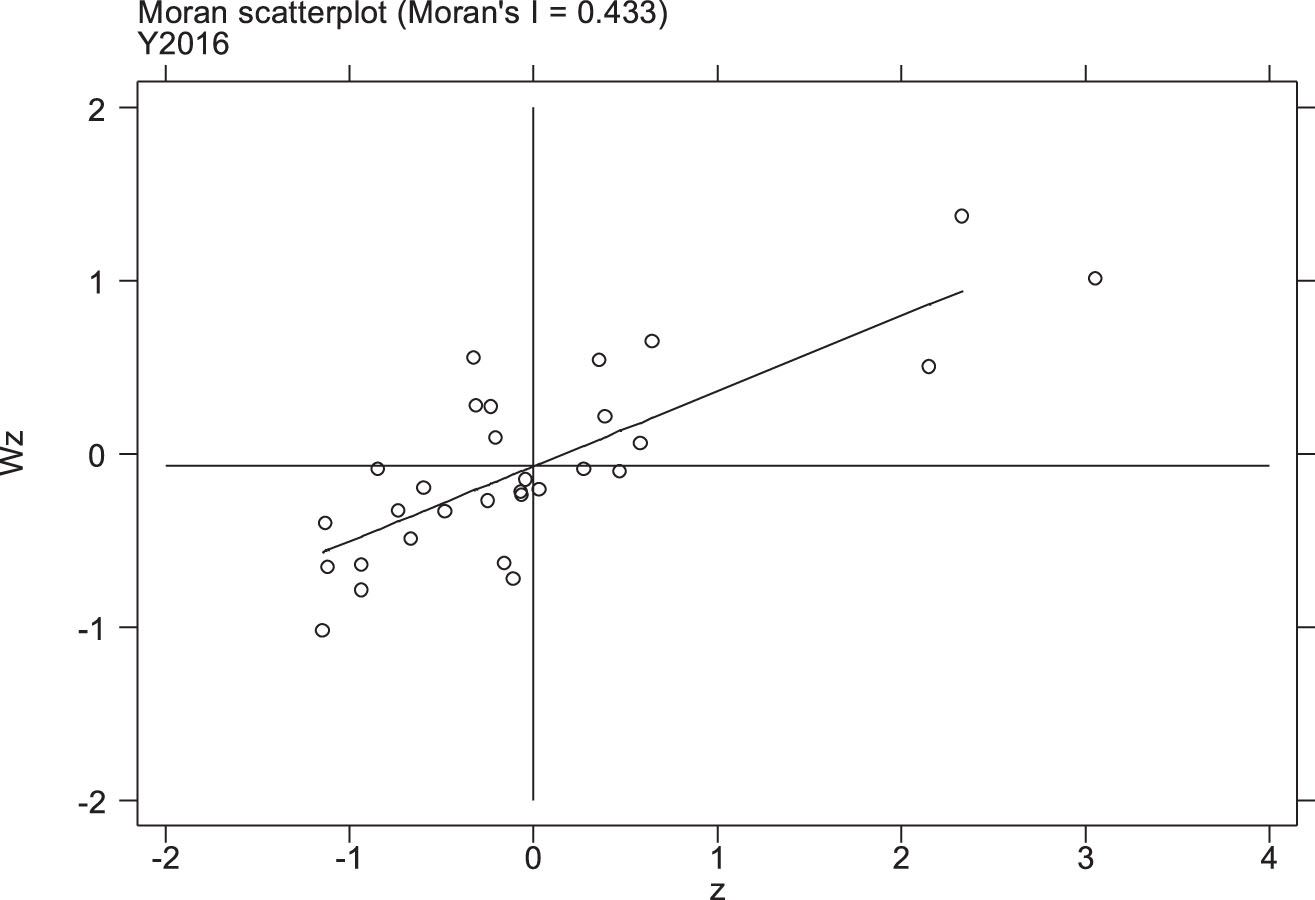
Moran scatter plot of provincial green economic efficiency in 2016.
With 2007 as a reference, the total number of provinces in the first and third quadrants in 2010, 2013 and 2016 accounted for 86.7%, 66.7% and 83.3% of the total provinces respectively. This shows that the spatial agglomeration of green economic efficiency in China shows certain fluctuations, but the fluctuation range is not large. By comparing the changes of the provinces in each quadrant, we find that: (1) The provinces in the H-H agglomeration area are mainly concentrated in the eastern coastal areas, in which Shanghai, Tianjin, Beijing, Jiangsu, Fujian, Zhejiang and Guangdong are always located in the H-H agglomeration area. This is due to the obvious advantages of the eastern coastal provinces in economic development, technology level, environmental protection, energy utilization and other aspects, and the continuous green economic efficiency. Promotion, and the formation of a significant diffusion effect, can actively promote the development of green economy in adjacent areas. (2) The L-H agglomeration area mainly distributes in the central and Western regions, and the spatial distribution shows some changes. In 2007, it is five provinces and cities in Anhui, Jiangxi, Hebei, Guangxi and Hunan, and it is still five provinces and cities in 2016, but specifically Hebei, Jiangxi, Anhui, Jiangxi, Hainan and Guizhou. Most of these provinces are adjacent to the high green economic efficiency areas in the eastern part of China, and their driving role is clear. Obvious. Among them, Hunan has transited from L-H agglomeration area to H-H agglomeration area, which is mainly driven by the radiation of the eastern region in the process of industrial structure optimization, ecological environment protection and development of modern service industry. (3) L-L agglomeration areas are mainly resource-intensive provinces in the West and central regions, and there is no obvious trend of increase or decrease in the provinces of this agglomeration area. These provinces have shown low green economic efficiency during the sample period due to the low level of industrial structure, low energy utilization rate and relatively backward technology. In recent years, Inner Mongolia, Hunan and other provinces have intensified efforts in industrial restructuring and transformation of economic development mode to promote the transformation of economic growth mode from extensive to intensive. Meanwhile, due to the radiation-driven role of eastern provinces with higher green economic efficiency, green economic efficiency has been improved to varying degrees. Guizhou, Yunnan, Chongqing, Gansu, Sichuan, Qinghai, Hubei, Henan and other provinces have been in L-L agglomeration area. It is not difficult to understand that these provinces use local resources to achieve rapid economic development, while the resulting resource consumption and environmental costs can not be ignored. In the future, it is still necessary to further optimize the industrial structure, coordinate the relationship between resource utilization, environmental protection and economic development. (4) There are no provinces in the H-L agglomeration area in 2007, 2010 and 2016. Only in 2013, there are three provinces in Hunan, Inner Mongolia and Shandong. Among them, Shandong has transited from the H-L agglomeration area in 2013 to the H-H agglomeration area in 2016. This is because Shandong, as an economically developed province in the east, has always maintained a high level of green economic efficiency, and through effective regional cooperation mechanism, has become a neighbor. Nearby areas have obvious radiation driving effect, and gradually show the phenomenon of efficiency improvement in the adjacent grounding area. Generally speaking, the spatial distribution of green economy efficiency in China shows obvious agglomeration characteristics, that is, the provinces with higher green economy efficiency are mainly distributed in the eastern coastal areas, while the provinces with lower green economy efficiency are concentrated in the central and Western areas.
Firstly, LM test and Robust LM test are applied to the models without spatial interaction under the four forms of time-space immobility, space-time immobility, time-space immobility and time-space immobility. According to Table 2, we can see that the spatial lag effect and the spatial error effect in other forms have passed LM test and Robust LM test, except that the spatial error effect in time-fixed form has not passed 10% significant LM test. According to Table 3, the LR test of joint significance of fixed effects rejects the original hypothesis at the level of 1% significance, which indicates that both spatial and temporal fixed effects are significant in the model. Under the model of double fixed effects of space and time, the LM test and Robust LM test of the model are rejected. It shows that the spatial lag model and spatial error model should be established simultaneously, so it needs to be further improved. Step by step, the spatial Durbin model is constructed.
LM test results under different temporal and spatial effects
LM test results under different temporal and spatial effects
Significance Test of Fixed Effects of Space and Time
According to the basic form of spatial Durbin model, the empirical test model of the relationship between producer services agglomeration and green economic efficiency is obtained.
Table 4 gives the estimation results of the spatial Durbin model. The estimation methods of the spatial and temporal fixed effects and the spatial and temporal random effects are used respectively. The bottom of Table 4 lists the results of Wald test to determine whether the spatial Durbin model can be simplified into a post-spatial model or a spatial error model. All the results have passed the saliency test, which again verifies the accuracy of the model parameter estimation by selecting SDM. Finally, Hausman test shows that the original hypothesis of random effects can not be rejected, so the spatial Durbin model with random effects is more effective. This may be due to the fact that stochastic effects are more effective than fixed effects in avoiding the reduction of DOF in the case of relatively large number of spatial units. The regression results are shown in the third column of Table 3.
Estimation results of spatial Durbin model with coexistence of spatial and temporal effects
The model estimates show that the agglomeration of producer services has a significant impact on the improvement of green economic efficiency, and the green economic efficiency of a region will also be affected by different agglomeration models of producer services in adjacent regions. Specifically, the impact of specialization agglomeration of producer services on green economic efficiency is significantly negative, while the diversification agglomeration of producer services significantly improves green economic efficiency. Considering that the results obtained by using point estimation method of spatial econometric model to test whether spatial variables have spillover effects are erroneous, this paper decomposes the coefficient estimates into direct effects and indirect effects by using partial differential method according to the source of the influence of the explanatory variables on the explanatory variables. The calculation results are shown in Table 5. From Table 5, we can see that the direct effect of producer services specialization agglomeration on green economy efficiency is significantly negative, and its indirect effect and total effect are significantly negative. This shows that the MAR externality of producer services agglomeration has a significant inhibitory effect on the improvement of green economic efficiency in the region and adjacent areas. This may be due to the existence of technology imitation and bad competition among the same types of producer service enterprises in the agglomeration area, which makes it difficult to promote technology and knowledge spillover, and thus has a negative impact on the green economic efficiency of the region. At the same time, the specialization agglomeration of producer services in specific regions can radiate and drive the adjacent regions, to a certain extent, enhance the level of specialization agglomeration in the surrounding areas, which is not conducive to the improvement of its green economic efficiency. According to the calculation results of diversification agglomeration of producer services, the direct effect on green economic efficiency is significantly positive. This means that the diversification and agglomeration of producer services have a significant role in promoting the green economic efficiency of the region, but not in promoting the green economic efficiency of adjacent areas. The diversified agglomeration of Producer Services helps to strengthen the technology spillover effect among different industries, provide technical support and diversified services for industrial development, thus effectively reducing operating costs, improving labor productivity and the quality of economic growth. The indirect effect of diversification agglomeration on green economy efficiency has not passed the significant test, which may be due to the low level of diversification of regional producer services in China during the sample period, and its spillover effect is no longer significant with the expansion of geographical space.
Spatial effect decomposition
In terms of control variables, the direct effect of economic development level on green economic efficiency is significantly positive, indicating that economic development contributes to the improvement of green economic efficiency. The indirect effect is significantly negative, which means that the level of economic development has a significant negative spatial spillover effect, which has a negative impact on the efficiency of green economy in other regions. The direct and indirect effects of industrial structure on green economic efficiency are significantly positive. On the one hand, the rapid development of the tertiary industry in this region helps to improve the efficiency of resource utilization and alleviate the local pollution to a certain extent. On the other hand, it produces spatial effects through industrial gradient transfer, which has a positive radiation effect on the optimization of industrial structure in adjacent areas. The direct effect of foreign direct investment on green economic efficiency is significantly negative. The possible reason is that various regions are at the bottom of the industrial chain in the process of introducing foreign investment, and a large number of foreign-funded enterprises with high pollution and energy consumption are introduced, resulting in further deterioration of the ecological environment and hindering the improvement of green economic efficiency, but the indirect effect is not significant, which indicates that FDI has not produced green economic efficiency in China. There are obvious spillover effects. The direct and indirect effects of pollution control input on green economic efficiency are not significant, reflecting that relying solely on pollution control at this stage can not fundamentally improve green economic efficiency. The direct effect of urbanization level on green economy efficiency is significantly negative, which shows that the improvement of urbanization level to a certain extent improves the living standard of residents and urban appearance, but urban construction and urban life also seriously damages the ecological environment. However, the indirect effect is positive, which may be due to the market demand brought by urbanization to accelerate the agglomeration of production factors in surrounding areas, and to a certain extent to promote the development of green economy in other areas.
Due to the great regional differences in the development of producer services in China, this paper estimates the spatial Durbin model in the eastern, central and western regions of China, and investigates the spatial spillover effect of the choice of producer services agglomeration modes on green economic efficiency in different regions. The regression results are shown in Table 6.
Decomposition of spatial effects in eastern, central and Western Regions
Decomposition of spatial effects in eastern, central and Western Regions
From Table 6, it can be seen that the spatial effects of producer services agglomeration mode selection on green economic efficiency are obviously different in three regions: there is a significant negative spatial spillover effect of producer services specialization agglomeration on green economic efficiency promotion in the eastern region, while the spatial spillover effect of diversification agglomeration is not significant, and producer services specialization is also significant. Agglomeration inhibits the improvement of green economic efficiency in the region, while diversification agglomeration promotes the improvement of green economic efficiency in the region; the direct and indirect effects of specialization agglomeration of producer services in the central region are significantly negative, while the indirect effects are significantly positive, while the direct and indirect effects of diversification agglomeration on the improvement of green economic efficiency are both positive. However, none of them passed the significance test; the direct and indirect effects of the choice of agglomeration mode of producer services in Western China on green economic efficiency were not significant. This shows that the external performance of producer services agglomeration in the eastern region significantly inhibits the improvement of green economic efficiency in the region and its surrounding areas, and Jacobs’external performance significantly promotes the improvement of green economic efficiency in the region; the improvement of green economic efficiency in the central region relies more on the AR externality of producer services agglomeration; the agglomeration of producer services in the western region is green. The impact of economic efficiency is not significant. The possible reason is that the eastern region attaches great importance to the extension of industrial chain and the upgrading of value chain, and has highly specialized, relatively perfect and mature industrial sectors. Therefore, it needs a variety of productive services with diverse functions to adapt to it. The diversified agglomeration of producer services in these areas is conducive to enhancing the spillover of technology and knowledge among different industrial sectors. By fully exploiting and utilizing the local comparative advantages, the central region strives to develop producer services that are compatible with its resource elements and industries, and to achieve specialization and large-scale production, which is conducive to promoting the efficiency of green economy in the region; the industrialization process in the western region is relatively slow, and producer services are relatively slow.
This paper empirically examines the impact of specialization and diversification of producer services on green agglomeration efficiency and spatial spillover effect by using spatial panel Durbin model. The results show that: (1) MAR externalities of producer services agglomeration not only significantly inhibit the improvement of green economic efficiency in this region, but also have a significant negative spatial spillover effect on adjacent and other regions, while Jacobs externalities of producer services agglomeration is only conducive to the improvement of green economic efficiency in this region. (2) For the eastern region, the MAR externalities of producer services agglomeration have significant restraint effect and negative spatial spillover effect on green economic efficiency, while Jacobs externalities have only significant regional promotion effect on green economic efficiency; for the central region, the MAR externalities of producer services agglomeration have spatial spillover effect on green economic efficiency. The Jacobs externality has no significant spatial spillover effect on the green economy efficiency. For the western region, the direct effect and spatial spillover effect of producer services agglomeration mode choice on green economy efficiency have not passed the significant test. (3) From the perspective of control variables, the direct effects and spatial spillover effects of economic development level, industrial structure, foreign direct investment, pollution control investment and urbanization level on green economic efficiency are different, which in turn affects the impact of producer services agglomeration on green economic efficiency.
Based on the above findings, this paper draws the following policy implications: 1. Encourage the diversified development of producer services, form diversified agglomeration of producer services, guide rational competition and cooperation among producer services enterprises, prevent large-scale homogeneous agglomeration, and the resulting vicious competition. (2) All regions should choose the appropriate agglomeration mode of producer services and give full play to the spillover effect of agglomeration externalities on the improvement of green economic efficiency. The eastern region should develop diversified and high-end producer services to become the main driving force for the improvement of green economic efficiency in the region and its adjacent regions; the central and western regions should establish a production and service system in line with local resources and needs according to their own endowment conditions, concentrate on creating a specialized agglomeration environment for a few industries, and strive to form a professional agglomeration environment with the surrounding areas. Rational spatial layout with unique features and complementary functions. (3) Economic development is the key to solve the problem of green development of provinces and cities. While improving the economic quantity, all regions should pay more attention to the quality of economic growth; regard the tertiary industry as an important force to adjust economic structure and promote transformation and upgrading, vigorously develop the tertiary industry, and optimize the spatial distribution of industrial structure; strengthen the supervision and assessment of the introduction of foreign capital, so as to avoid or Reduce the inflow of pollution; improve environmental protection laws and regulations, improve pollution treatment technology, enhance public awareness of environmental protection; accelerate the process of new urbanization, promote sustainable economic and social development.