
Abstract
Global warming caused by excessive emissions of carbon dioxide (CO2) has become a hot topic globally in today’s society, and optimizing carbon emission performance (CEP) is an effective way to alleviate CO2 emissions. Many studies have explored CEP at the global, national, provincial and sector levels. However, due to the difficulty in obtaining energy consumption data, there is a lack of studies at the urban agglomeration and city levels. Taking the urban agglomeration dimension as the starting point, this paper constructs an improved epsilon-based measure (EBM) model to measure the CEP of the Yellow River Basin. A spatial data analysis model was introduced to explore the regional spatial characteristics of CEP. The newly developed spatial statistical model was used to study the driving factors of CEP. The results showed that: (1) The overall CEP of the Yellow River Basin was relatively high, showing an upward trend of volatility. There were significant differences between the seven urban agglomerations and 69 cities. (2) The CEP of the Yellow River Basin showed a trend of spatial agglomeration. The urban agglomerations of the eastern region showed a low-value agglomeration phenomenon, and the urban agglomerations of the central and western regions showed a trend of high-value agglomeration. (3) Economic development level (PGGDP), technological progress (TP), industrialization level (IND) and human capital (HC) can play a positive role in promoting the improvement in CEP, and population structure (PD) and energy structure (ES) can play a negative role in promoting the improvement in CEP. Industrial agglomeration (IA) and CEP show a “U"-shaped relationship that first inhibits and then promotes. In addition, foreign direct investment (FDI), IND, and HC have significant spatial spillover effects on neighboring cities.
Keywords
Introduction
The issue of global warming has become a serious ecological problem faced by all humankind. The Intergovernmental Panel on Climate Change (IPCC) clearly pointed out that global warming has become an established fact, and excessive greenhouse gas emissions are the main triggering factors. CO2 is the greenhouse gas with the highest proportion of emissions, and its emissions are closely linked to global warming [1]. With the increases in urbanization and industrialization, CO2 emissions show a rapid growth trend, and negative effects caused by CO2 have followed one after another, which has caused widespread concern worldwide. To ensure that the economy and society can enter the stage of sustainable development as soon as possible, under the trend of “low carbonization", some countries have successively promulgated low-carbon action plans that match their own development characteristics; for example, the United Kingdom has formulated a low-carbon action plan, and Japan has formulated a low-carbon social action plan [2].
China already ranks first for total energy consumption and CO2 emissions, and energy conservation and emission reduction have always been the focus of its development strategy. In September 2020, China made a major policy announcement to the world, in which it would “Strive to accomplish carbon peak by 2030, and strive to accomplish carbon neutrality by 2060", which initiated a systematic economic and social transformation aimed at “dual carbon” in the next 10-40 years and indicated the direction for low-carbon development [3].
Relevant studies show that cities are major energy consumers and greenhouse gas emitters [4], and accelerating the process of low-carbon city construction is an indispensable choice for China to address climate issues and develop a low-carbon economy. Urban agglomeration is a high-level spatial organization form in which cities develop to a mature stage within a specific geographic range, bears the function of factor agglomeration and diffusion and is a momentous growth pole to enhance regional economics [5, 6]. With the expansion of city scale and the increase in urbanization level, the connection between cities is getting closer and closer; urban agglomerations have become the most vital core areas in China’s economic development pattern, and they represent a strategic support point, growth pole and core in China’s productivity layout in the role of nodes [7]. However, restricted by regional differences and imbalances in the level of economic development, natural conditions, and resource endowments of urban agglomerations, their low-carbon development paths should also be different from city to city.
Since ancient times, the Yellow River Basin has been an important economic region in China. At this stage, it is facing severe pressure in terms of economic and social development and ecological security. The Yellow River Basin has nine provinces under its jurisdiction, covering an area of 20063 million km2. At present, the urban agglomeration in the Yellow River Basin has formed a spatial organizational pattern of “3 + 4” [8] (Fig. 1).
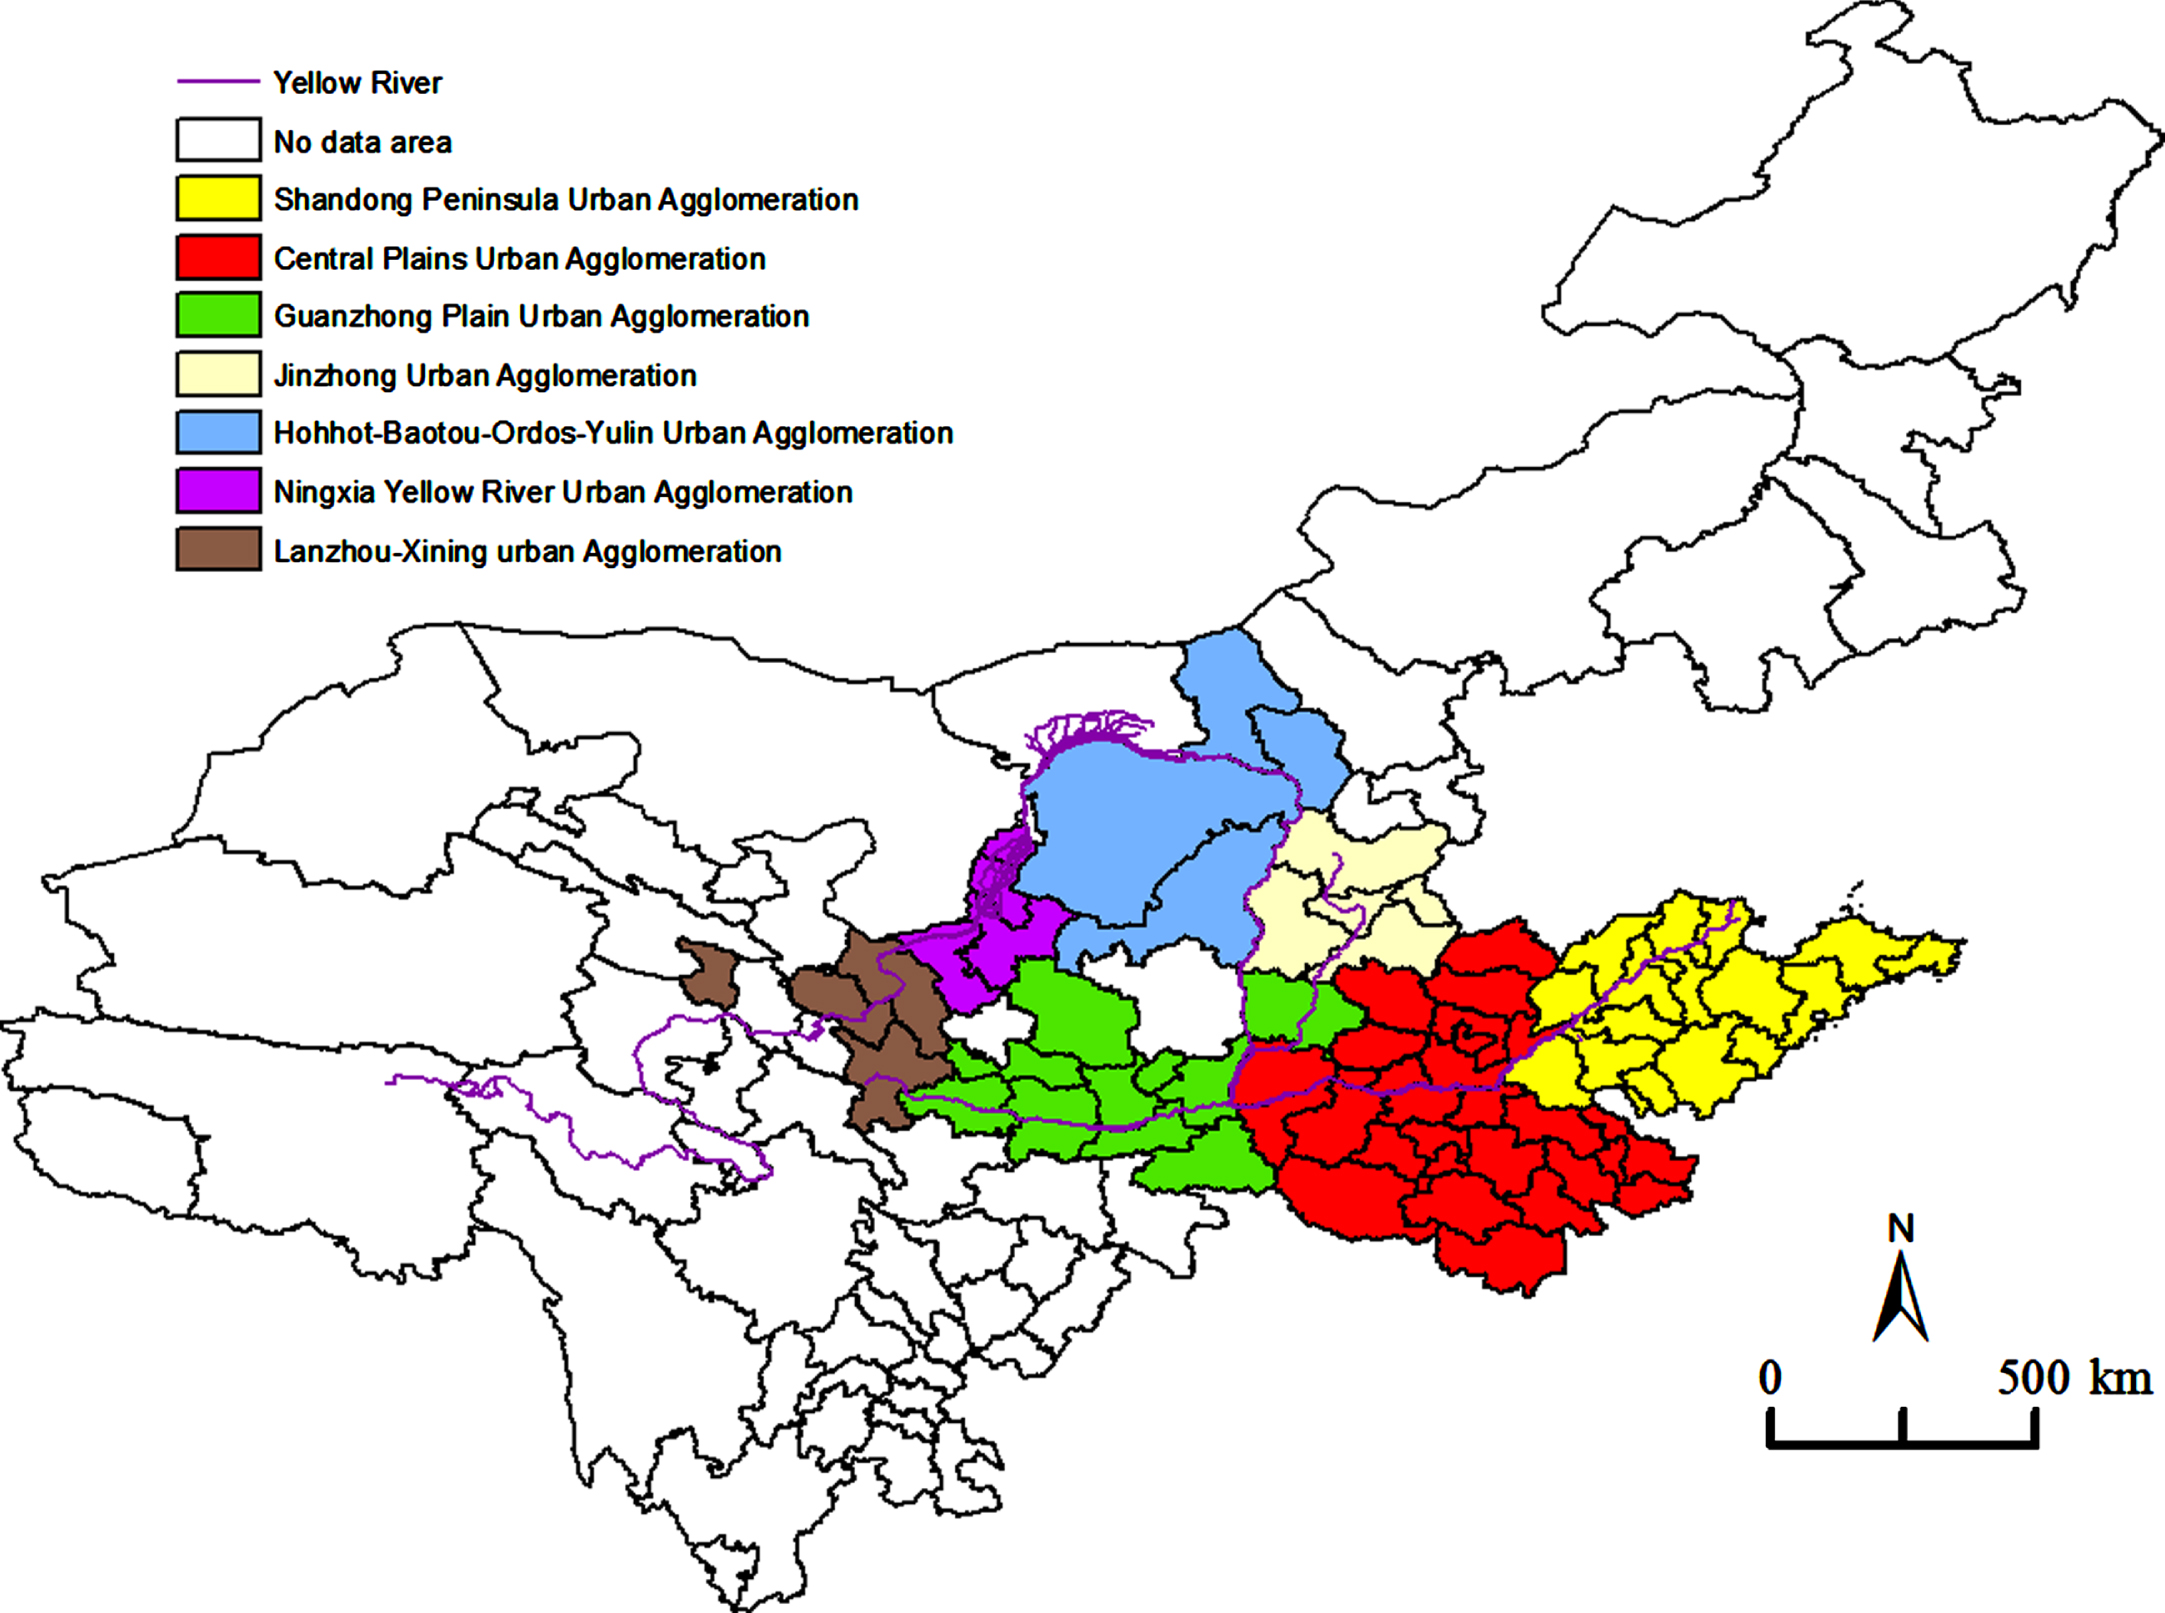
Distribution of even urban agglomerations in the Yellow River Basin.
Specifically, the Yellow River Basin includes three regional urban agglomerations, which are the Shandong Peninsula urban agglomeration (SPUA), Guanzhong Plain urban agglomeration (GZP), and the Central Plain urban agglomeration (CPUA), and four local urban agglomerations, which are the Hohhot-Baotou-Ordos-Yulin urban agglomeration (HBOYUA), Ningxia along the Yellow River urban agglomeration (NXAYUA), Jinzhong urban agglomeration (JZUA), and Lanxi urban agglomeration (LZUA). In 2017, the economic aggregate of the seven urban agglomerations accounted for more than 70% of the entire river basin, had more than 60% of the population of the entire river basin, and discharged more than 50% of the CO2 of the entire river basin. It is one of the areas with the most acute contradiction between the economy, resources and environment in the Yellow River Basin. As a crucial energy and heavy industry base in China, these urban agglomerations are dominated by three major industries, energy, chemical and steel, making it face the most severe situation of high energy consumption and high carbon emissions in China. Therefore, accurate measurement of the CEP and in-depth investigation of the driving factors of CEP are of great significance to the realization of low-carbon development in the Yellow River Basin.
Based on this background, an improved EBM model that can consider undesirable output was constructed to measure the CEP of urban agglomerations in the Yellow River Basin. The spatial data analysis model was applied to examine the spatial characteristics of CEP. The newly developed spatial statistical model was used to study the driving factors and spatial spillover of CEP. Exploratory suggestions on how to improve CEP were provided. The main contributions of this paper are as follows: A U-SE-EBM model was built, which not only solved the shortcomings of the traditional data envelopment analysis (DEA) model but also achieved comparable efficiency values and enhanced the scientific accuracy of CEP measurement results. This model was applied to CEP measurement at the urban agglomeration level for the first time. The importance of PGGDP, TP, HC, IA and other factors in improving CEP was discussed. The newly developed spatial regression model was used to calculate and decompose the driving factors and spatial spillover effects of CEP. The robustness of the empirical conclusions was verified by constructing a spatial weight matrix to strengthen the reliability and theoretical logic of the research conclusions. Therefore, this paper is a beneficial supplement to the literature in terms of depth and breadth and can provide a decision-making reference for appropriate countermeasures and effective control measures to improve CEP.
Analytic hierarchy Process (AHP) is a comprehensive evaluation method that integrates various indexes into one comprehensive index. It is a subjective weighting method, mainly based on the scores of experts in related fields to determine the weight of indicators, with strong subjective color, can not guarantee the accuracy of measurement results [9]. Different from the comprehensive evaluation method, CEP refers to the efficiency of decision making units considering input and output [10]. According to the measurement method, it can be classified as a single-factor measurement method [11]. The single-factor measurement method is mostly measured by the ratio of CO2 emissions to economic or energy-related indicators, such as the carbon index, energy intensity or carbon intensity [12–14]. Although the single-factor method has certain advantages in terms of understanding and operation, it still has certain limitations. CEP is actually the input–output efficiency in the process of economic activities, which cannot be directly generated by relying solely on energy. It is the result of the joint action of related economic factors such as labor force and capital. Therefore, in the calculation process, it is necessary to highlight the “total factor” characteristics of the indicator and consider the substitution effect of other input factors in economic activities [15]. According to the idea of total factor and factor substitution, energy, capital and labor are taken as input indicators in the process of economic production to form the expected output of GDP, which makes the measurement results of CEP more scientific and reasonable [16].
The DEA model is a classic input–output model that can be used to evaluate CEP. The DEA model has been extensively applied in CEP assessment due to its advantages of no parameter estimation, low-efficiency items, few data constraints and decomposition [17]. However, the traditional DEA model tends to focus on the economic desired output while ignoring the undesirable outputs of economic activities, which may lead to deviations in the results [18]. Therefore, according to the analysis framework of the total factor, Fare constructed a DEA model for environmental efficiency assessment that could simultaneously deal with pollution variables as undesirable outputs [19]. Tone constructed a slacks-based measure (SBM) model that regarded the negative value of undesirable outputs as ideal outputs [20]. On this basis, some scholars constructed an improved model suitable for CEP. For example, Zhou et al. [21] used the DEA-Malmquist model to estimate the static CEP and dynamic CEP of 18 countries with high carbon emissions and investigated their influencing factors. Based on the total factor framework, Wang et al. [22] constructed CO2 emission performance indicators using environmental production technology and proposed a measurement model to describe regional CO2 emission differences based on the extended common frontier function. Wang et al. [23] built a DEA model that could consider both the meta-frontier function and nonradial distance to estimate the CEP of 58 countries and made three key findings. Wu et al. [24] assumed weak disposability of fossil energy input and carbon dioxide emissions and developed a joint production technology model that could simultaneously take into account the principle of material balance and multiple options of emission reduction.
Referring to the statistics and application of measurement methods by relevant scholars [25], this paper summarizes a large number of studies by relevant scholars and finds that with the maturity of CEP evaluation methods, the research dimension of CEP has been further expanded. At the present stage, CEP evaluation has been widely used in research on many dimensions, such as enterprises, industries, and regions. In terms of the enterprise dimension, Zhao et al. [26] measured the CEP of 23 new energy vehicle companies in China through the SE-SBM model and utilized the Stochastic Impacts through Regression on Population, Affluence, and Technology (STIRPAT) model to explore the influencing factors of CEP. Many examples are available from the industry dimension. On the basis of considering the influence of regional heterogeneity, Zhang and Wei [27] investigated and decomposed the dynamic trend of CEP of China’s transportation industry. Hu et al. [28] measured and analyzed the CEP of the Australian construction industry from 1990 to 2013 and identified the impact mechanism of TPE, PTE, and SE on CEP. Meng et al. [29] measured and analyzed the CEP of 27 manufacturing sectors in China under various mitigation strategies from 2003 to 2016 by incorporating group heterogeneity into the framework of natural and managed disposal. There have also been many studies conducted from a regional dimension. Wang et al. [30] studied CO2 emissions from the perspective of production theory, proposed an improved TFCEP index, and applied it to the interprovincial CEP measurement. Studies show that there are significant differences in TFCEP among provinces in China, with high TFCEP in the southeastern coastal region and low TFCEP in the central and western inland regions. The differences among provinces are increasing year by year. Ding et al. [31] proposed a constrained performance indicator measurement (CPIM) model to estimate the interregional and interprovincial CEP in China. Zhou et al. [32] proposed a DEA model that could consider multiple emission reduction factors to evaluate the CEP of Chinese cities. The research shows that at this stage, there is an arrangement pattern in which the CEP of eastern cities > the CEP of central cities > the CEP of western cities. Among these, the CEP of central cities shows the greatest upward trend.
Benefiting from the maturity and expansion of CEP evaluation methods, the research emphasis of CEP is no longer confined to simple measurement; instead, it has gradually branched out into more in-depth research, in which exploring the driving factors of CEP has become the focus of research. The research status of the driving factors of CEP is shown in Table 1.
Literature on the driving factors of CEP
Literature on the driving factors of CEP
Note: “+” in parentheses indicates positive influence and “–” indicates negative influence.
Theoretic mechanism
Based on previous studies, this paper analyzes the spatial effects of urban carbon performance in the Yellow River Basin from the perspectives of population density, economic development level, technological progress, industrialization level, human capital, energy structure, foreign direct investment, environmental regulation and industrial agglomeration, focusing on the spatial direct effects and spatial spillover effects. Spatial direct effect refers to the influence of regional influencing factors on carbon performance, reflecting the effect of influencing factors in the region. Spatial spillover effect (indirect effect) refers to the impact of other regional influencing factors on the carbon performance of the region, reflecting the effect of influencing factors in different regions. The expected spatial direct and indirect effects of each factor on urban CEP in the Yellow River Basin are shown in Fig. 2.
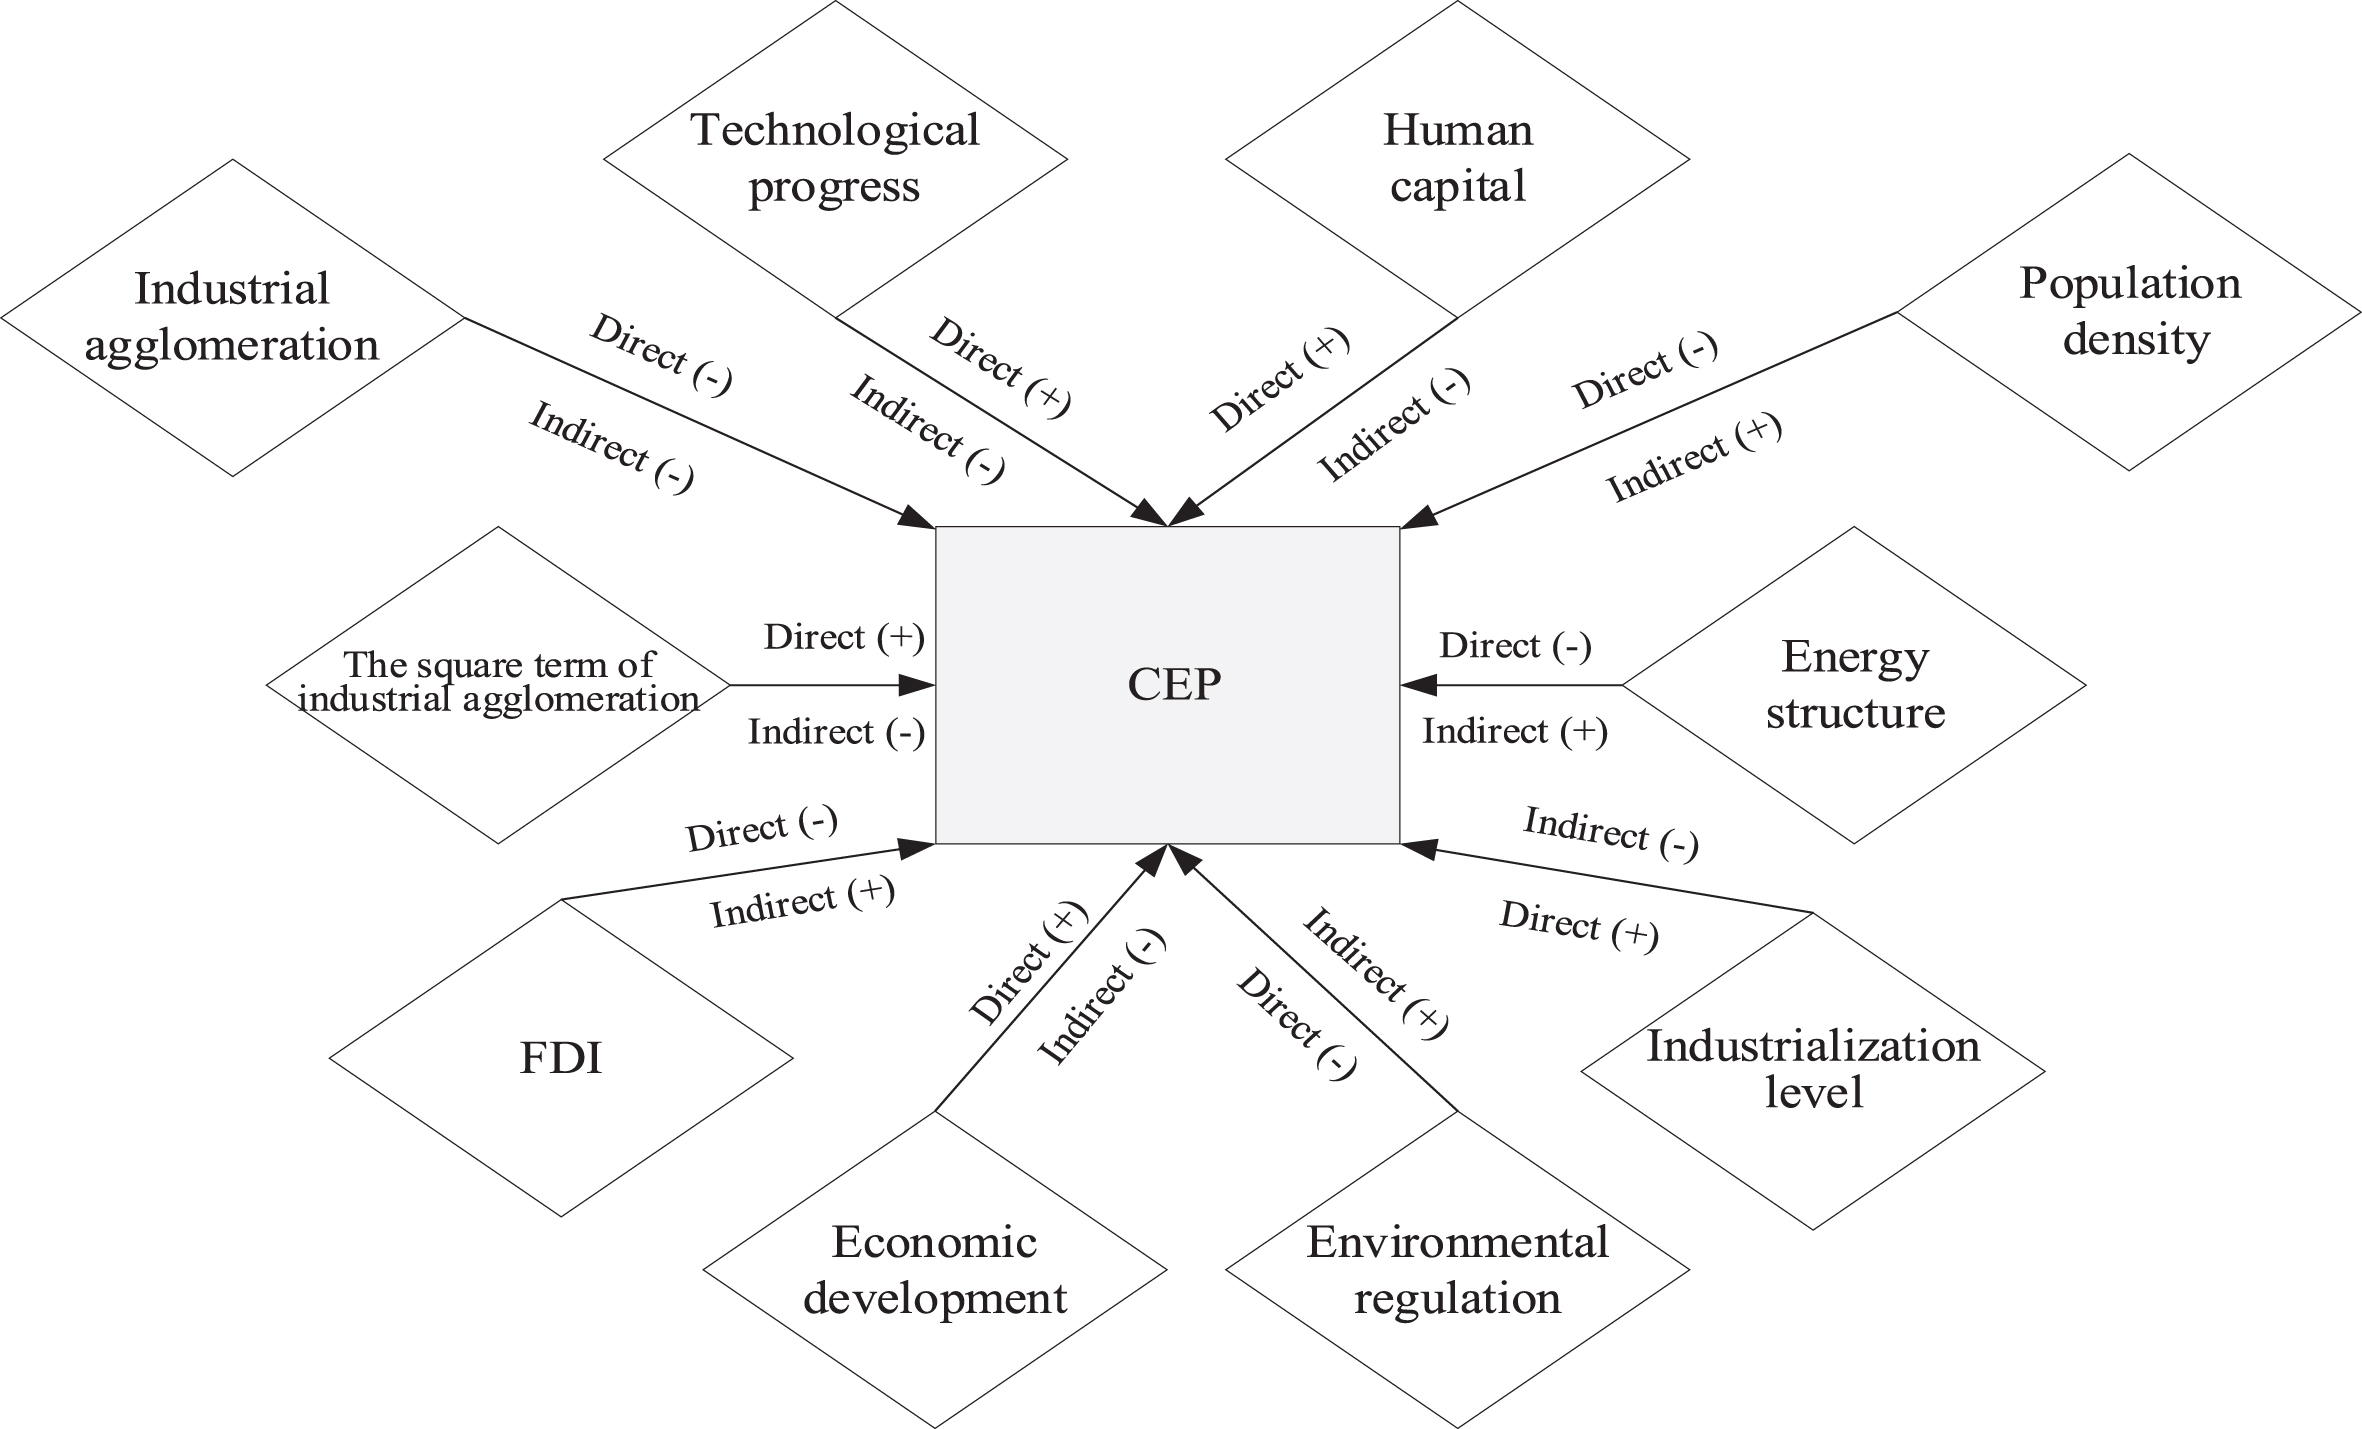
Spatial direct and indirect effects of each influencing factor on urban CEP in the Yellow River Basin. Note: in parentheses is expected sign, “+” indicates a positive impact, and “–” indicates a negative impact.
In this paper, by incorporating the improved EBM model, the exploratory spatial data analysis (ESDA) model, and the spatial statistical model, a new synthesis method was developed that can consider the spatial heterogeneity of CEP. Referring to the method proposed by Oke et al. [43] and Yue et al. [44], the following three steps were conducted: (1) The CEP of multiple dimensions was evaluated; (2) the spatial effects and spatial agglomeration characteristics of CEP were explored, and (3) the driving factors and spatial spillover effects of CEP were tested. The flowchart of the specific method is shown in Fig. 3.
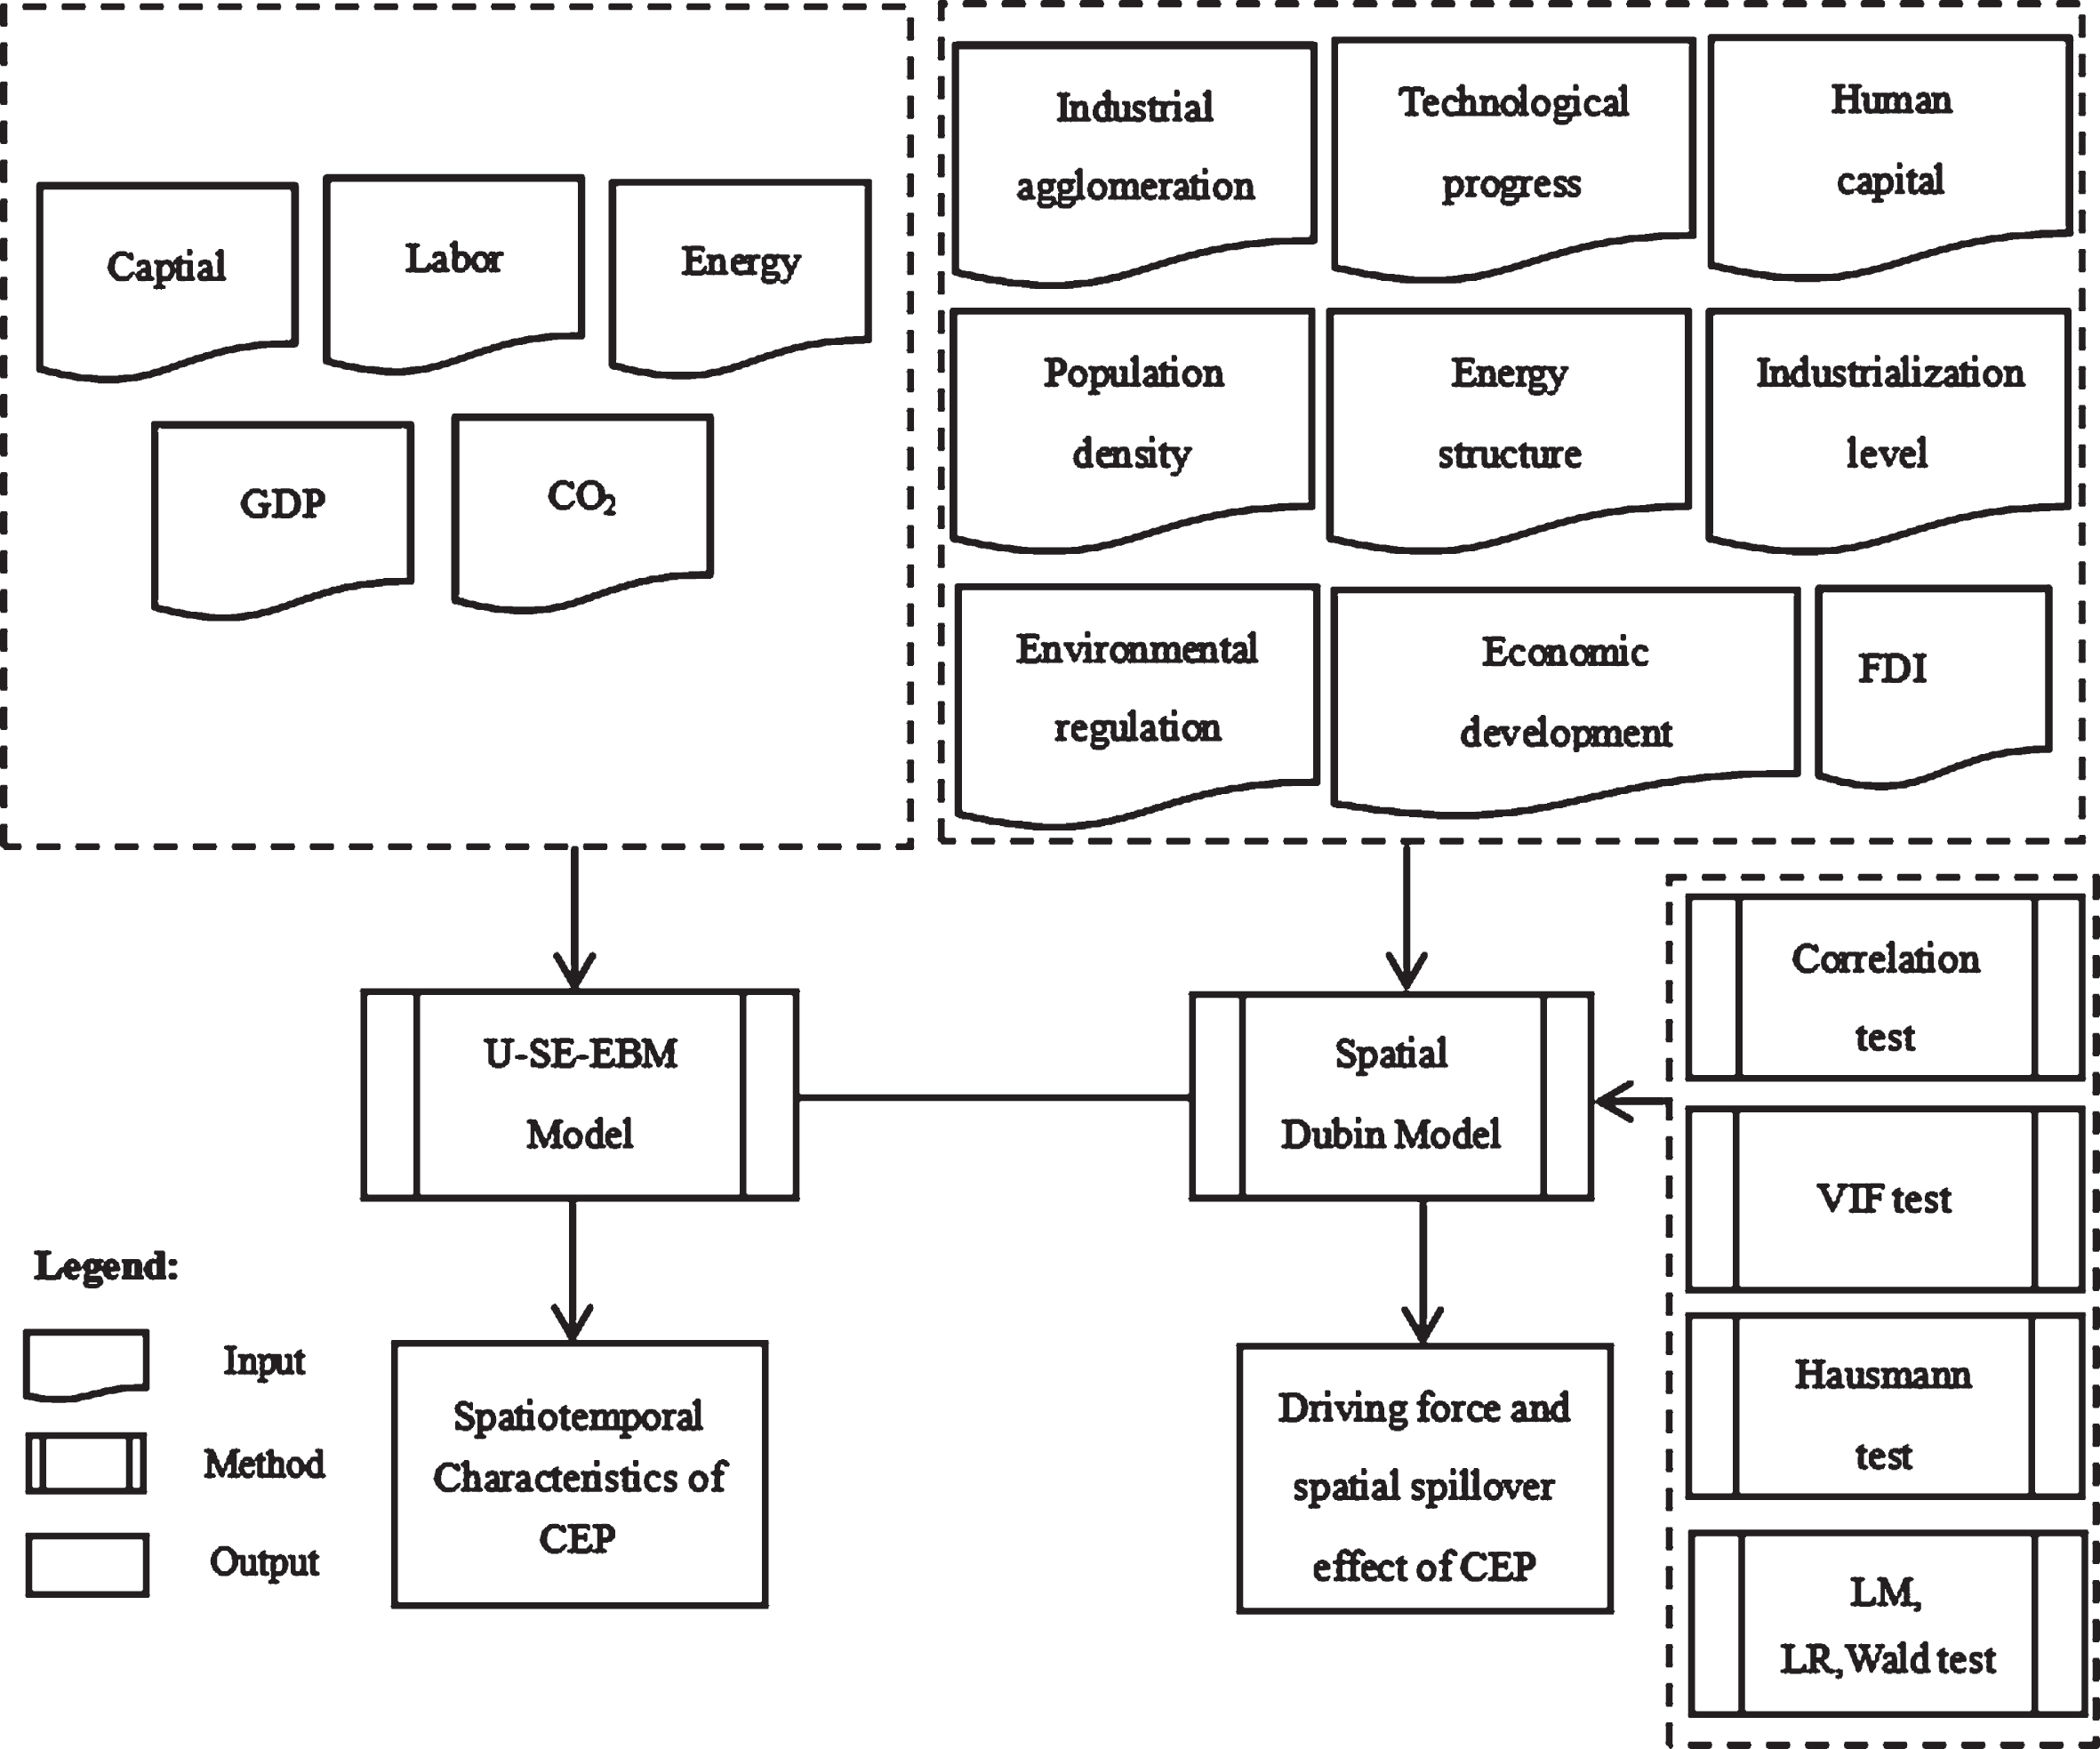
Framework for CPE.
DEA is a quantitative analysis method for calculating the relative efficiency of comparable types of DUM. Since it was introduced by Charnes and Cooper in 1978, it has been widely used in many fields of research in academia [45]. DEA mainly includes radial models represented by CCR and BBC and nonradial models represented by SBM models. The literature shows that the above two types of models have defects. The former assumes conditions that are too strict, which leads to the reduction in input factors in the same proportion and deviates from reality. Although the latter improves the former, it loses the raw scale information of the efficiency frontier projection value [46]. Aiming at the shortcomings of these two types of models, Tone and Tsutsui [47] proposed a traditional EBM model that can have both radial and nonradial mixed distance functions. The EBM model has three advantages: ding172 it can overcome the defects of the two models at the same time; ding173 the advantages of the two models can be integrated into the same research framework; and ding174 the undesirable outputs can be incorporated into the research framework [48]. In addition, efficiency results obtained through the EBM model often have multiple decision units all equal to 1, which makes it impossible for researchers to effectively sort DMU and reveal the heterogeneity of DMU. Therefore, this paper attempts to construct an improved EBM model that can consider both the undesired output and the efficient sort of DUM, called the superefficiency EBM model that considers undesired output (U-SE-EBM). The model is shown in Equation (1):
Exploratory spatial data analysis (ESDA) is an effective measure to examine the degree of clustering of attributes of spatial units, which is classified into two categories: global and local [49]. Among them, the global spatial autocorrelation reflects the overall trend of spatial correlation within a region, and the local spatial autocorrelation reflects the spatial relationship between regions, both of which need to be measured by Moran’s I. The model is shown in Equation (2) as:
In Equation (2), W
ij
is the spatial weight matrix (space adjacent is 1, nonadjacent is 0), n stands for the number of research objects, Z
i
stands for the observed values of area i, Z
j
stands for the observed values of area j, S2 is the variance, and
Neither the geographical adjacent spatial weight nor the geographical distance spatial weight can fully reflect the interaction and dependence of regional development. Among them, the geographic adjacent spatial weights ignore differences in spatial interactions and dependencies between regions. The geographical distance spatial weight matrix is due to the rapid development of transportation infrastructure, so that the spatial interaction and dependence between regions are not inversely proportional to the square of geographic distance, especially in some highly developed cities, the radiation range of its spatial effect is often better than that of ordinary cities. Therefore, this paper constructs the economic distance spatial weight matrix (W-1), and the model is shown in Equation (3):
In Equation (3), Wij represents the reciprocal of the economic distance between region i and region j, and
The traditional econometric model is based on the assumption that the research objects are independent of each other but ignores the objective existence of things that are spatially interrelated. Therefore, spatial econometric models that can take into account spatial effects, especially spatial spillover effects, have drawn increasing attention from academics. As far as the research content of this paper is concerned, the main functions of the spatial spillover effect are as follows: the CEP of neighboring cities is mutually influenced, and the economic development level, population density, technological level and other factors of neighboring cities affect the CEP of the city.
The spatial lag model (SLM), spatial error model (SEM), and spatial Durbin model (SDM) are the basic components of the spatial econometric model [50]. Among them, the SDM includes both the spatial lag factor and the spatial error factor. Considering that the SDM is adopted in this paper, only the SDM is shown in Equation (4):
In Equation (4), CEPit is the explained variable, representing the CEP of city i in year t; WCEP it is the spatial lag term of the explained variable; lnPD it , lnPGGDP it , TP it , IND it , HC it , ES it , lnFDI it , GZ it , AI it , and AI2 it are explanatory variables; and lnWPD it , lnWPGGDP it , WTP it , WIND it , WHC it , WESit, lnWFDI it , WGZ it , WAI it , and WAI2 it are the spatial lag terms of the explanatory variables. b is a constant term, and μ is the spatial error term. ρ stands for the unestimated spatial lag coefficient of explained variables, and α 1 -α 10 stands for explanatory variable coefficients to be estimated. α11- α 20 represent the spatial lag coefficients of the explained variables to be estimated.
The experimental dataset includes panel data from 69 cities in the Yellow River Basin. The research period is from 2003 to 2017. The reason why the research ends in 2017 is mainly because it is difficult to obtain carbon emission accounting data at the city level, and currently, only data before 2017 can be collected. Except for the CO2 emission data, other data come from the China Urban Statistical Yearbook, which is revised in combination with the relevant statistical data of relevant provinces and cities. The CO2 emission data are from the CEAD database.
At the same time, the problem of individual outliers and missing values in panel data is solved by interpolation. The specific descriptive statistical results and multicollinearity test and correlation coefficient test results are shown in Table 2 and Table 3. Table 2 shows that the panel data are relatively stable as a whole, and the extreme value problem does not exist. Table 3 shows that the upper and lower extreme values of the variance inflation factor (VIF) are 1.520 and 5.110, respectively, which are both less than the critical standard value of 10, indicating that the collinearity problem does not exist in the research sample. The absolute values of the upper and lower extreme values of the correlation coefficient are 0.008 and 0.720, respectively, and most of them are significant, indicating that there is no serious high correlation or no correlation between explanatory variables.
Variable definitions and descriptive statistics
Variable definitions and descriptive statistics
VIF test and matrix of correlation between variables
CEP results analysis
This paper calculates the CEP (including the basin, 7 urban agglomerations, and 69 cities) according to Equation (1) and shows relevant figures and tables, as shown in Table 4, Fig. 4, and Fig. 5.
CEP of the Yellow River Basin and the seven major urban agglomerations
CEP of the Yellow River Basin and the seven major urban agglomerations
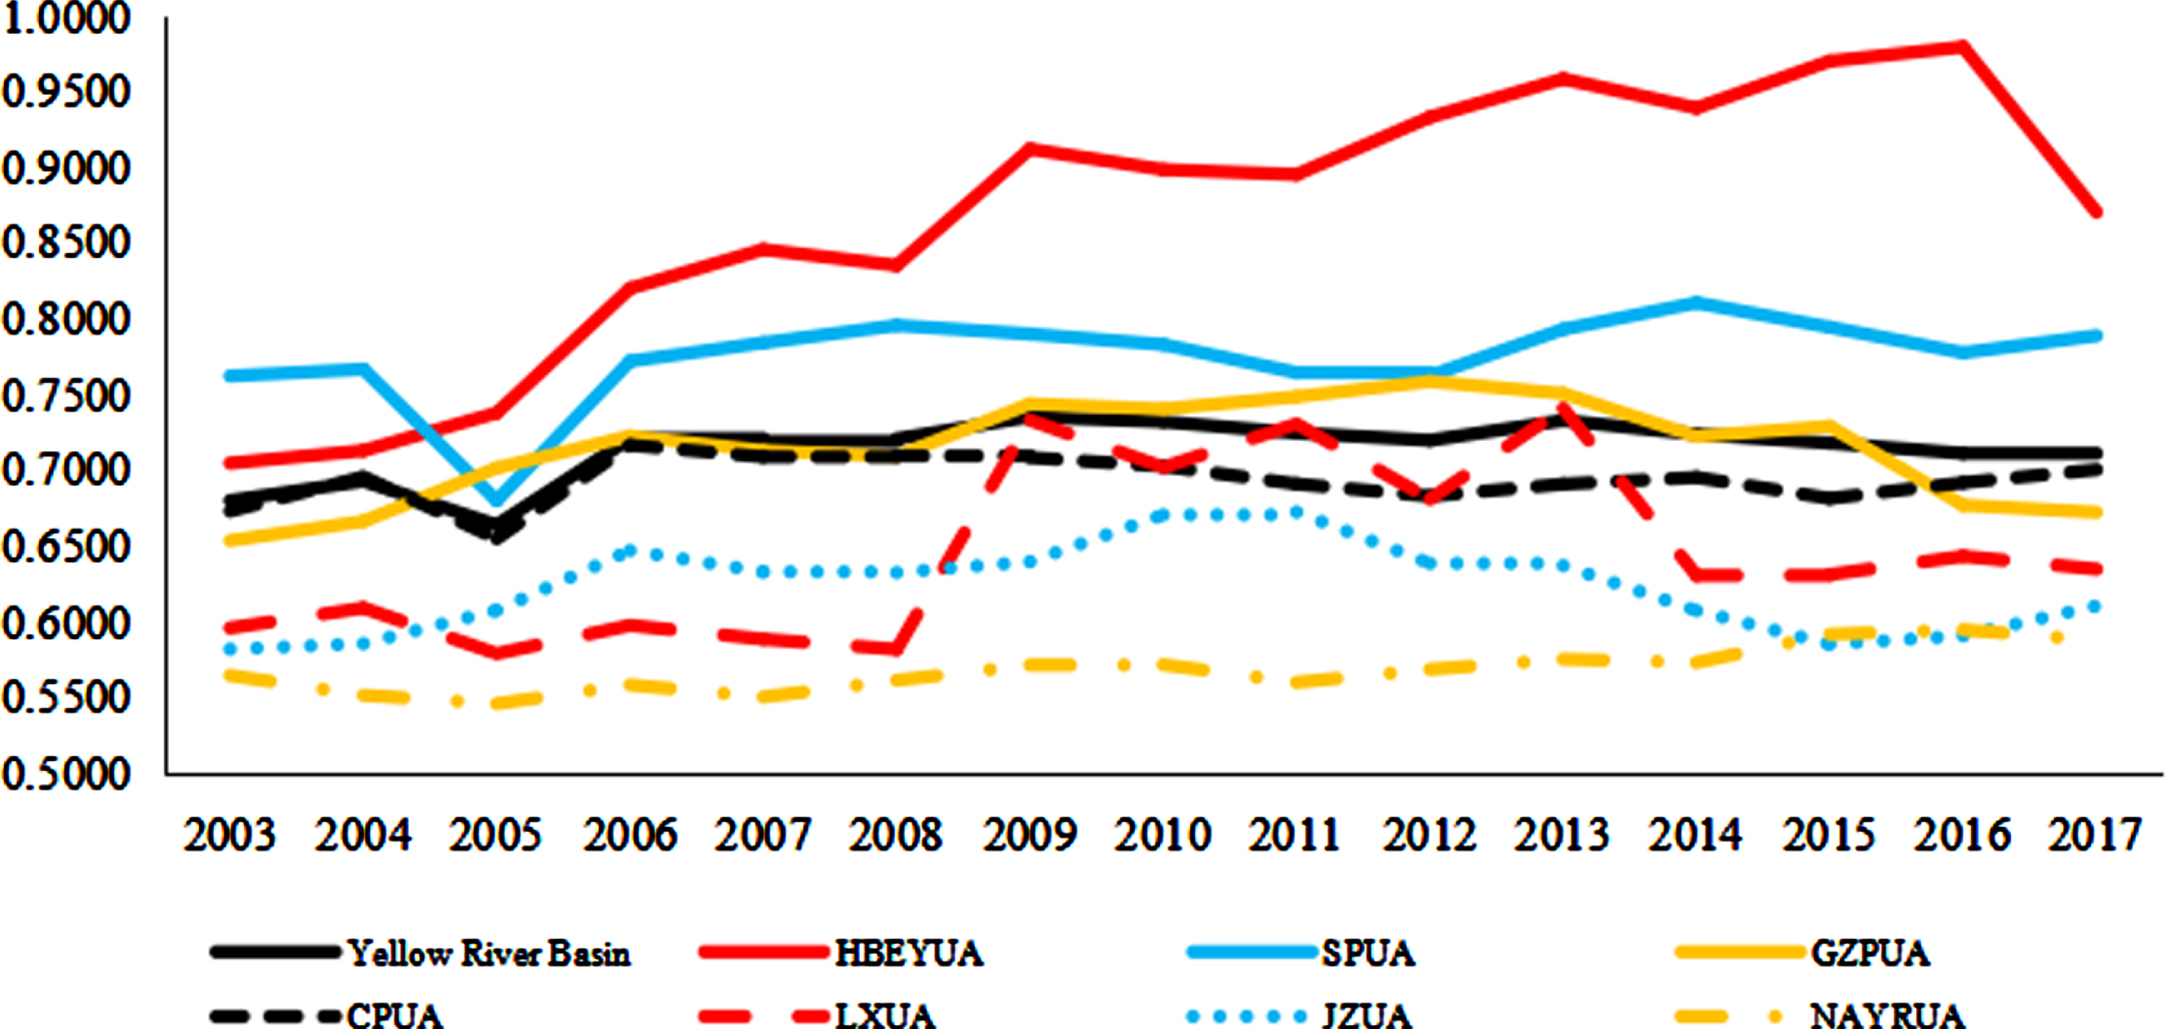
CEP development trend of the Yellow River Basin and the seven urban agglomerations.

Spatial distribution of the CEP mean and average annual growth rate in 69 cities (2003–2017).
Overall, the CEP of the Yellow River Basin is relatively high, with a 15-year average of 0.7134 and an annual growth rate of 0.321%. The CEP remained between 0.6500 and 0.7500 and showed a trend of rising fluctuation during 2003–2017. The CEP increased from 0.6796 to 0.7108 during the study period. From 2003 to 2005, the CEP was lower than 0.7000. After 2006, the CEP increased to more than 0.7000. The trend was stable from 2006 to 2008 and reached the pole in 2009. CEP then showed a certain downward trend, with small fluctuations between 2013 and 2015.
Since the beginning of the new century, the economic growth trend of the Yellow River Basin has been obvious, but the negative effects brought by the extensive development model as the main features have begun to emerge has resulted in low CEP. With the approach of the Beijing Olympic Games, the government launched a series of policies and regulations to restrict the three major industries in the Yellow River Basin. Under the forced mechanism, the carbon emissions in the Yellow River Basin were controlled, and CEP improved and peaked in 2009. After 2010, with the stimulus of central policy, the economic development level peaked, and energy consumption increased substantially, which made the carbon dioxide emissions in the Yellow River Basin rebound and the CEP decline. The reason why CEP remained at a high level of 0.7000 in this period without a significant decline is because of industrial transformation and upgrading, the wide application of low-carbon technologies and the development of a low-carbon economy.
Urban agglomeration perspective
The gap in CEP among urban agglomerations is constantly expanding, and the degree of dispersion is increasing. The CEP gap between the highest urban agglomeration and lowest urban agglomeration increased from 0.1976 in 2003 to 0.2827 in 2017. The CEP of the HBOYUA is the highest, with a mean value of 0.8672, showing an obvious growth trend, and its average annual growth rate (AAGR) is also the highest, reaching 1.670%. The CEP of the SPUA and the GZPUA is higher, both higher than the overall mean value of the basin, and shows a relatively stable growth trend with an AAGR of 0.251% and 0.139%, respectively. The CEP of the CPUA, the LXUA and the JZUA are low, with mean values of 0.6932, 0.6450 and 0.6223, respectively, which are lower than the overall mean of the watershed. Among them, the CPUA and the JZUA show a relatively stable growth trend, with AAGR values of 0.270% and 0.324%, respectively. The LXUA shows a fluctuating growth trend with an AAGR of 0.451%. The CEP of the NXAYUA is the lowest, with a mean value of only 0.5681, showing a weak growth trend with an AAGR of 0.291%.
The CEP of the seven urban agglomerations is not effective during the research period, and there are obvious differences among urban agglomerations, showing an arrangement pattern in which the urban agglomerations of the eastern region > the urban agglomerations of the western region > the urban agglomerations of the central region. The urban agglomeration of the eastern region has an excellent geographical location and has always been the focus of China’s economic development. It has abundant capital, technology and talent advantages, putting its CEP in a permanent leading position. The development of western urban agglomerations is relatively slow. Although it does not have advantages in capital, technology and talent, the western urban agglomeration has a late development and small population, its industrial structure is greener and more efficient than that of the central region, and its development model is relatively scientific. Coupled with the promotion of the “Western Development” strategy and the “Belt and Road Initiative", the CEP of western urban agglomerations is slightly higher than that of central urban agglomerations. As an important energy and industrial base in China, the central urban agglomeration has a long history of development and has certain advantages in capital, technology and human resources. However, under the dual influence of its industrial structure with heavy industry as the main driving force and extensive development mode, its carbon emissions remain high, resulting in the low CEP of urban agglomerations in central China. At the same time, due to financial and technical support, the policy advantage is not obvious, which makes the original advantage over the western region disappear, and the current CEP is lower than that of the western region.
City perspective
From the perspective of the city dimension, the average CEP of Ordos is 1.0478, and the CEP from 2003 to 2017 is greater than 1, which is effective in a real sense, indicating that the CEP of Ordos is above the frontier and that the input and output are in an effective state and reach the optimal allocation. There are 34 cities with high CEP, including Zhoukou, Qingdao and Weihai, whose average CEP is greater than 0.7000 and higher than the overall mean of the basin. This shows that the input–output of these cities is not effective, but the gap between input–output is small, and there are good opportunities for improvement. The average CEP of the other 34 cities is lower than the national average. Among them, the average CEP of 25 cities, including Zhengzhou and Xining, is higher than 0.6000, indicating that the input–output of these cities is not effective, does not match, and is difficult to improve. The mean value of 9 cities, including Lanzhou and Yinchuan, is lower than 0.6000, indicating that the input–output of these cities is in an ineffective state, and this mismatch is very difficult to improve. There are obvious differences in the CEP of 69 cities in the Yellow River Basin. There are 35 cities with high CEP, accounting for 50.724%, and these cities are mainly concentrated in the SPUA, the HBOYUA and the GZPUA. There are 34 cities with low CEP, accounting for 49.276%, and these cities are mainly concentrated in the NXAYUA, JZUA, LZUA and CPUA.
From the perspective of the development trend of the CEP of each city, the AAGR of the CEP of 38 cities, including Yulin, Hohhot, Yinchuan and Zhengzhou, accounting for 55.072%, is positive and shows an upward trend. Among them, the AAGR of 12 cities, including Yulin and Hohhot, is higher than 1.00, indicating that their CEP improved during the research period. The AAGR of the other 26 cities is between 0.033–0.954%, indicating that their CEP improved during the research period, but the improvement effect is not obvious. The AAGR of the CEP of 31 cities, including Xi’an and Jinan, accounting for 44.028%, is negative and shows a downward trend, indicating that the CEP of these cities did not improve but worsened during the research period. Cities with a positive AAGR of CEP are mainly distributed in urban agglomerations with high CEP, such as the HBOYUA and the SPUA. Cities with a negative AAGR of CEP are mainly distributed in low CEP urban agglomerations, such as the NXAYUA and JZUA.
Spatial autocorrelation test
Global spatial autocorrelation
Based on the W-1, Moran’s I is calculated using Equation (3), and the results are shown in Table 5. Except for a few years, the global Moran’s I is significantly positive in most years. This indicates that the CEP in the Yellow River Basin has significant positive spatial autocorrelation, that CEP is not spatially random, and that it has a certain agglomeration effect. At the same time, Moran’s I rose from 0.1740 to 0.2330 from 2003 to 2017 and showed an overall upward trend. This shows that the spatial correlation of CEP in the Yellow River Basin has been enhanced since 2003, and the agglomeration trend has become more significant. However, Moran’s I showed an obvious fluctuating trend during the study period. Moran’s I showed a sharp downward trend from 2003 to 2005 and then rebounded in 2006. Until 2014, Moran’s I fluctuated up and down in waves and then began to show a stable upward trend in 2015. This indicates that the spatial distribution pattern of CEP in the Yellow River Basin is not stable enough.
Moran’s I test of the CEP (2003–2016)
Moran’s I test of the CEP (2003–2016)
The global Moran’s I can only judge the positive spatial correlation of CEP but not the spatial correlation pattern between regions. A Moran scatter plot was used to further analyze the local spatial aggregation characteristics of CEP in the Yellow River Basin. Figure 5 shows the local Moran scatter plots of 2003, 2010, 2017 and the mean values.
As shown in Fig. 6, the CEP of each city in 2003 mainly presents H-H agglomeration and L-L agglomeration. Among them, 23 cities, including Ordos, Jinan and Xi’an, are in the H-H region, accounting for 33.333%, and are mainly distributed in the SPUA. Lanzhou, Yinchuan and 28 other cities fall into the L-L region, accounting for 40.580%, and are mainly distributed in the CPUA, the JZUA, the LZUA and the NXAYUA. Twelve cities, including Taiyuan and Hohhot, fall into the L-H region, and 6 cities, including Suzhou and Bozhou, fall into the H-L region, accounting for 17.391% and 8.696%, respectively, and show a trend in which the HBOYUA is the main city, while other urban agglomerations are scattered.
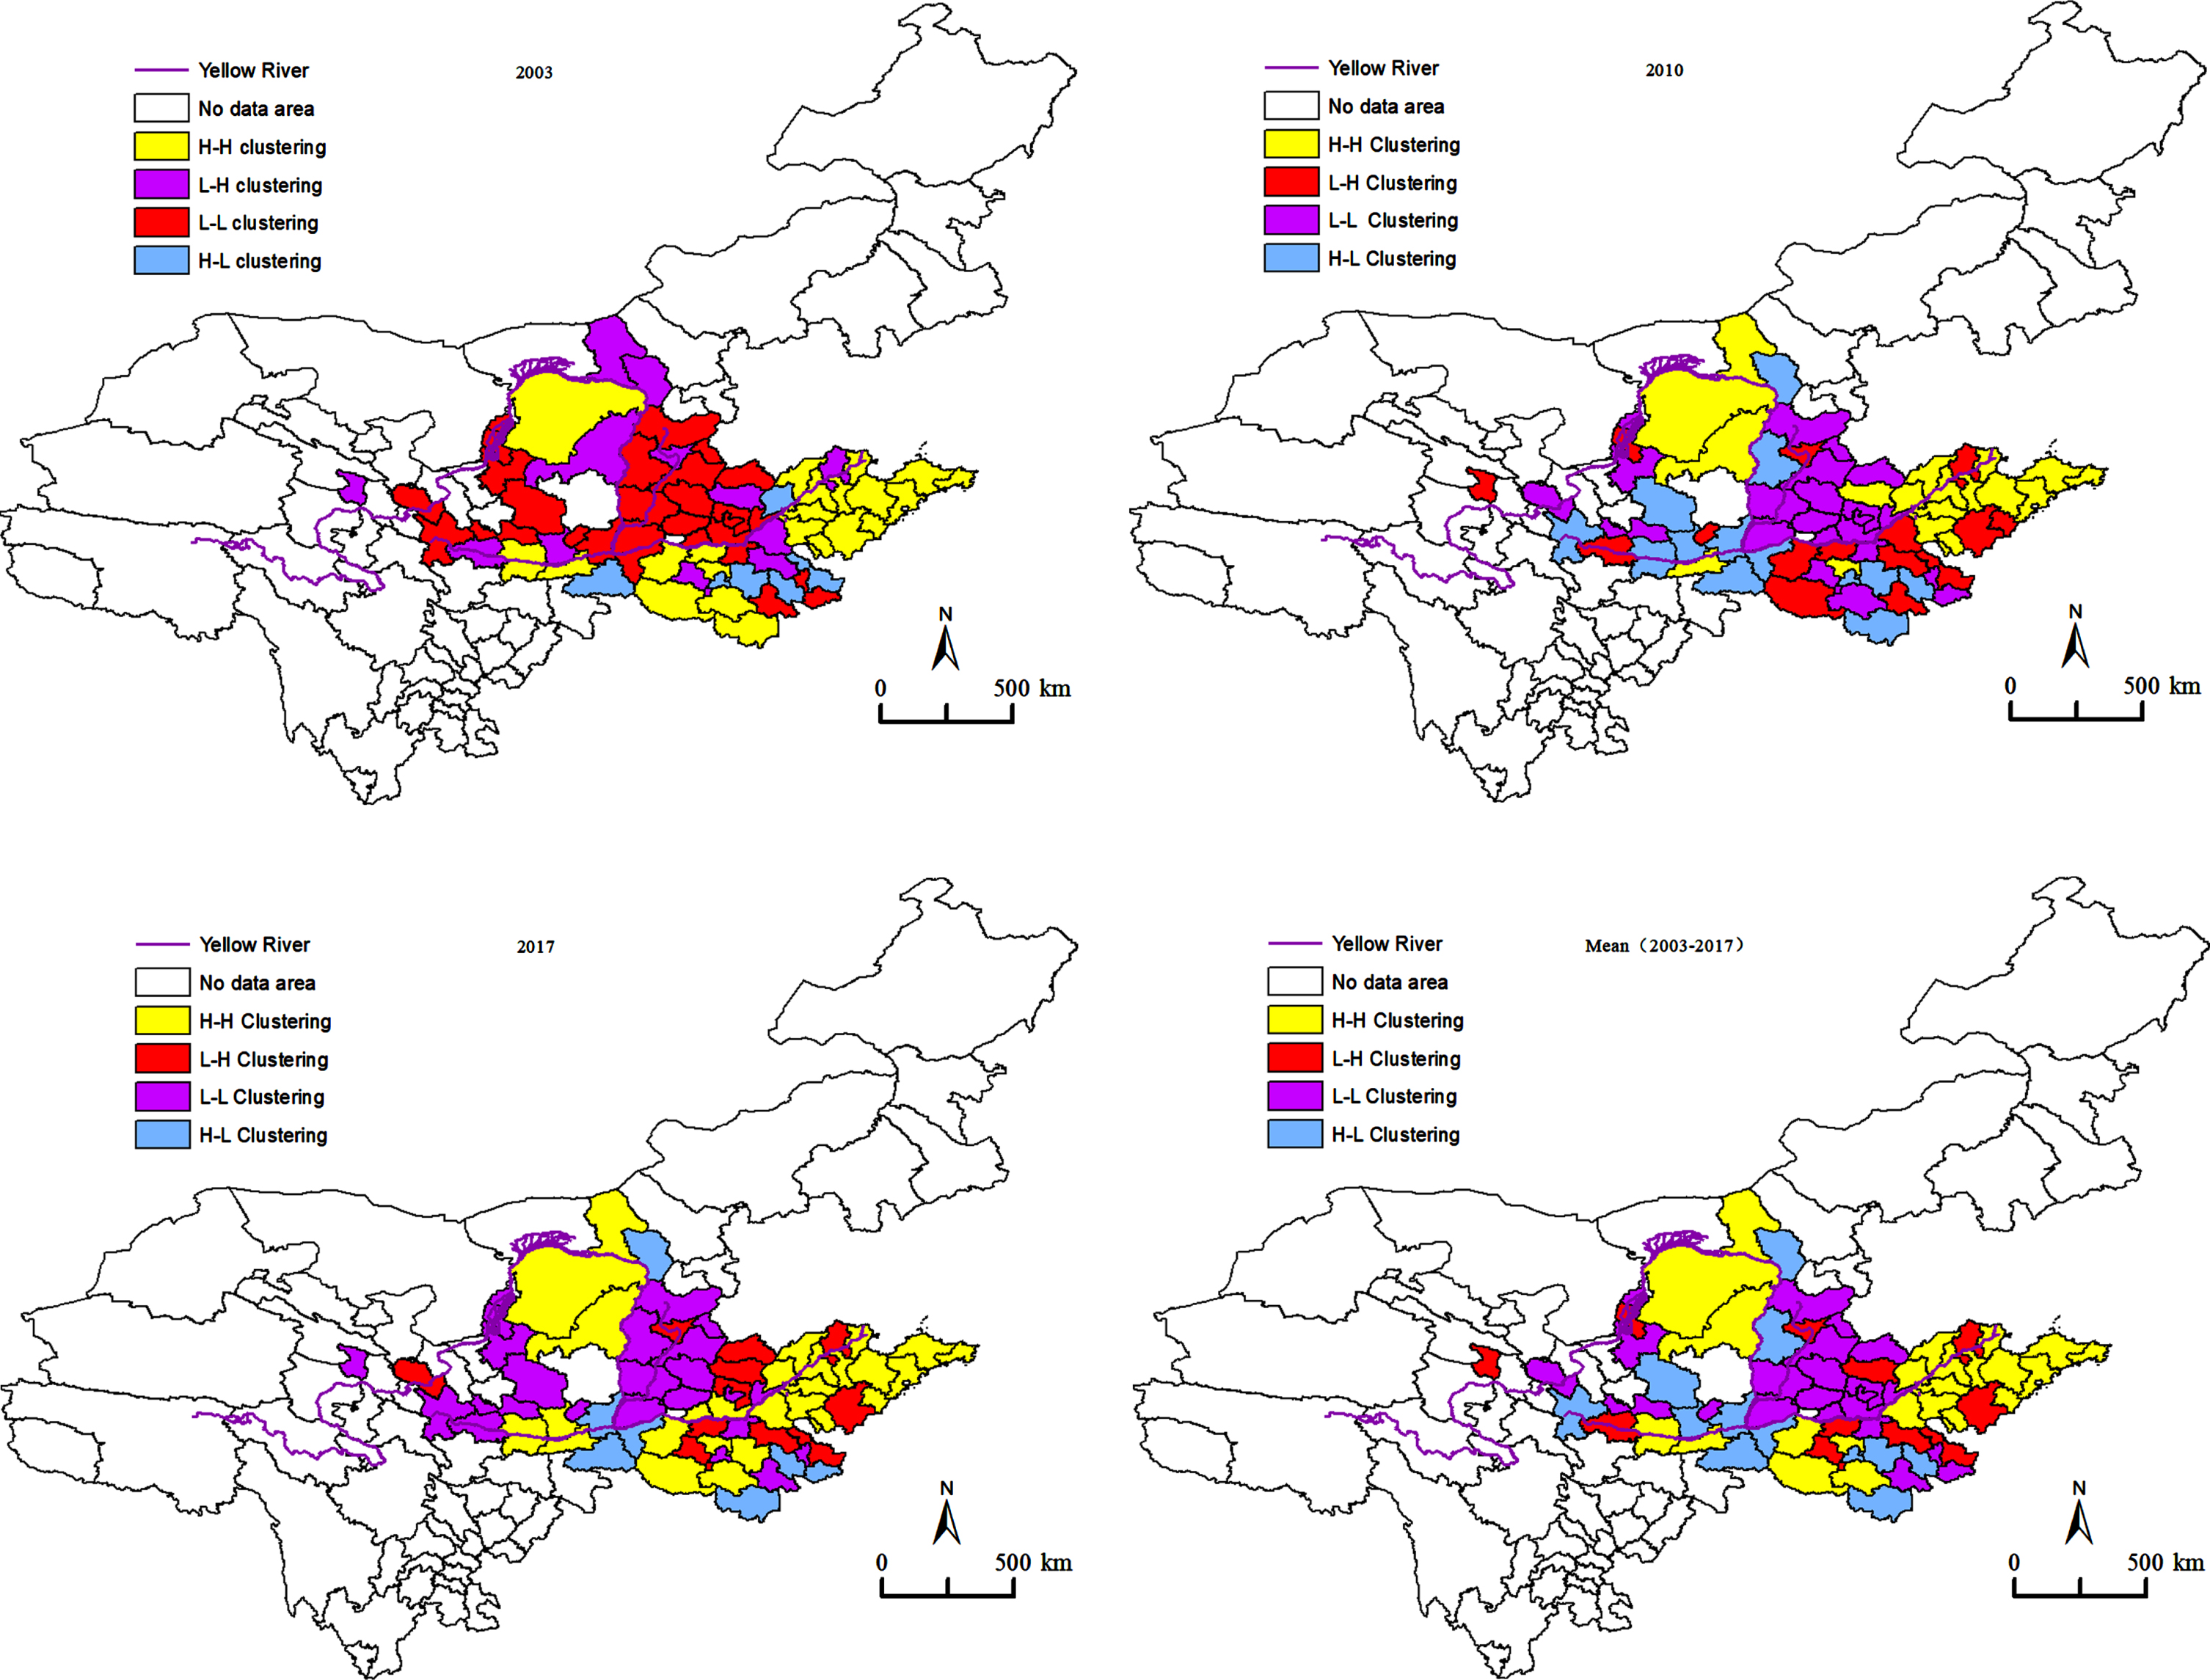
CEP moran’s I scatter chart (2003, 2010, 2017, mean).
Although the CEP of cities in 2010 was still dominated by H-H agglomeration and L-L agglomeration, the agglomeration trend weakened somewhat. Among them, the number of cities in the H-H region decreased, accounting for 27.536%, and were mainly distributed in the SPUA and the HBOYUA. The number of cities in the L-L region decreased, accounting for 31.844%, and were mainly distributed in the JZUA and NXAYUA. The number of cities in the L-H region increased, accounting for 21.739%, and were mainly distributed in the CPUA. The number of cities in the H-L region increased substantially, accounting for 18.841%, and were mainly distributed in the GZPUA. In 2017, the CEP of each city was still dominated by H-H agglomeration and L-L agglomeration, and the agglomeration trend showed an upward trend. Among them, the number of cities in the H-H region increased to 28, accounting for 40.580%, and were mainly concentrated in the SPUA and the HBOYUA. The number of cities in the L-L region remained unchanged, accounting for 33.333%, and were mainly concentrated in the JZUA, the LZUA urban agglomeration and the NXAYUA. The number of cities in the L-H region and H-L region decreased, accounting for 15.942% and 10.145%, respectively, and were mainly distributed in the CPUA and the GZPUA. Meanwhile, the spatial agglomeration pattern of the mean value of CEP is consistent with that of 2017, with only a few cities changing.
The CEP of the Yellow River Basin presents a spatial agglomeration trend. The eastern urban agglomeration shows a low-value agglomeration phenomenon due to its high level of economic development and resource utilization efficiency, while the central and western urban agglomeration shows a high-value agglomeration trend due to its lower level of economic development and low resource utilization efficiency. By comparing the spatial agglomeration of 2003, 2010, 2017 and the mean value, it can be found that the number of high-concentration cities remains unchanged, while the number of low-value cities decreases, and the number of low-high-value cities is relatively stable, while the high-low-value cities show an increasing trend. Furthermore, the agglomeration phenomenon of high values in the SPUA and the agglomeration phenomenon of low values in the JZUA and the NXAYUA are relatively stable, with strong path dependence.
Judgment and selection of the spatial econometric model
Before conducting empirical tests, an appropriate spatial econometric model needs to be selected. First, according to the test results of the effect selection (fixed effects model or random effects model) (Table 6), it can be seen that the probability value of the likelihood ratio statistic leads to rejecting both null hypotheses simultaneously at the 1% significance level. This means that the spatial econometric model with spatiotemporal double fixed effects is the best choice for this paper. Then, the specific form of the model is judged by three tests (LM, LR, and Wald) (Table 6). According to the LM test results, LM error and robust LM error were significant, but LM lag was not, and the SEM was suitable for testing the driving factors of CEP. However, the Wald and LR tests are still required to determine whether the SDM can be downgraded to these models. The results show that the test coefficients of the LR and Wald tests are significantly positive, thus rejecting the null hypothesis. Hence, the SDM cannot be reduced to the SLM and SEM, and the SDM becomes the best model for estimating the drivers of CEP. Finally, according to the above test results, this paper selects the SDM with spatiotemporal double fixed effects to investigate the driving factors of CEP.
Test results of fixed effects and random effects and LR, LM and Wald tests
Test results of fixed effects and random effects and LR, LM and Wald tests
As seen from Table 7, the spatial lag coefficient W*dep.var is 0.0977, which is significantly positive, echoing the results of the spatial effect test above and confirming once again that the CEP of the Yellow River Basin has a significant spatial correlation. This indicates that the CEP of a city will be comprehensively influenced by the CEP of surrounding cities by more than 9%.
Spatial panel regression results of the CEP
Spatial panel regression results of the CEP
Specifically, the coefficient of PD is –0.1174, which is significantly negative, showing that PD has an inhibitory effect on the improvement in CEP. At the same time, the agglomeration of people can exacerbate traffic congestion, which prevents motor vehicle fuel from being fully burned. A higher residential density will affect the wind speed so that CO2 cannot diffuse effectively; these situations will indirectly aggravate carbon pollution, which is not conducive to the improvement in CEP.
The coefficient of PGDDP is 0.1515, which is significantly positive, showing that PGGDP can significantly promote the improvement in CEP. The higher the PGGDP is, the more conducive it is to improving the investment capacity of the whole region, thereby providing more favorable material guarantees for the improvement in CEP. Meanwhile, the higher the PGGDP is, the more conducive it is to promoting the process of economic structural transformation and improving the quality of economic structural transformation.
The coefficient of TP is 0.0016, which is significantly positive, showing that TP can effectively promote the improvement in CEP. The improvement effect of TP on CEP is mainly realized by optimizing energy utilization efficiency, especially through the research and development of technological processes and equipment with high technological content and strong green environmental protection attributes to optimize the energy utilization efficiency to alleviate excessive CO2 emissions and improve CEP. In addition, TP is also beneficial for optimizing and upgrading the industrial structure and pushing forward the transformation of the economic development mode from “extensive” to “intensive", thereby indirectly improving CEP.
The coefficient of IND is 0.1961, which is significantly positive, showing that IND has a significant promoting effect on the improvement in CEP. The reasons are as follows: with the improvement in the level of industrialization, the output value of enterprises will continue to increase, which is conducive to fully tapping into the production potential of machinery and equipment, improving energy efficiency, and reducing the carbon emission intensity per unit of output. In addition, the improvement of the IND will lead to the expansion of the scale of enterprises. The expansion of the enterprise scale will bring higher profits to the enterprise, which will also allow the enterprise to have more adequate funding to absorb low-carbon processes, technologies and equipment, realize the low-carbon transformation of production, and ultimately accomplish the low-carbon transformation of enterprise development. All of these factors will promote the improvement in CEP.
The coefficient of HC is 0.0162, which is significantly positive, showing that HC can significantly accelerate the improvement in CEP. The main reasons are as follows: the higher the average number of years of public education, the higher their skill level, and the workers can use more advanced low-carbon equipment, which is beneficial to optimizing the energy utilization efficiency and emission reduction capacity of enterprises. Furthermore, with the continuous improvement in the average number of years of public education, residents’ awareness of environmental protection will be continuously enhanced, and they can consciously fulfill their environmental protection obligations, which is conducive to improving overall environmental protection.
The coefficient of ES is –0.0562, which is significantly negative, showing that ES has a very significant inhibitory effect on CEP. The proportion of thermal power generation in China has been approximately 70% for a long time. Thermal power generation consumes a large amount of coal, which is a typical high-carbon energy compared with low-carbon or zero-carbon biological energy, nuclear power and tidal energy. Therefore, coal consumption plays a crucial role in regional carbon emissions. In addition, the Yellow River Basin is limited by energy technology, energy endowment and the energy market, and other energy sources do not have the price advantage of replacing coal. Energy consumption has long relied on coal, and the overall energy efficiency is low, which will undoubtedly have a significant negative impact on CEP.
The coefficient of the primary term of IA is –0.0563, which is significantly negative, and the secondary term coefficient of IA is 0.0107, which is significantly positive. The results show that the relationship between IA and CEP is not linear but a “U"-shaped relationship first declining and then rising. The reasons for such a complex relationship may be as follows: In the early stage of the study, the number of industrial enterprises in the basin was relatively small, and the development quality of industrial enterprises was low, making it difficult to form scale effects in a short period of time, and knowledge and technology could not effectively spill over. However, at the beginning of IA, the rapid expansion of the enterprise production scale led to excessive consumption of resources and energy and a sharp increase in CO2 emissions, thus inhibiting the improvement in CEP. Since 2007, the Chinese government has stepped up environmental reviews and monitoring of environmental quality and raised the threshold for foreign investment access, which has provided motivation for the transformation and upgrading of local IA in the Yellow River Basin. The agglomeration of mature industrial clusters and high-quality industrial enterprises can effectively stimulate the scale effect and knowledge spillover effect, thereby promoting the improvement in CEP. Furthermore, agglomeration cycle theory pointed out that industrial agglomeration is a self-reinforcing process. With the passage of time, the quality of industrial agglomeration will continue to increase, and the impact on CEP will be increasingly substantial.
The coefficient of ER is –0.0746, and the coefficient of FDI is –0.0015, both of which fail to pass the significance level test, showing that they cannot effectively promote the improvement in CEP. The reason may be that under the government-led economic system, local governments focus on GDP growth, but environmental regulation and environmental governance are not sufficiently supported, and environmental costs cannot be internalized into enterprise costs, thus making the effect of the empirical results of environmental regulation on CEP nonsignificant. The reason why FDI could not have a significant impact on CEP may be that the Yellow River Basin is at the bottom of the industrial chain in the process of introducing foreign investment. Most of the FDI enterprises introduced are pollution-intensive enterprises. The investment purpose of such FDI enterprises is to transfer polluting industries, which makes the Yellow River Basin the “pollution paradise” of developed countries. However, FDI enterprises still have advantages in production technology, technical equipment and management experience, which will form a certain scale of knowledge and technology spillover to offset some of the negative effects, thus forming the current negative but unimportant situation.
When spatial lag explanatory variables and explained variables are included in the spatial econometric model, it is necessary to analyze not only the influence of explanatory variables on the region (direct effect) but also the spillover effect of regional explanatory variables on adjacent regions (indirect effect) and perform statistical tests on this basis [51–53]. This paper observes the spatial spillover effect of CEP through indirect effects, and the results can be seen in Table 8.
Spatial spillover effects of CEP
Spatial spillover effects of CEP
The indirect effect coefficient of IND is –0.4336, which is significantly negative, showing that IND has a significant negative spatial spillover effect on CEP. The reason is that industry is the main industry of energy consumption and CO2 emissions in the Yellow River Basin. As an important link between economic activities and the ecological environment, it has a great impact on resource allocation, resource consumption, and pollutant emissions that affect changes in input and output factors through structural adjustment. The type and quantity of pollutant emissions due to changes in factors play a crucial role, which inhibits the improvement in the CEP of neighboring cities.
The indirect effect coefficient of HC is –0.0757, which is significantly negative, showing that HC has a significant negative spatial spillover effect on CEP. The reason for this result may be the spatial imbalance of HC. HC with a high education level is mainly concentrated in a few economically developed central cities (Jinan, Zhengzhou, Xian). These cities attract talent from other cities, further weakening the human capital of other cities while strengthening their own. As a result, HC has a restraining effect on the improvement in CEP in the Yellow River Basin.
The indirect effect coefficient of FDI is 0.0114, which is significantly positive, showing that FDI has a significant positive spatial spillover effect on CEP. This shows that FDI will have a significant positive spatial spillover effect on CEP. This is mainly because the FDI enterprises in the Yellow River Basin are mainly pollution-intensive FDI enterprises. In the process of operation, these FDI enterprises are highly dependent on local resources, and the carbon emission pollution caused by these enterprises mainly affects local cities. However, limited by transportation costs, labor costs and other factors, the demand for resources in neighboring cities is small, so the carbon emission pressure is relatively weak. In addition, FDI enterprises have obvious advantages in production technology, technical equipment and management experience. Although these advantages cannot offset the negative impact on the city, they can effectively offset the pressure of carbon emissions on the neighboring city and even produce a certain technology and knowledge spillover effect to improve the resource utilization efficiency of the neighboring city and promote the improvement of the CEP of the neighboring city.
The indirect effect coefficients of driving factors such as ER and IA are not significant, indicating that these driving factors do not have significant spatial spillover effects on the CEP of the Yellow River Basin.
The replacement spatial weight matrix is applied to the robustness test of this paper. First, we choose to construct a nested spatial weight matrix with geographic distance and economic distance (W-2). Then, the most suitable spatial econometric model is selected according to the three tests (LM, Wald, and LR) (Table 9). Finally, a spatial econometric model is used to re-examine the empirical results. The specific robustness results are shown in Table 10 and Table 11. The significance and signs of the coefficients of each variable are basically consistent with the empirical results in Table 7 and Table 8, indicating that the core conclusions of this paper will not change greatly due to the change in the spatial weight matrix, and the research conclusions are robust and reliable.
LM, Wald and LR test
LM, Wald and LR test
Spatial panel regression results of the CEP
Spatial spillover effects of the CEP
First, the measurement results of the improved EBM model show that the overall CEP of the Yellow River Basin is relatively high, showing an upward trend of volatility. The difference in CEP among the seven urban agglomerations is large, showing the arrangement pattern of the urban agglomerations of the eastern region > the urban agglomerations of the western region > the urban agglomerations of the central region. There are also significant differences among cities, among which the cities with high CEP are mainly concentrated in the SPUA, the HBOYUA and the GZPUA, while the cities with low CEP are mainly concentrated in the NXAYUA, the JZUA, the LXUA and the CPUA. Since the CEP of the eastern region urban agglomerations is high, while the central and western region urban agglomerations still have great emission reduction potential, the state should consider the differences and characteristics of the CEP of different regions and urban agglomerations and take measures according to local conditions during the formulation of carbon emission policies in the Yellow River Basin. The urban agglomeration of the eastern region has a relatively high level of economic development, so it is necessary to take technological development as the driving force to vigorously develop knowledge-intensive industries and strengthen carbon emission regulations to effectively improve CEP. The urban agglomeration of the central and western regions has a relatively weak level of economic development, economic growth relies more on resource input, and efficiency improvement is slow. Therefore, it is necessary to enhance investment in energy-saving and emission-reduction infrastructure through policy measures and actively popularize energy-saving and emission-reduction technologies. At the same time, it should make use of the urban agglomeration’s own resource advantages, improve energy utilization efficiency through technological transformation and upgrading, and narrow the technological gap with the eastern urban agglomeration.
Second, according to the spatial correlation analysis, there is a significant spatial correlation of CEP in the Yellow River Basin, and the spatial agglomeration trend gradually increases. The urban agglomerations of the eastern region show a low-value agglomeration phenomenon, while the urban agglomerations of the central and western regions show a high-value agglomeration trend. At the same time, the CEP of a city is affected not only by its own characteristics but also by the carbon emission behavior of neighboring cities. Therefore, interregional technical cooperation and exchange between urban agglomerations should be strengthened. As a high-tech-intensive area, the urban agglomeration of the eastern region should give full play to its demonstration and diffusion effect, accelerate the transfer of advanced technology to the inland regions, and drive and assist the inland regions in carrying out technological innovation in a targeted manner. Central and western urban agglomerations should strive to escape the “low-level agglomeration center". On the one hand, we should formulate positive emission reduction policies, promote energy savings and emission reduction through industrial structure upgrading, moderately limit and replace the construction and expansion of the three major industries, develop clean and renewable energy, and vigorously promote and develop energy saving and environmentally friendly industries. On the other hand, we should break administrative regional monopolies, strengthen cooperation with the eastern urban agglomeration, draw lessons from and absorb high-quality reform results and formulate low-carbon development strategies that are suitable for every region.
Third, the spatial measurement results show that the PGGDP, TP, IND and HC are conducive to the improvement in CEP; the PD and ES will inhibit the improvement in CEP; and IA has a U-shaped impact on CEP. In addition, FDI, IND and HC also have significant spatial spillover effects on neighboring cities. However, the degree to which each driving factor has an influence is different, which indicates that policy-makers need to consider the complexity of the effect of structural factors on carbon emission performance when formulating carbon emission policies. First, we should accelerate the transformation of the traditional extensive economic development model and the GDP assessment method, and the assessment of the CEP level should be introduced into economic assessment indicators to guide and promote the high-quality development of a low-carbon economy. Second, we should actively guide the industry toward high-quality development, take the construction of mature industrial clusters and high-quality and diversified industrial agglomeration areas as the entry point for future development, enhance the integration degree of old and new industries, moderately develop emerging industries, constantly expand regional industrial clusters, achieve industry-city linkages and green development, and coordinate and optimize the total factor allocation of regional production. Third, we should take advantage of the rapid development of the information industry, big data and other emerging technologies to introduce high-tech into the “three high” industries, enhance the efficiency of resource production and utilization, improve the intelligence level of relevant industries, and achieve green production. Fourth, we should increase the proportion of clean energy consumption and actively increase the development of geothermal and nuclear energy, and other clean and renewable energies to reduce carbon emissions and improve environmental quality. Fifth, we should vigorously attract high-level and highly skilled talent from domestic and foreign sources, encourage the return of local talent, and increase benefits for imported talent.
Finally, the above conclusion indicates that the CEP and emission reduction paths of various cities in the Yellow River Basin are not the same. From a spatial perspective, studying the CEP measurement and driving factors of the Yellow River Basin urban agglomeration can provide several insights for global carbon emissions research. Firstly, it can promote international cooperation in carbon reduction of urban agglomerations. Urban agglomerations are important products of global development, and there is a certain connection and influence among the carbon emissions of different urban agglomerations. By studying the CEP and driving factors of the Yellow River Basin urban agglomeration, international cooperation can be promoted, experience and technology can be shared, and the global carbon emissions of urban agglomerations can be jointly reduced. Additionally, it can promote cross-national comparison and standardization of carbon emission data. Research on urban agglomeration carbon emissions requires a large amount of carbon emission data, and there are certain differences in the collection and processing of this data in different countries and regions. Through studying the CEP and driving factors of urban agglomerations from a spatial perspective, cross-national comparison and standardization of carbon emission data can be promoted, improving the comparability and credibility of data and providing important support for international carbon emissions research.
Declaration of competing interest
The authors declare that they have no known competing financial interests or personal relationships that could have appeared to influence the work reported in this paper.
Data availability
Data will be made available on request.
CRediT authorship contribution statement
Funding
China Postdoctoral Science Foundation (No. 2021M691572).