
Abstract
In order to overcome deficiency in wavelet analysis, people have proposed beyond wavelets based on wavelets transform, in which curvelets transform is a kind of commonly used method for signal processing. Because of directional sensitivity of its basis function, curvelets transform suggested more superior characteristics than that of wavelets in describing singularity for curve and image edges. Because the spatial distribution of stripe noise in hyperspectral image has clear directivity, so it is more reasonable that it uses Curvelet transform for image denosing. Combining with spectrum relation, curvelet transform was used in this paper for noise elimination of the hyperspectral image. The algorithm used in this paper includes three main steps. Step 1: Weighting sums of high frequency curvelet coefficients in bands containing less noise; Step 2: Replacing the high frequency curvelet transform to obtain reconstructed images with less noises. Experiments indicated that this method can carry on the effective denoising to hyperspectral image, and retained detail information well at the same time. The denoising images obtained by this method possessed a higher peak signal-to-noise ratio and better visual effects.
Introduction
Hyperspectral remote sensing images are hard to be obtained and transformed due to noise disturbance, which makes denoising technology a must for hyperspectral sensing images [1–3]. In recent years, wavelet technology is frequently applied for noise reduction as it is able to implement time-frequency analysis for signals. However, for two-dimensional images, since wavelet caused by tensor product of one-dimensional wavelet is featured by isotrope, hyperspectral remote sensing, although is able to detect information of “points”, fails to obtain information of curves, namely, failing to describe directional features of images (noises). With this into consideration, Candes and Donoho in 1999 put forward the first Cuvelet change [4, 5]. Characterized by anisotropy, the method boasts a strong directivity, therefore helpful for efficient representation of image edge. Nevertheless, Cuvelet is hardly achieved due to complex and redundant data calculation. Therefore, in 2004, Candes and Donoho came up with the second Cuvelet change [6, 7]. Afterwards, Candes and his colleagues raised the idea of realizing Cuvelet change through FDCT [8], which avoids redundant data,making it easy to obtain information.
Aisa EAGLE, hyperspectral sensing image applied in this experiment boasts high spectral resolution,the wave length of which is 400.77–999.48μm, covering whole area of visible light and its near infrared region. It can offer spectral information with 258 band for each pixel and produce a complete and continuous spectral curve.
The experiment brings a superwavelet analysis method based on second Curvelet to denoise hyperspectral images, which effectively removes noise and improves quality of images.
Methodology
Weight coefficient method is using high-frequent coefficient of less noise affected wave band to help heavily noise affected wave band to remove noise. At the same time, weights are put to different wave bands according to distance between them,and high-frequent coefficient is obtained through curve bands.
Coefficients of high frequency and low frequency of images in different directions and scales can be achieved through Curvelet change. First, Curvelet positive change is conducted in reference image(waveband image with little noise string) and noise image(waveband image with obvious noise string) to produce change coefficients of various scales. Among them, low-frequency coefficient contains a large part of power. Keeping it unchanged is an effective way to reserve spectral information. High-frequency coefficient represents strange information of signals. For waveband image (reference image), high-frequency coefficient indicates general model of the waveband image; for noise image, it indicates not only general model but also noise signals. Second, as hyperspectral images feature high specral resolution ratio, pixels of adjacent bands are very close, so are changed high-frequency coefficients. With this into consideration, weighted summation is implemented in high-frequency coefficients of adjacent reference wavebands, which can not only get approximate value of high-frequency coefficient of noise waveband,but also resume contour information disturbed by noise,thus helping waveband with large noise denoise effectively. Here is specific calculation:
Suppose λ
i
wave length for wave i, curvelet coefficients of reference wave I0 and I
N
for the point (l, k) are
Coefficient
Affected by solar flare, noises like white spots of hyperspectral images present as maximum max in Cuevelet change high-frequency coefficient. By contrast, ribbon noises are mainly small coefficients in Curve change high-frequency co efficient, so threshold is set to filter high-frequency coefficient with weight change so as to remove extreme point of data. This following shows how to set threshold: Calculating average value of high-frequency coefficients. Calculating maximum difference and minimum difference to average value according to maximum and minimum values of high-frequency coefficients. Calculating differences between each coefficient and average value. Once the difference is bigger than 95% of maximum difference or less than 95% of minimum difference, present coefficient is set to be average value with other coefficients unchanged.
Comparison of denoising effects between curvelet change images and wavelet
Experiment data are hyperspectral images from Dalian sea area. Four less noise images with different wavebands (460–760 nm) are chosen as reference data and two noise images are chosen as experiment data. Images cover an area of 256×256. All data are expressed as a and b. As is shown in Figs. 1, a-1, a-2, b-1, b-2 are reference images and a,b are noise images.
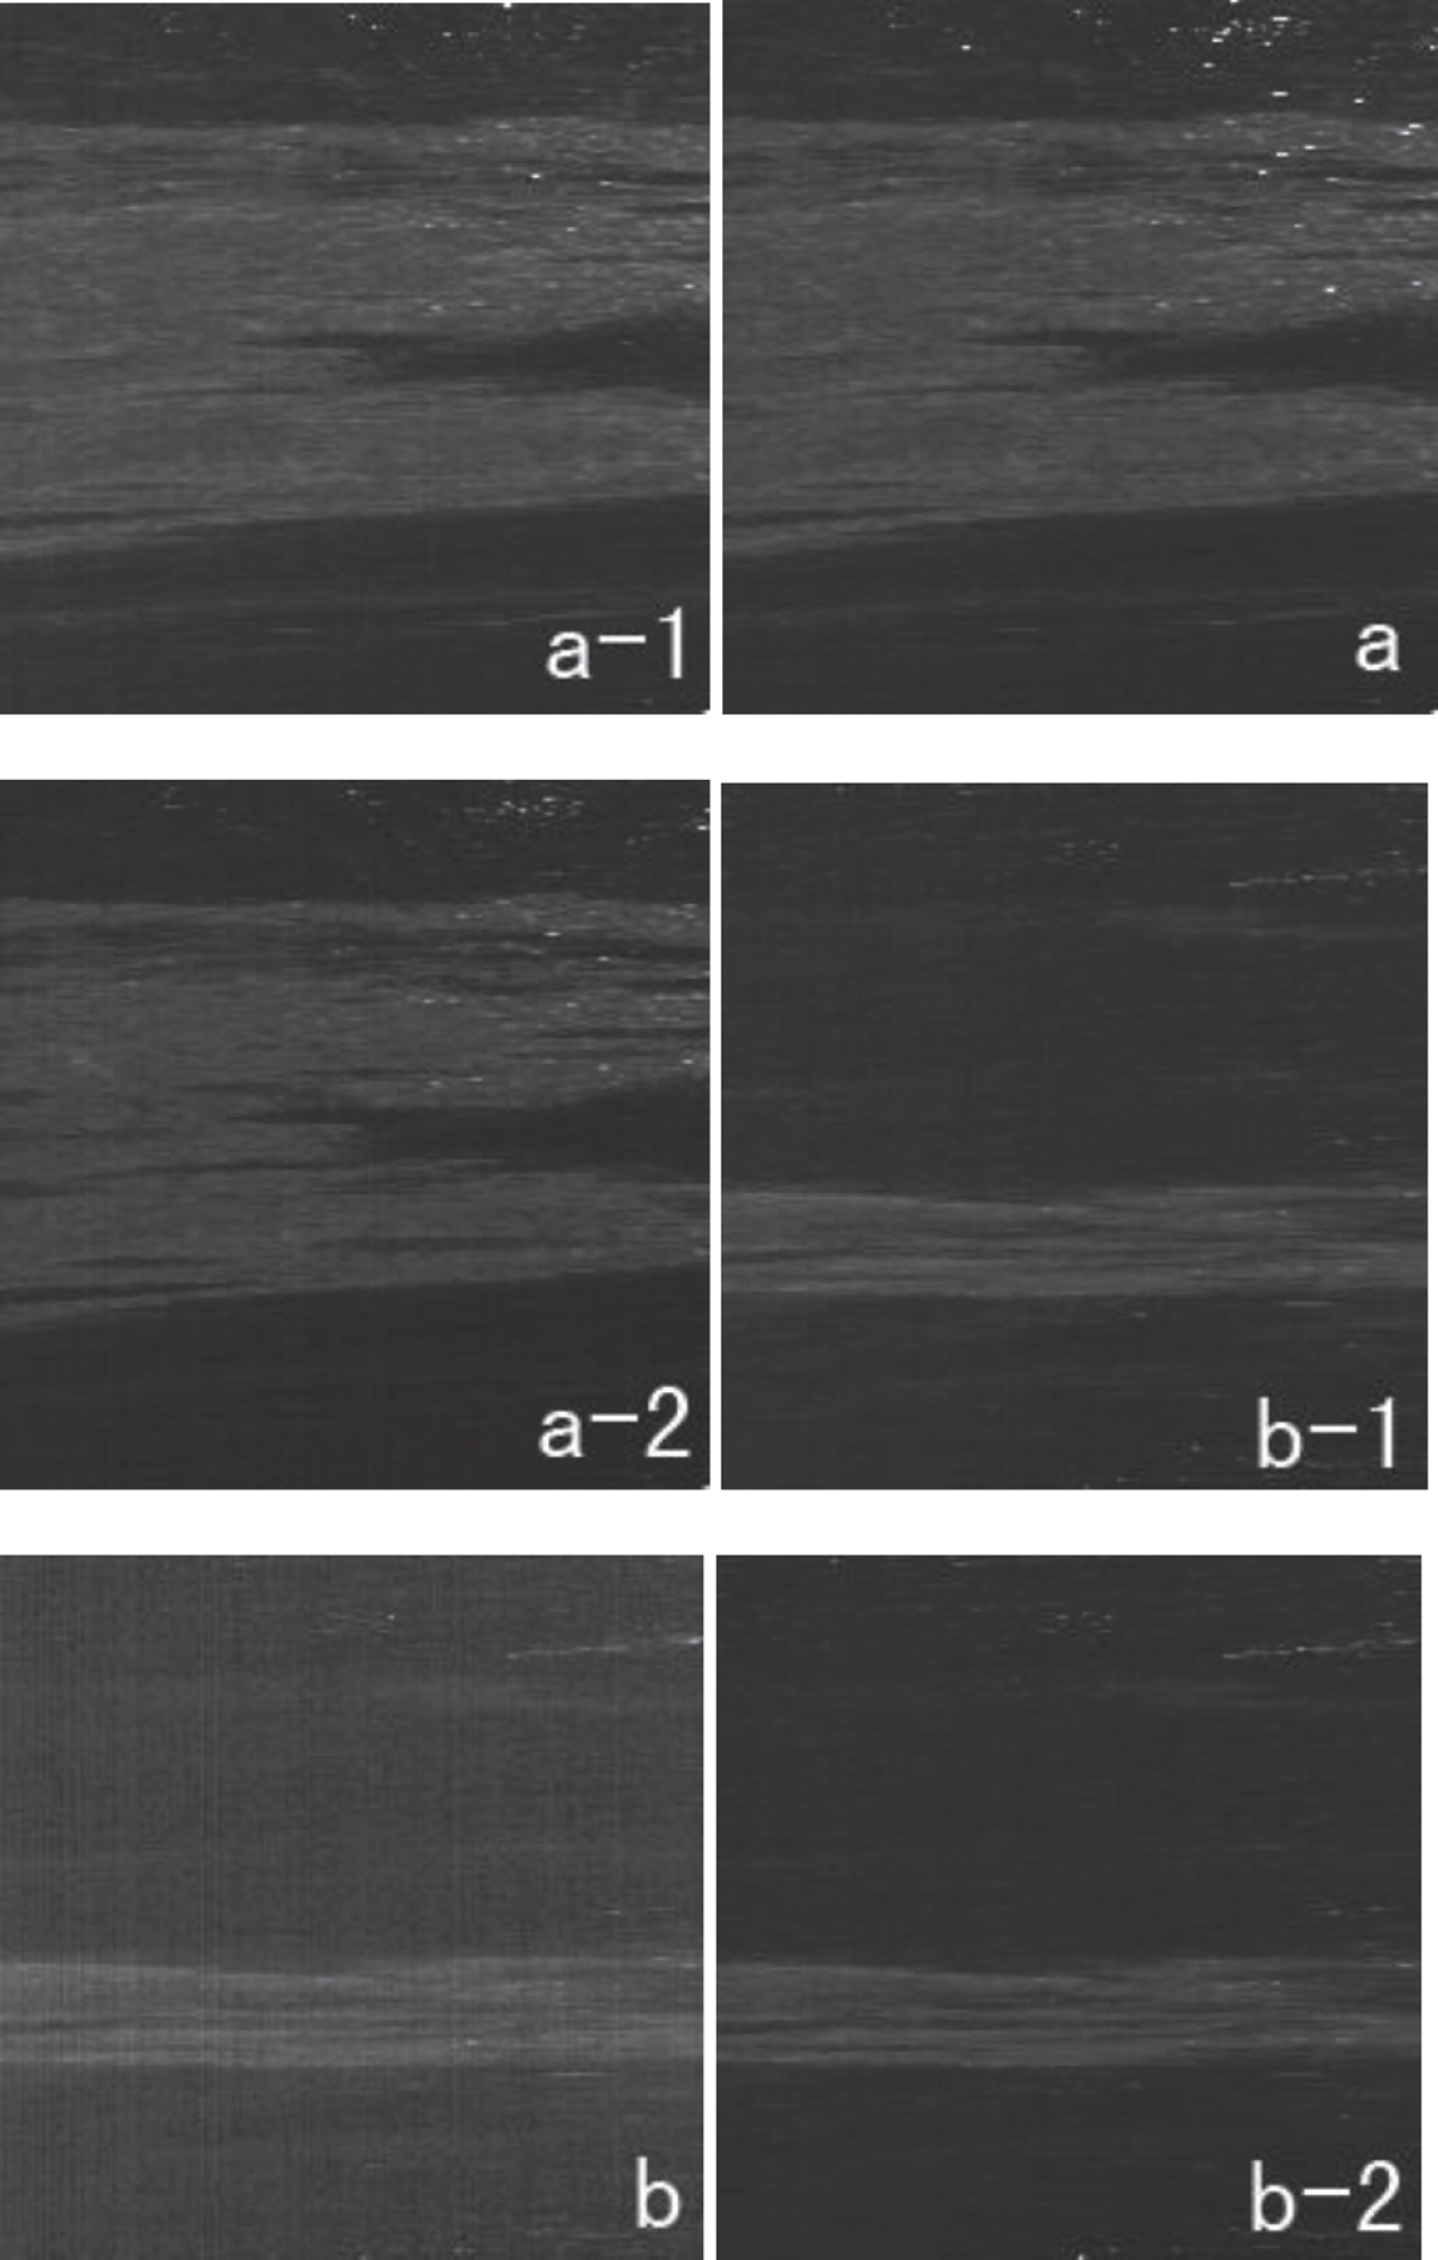
Experimental images.
Average SNR (Signal to Noise Ratio) and MSE (Mean Square Error) are used to measure denoising effect. SNR is one of standards measuring similarity between denoising image and original image. SNR is i wava band is as follows:
Among them, f (i, l, k) and g (i, l, k) respectively represents pixel values of original and denoise after images in wave band i in coordinate (l, k). M and N represent length and width of image respectively. MSE of wave band i is defined as follows:
In this paper, the results of wavelet transform are compared with the results of Curvelet transform. Wavelet denoising and Curvelet algorithm denoising are all implemented in Matlab 2015b environment. For Wavelet denoising, bior5.5 wavelet is chosen, and the image is decomposed into 3 layers. Wavelet denoising threshold is
Both Curvelet change and wavelet change are applied to denoise images with noise,and results are shown in Table 1. Table 1 shows comparative data of Curvelet change and wavelet change in SNR and MSE,indicating Curvelet change enjoys higher SNR and lower MSE. In comparison,Curve change can exactly describe the edge of image using relatively less non zero coefficient, boasting better denouncing effect.
De-noising effect comparison using curvelet at different scale
In order to figure out how different scales affect denoising effect, the experiment first conduct Curvelet change in data a according different scales. In Curvelet change, change scale is defined as log 2X - 3, among which, X is size of image, which is 256. In this way, maximum change scale is 3. Data in the second wave band is picked to receive Curvelet change in 2, 3, 4, 5 four scales. Results are shown in Table 2 and Fig. 2.

De-noising effect drawing of the images using wavelet and curvelet.
De-noising effect of images using wavelet comparison with Curvelet
As Curvelet change scale increases, high-frequency coefficient involved in denoising will increase. According to Table 2 and Fig. 3, as scale increases, it takes more time for Curvelet change denoising model to denoise. Besides, different scales enjoy various denoising effects. In comparison, working time of scale 3, scale 4 and scale 5 are 2.57 times, 4.74 times and 4.75 times more than scale 2. However, scale 5 and scale 4 share similar working time, but in terms of SNR and MSE, scale 5 is much better than scale 4. With this into consideration, the experiment sets 5 as change scale for 256×256 image.
The complexity of wavelet denoising and Curvelet denoising algorithm is analyzed. In the Matlab2015b environment, when the hyperspectral image 256*256 is used in the experiments for denoising, wavelet denoising time is 0.4421s, while the Curvelet denoising time overhead is 0. 5283s. The time overhead of Curvelet denoising and wavelet noise are equivalent. Therefore, the hyper wavelet denoising method based on Curvelet transform can be applied to the actual image denoising, which can effectively improve the image quality, and is conducive to the post-processing works such as hyperspectral image segmentation, edge extraction, classification and discrimination.
In this paper, a method of band noise elimination in hyperspectral images based on Curvelet transform is proposed, which optimizes the effect of image denoising from two aspects. Experimental result shows super wavelet change can implement spectrum resolvement of images in more scales and directions and indicate various information features including curve strange information. Superwave theory-based hyperspectral image denoising technology is superior in improving quality of images in comparison with wavelet denoising method. It can improve visual effect of images, providing more reliable and effective previous preparasion for further analyzing and treatment.
Curvelet change combined with weight coefficient boasts following merits in denoising hyperspectral images: This algorithm, bearing spectrum correlation in mind,using high-frequency coefficients of less noise wave bands to help wave bands with heavy noise denoise. Physical mechanism of image denoising are obvious. This algorithm, on the basis of superwave Curvelet change, enjoys anisotropy compared with wavelet change. Curvelet change can use less non zero coefficients to exactly describe edge of images, boasting better denoising effect compared with wavelet.
Footnotes
Acknowledgments
The authors acknowledge The scientific research project of the Hubei Provincial Education Deparment (Grant: B2017279).