



Abstract
The present study aims at identifying the main drivers underlying the development of municipal solid waste management (MSWM) so as to ensure an effective enhancement of the current waste management system and significantly improved recycling rates. Based on the factors identified in the qualitative evaluation of the deployed statistics and using fuzzy multi-criteria decision-making (MCDM), these factors are hierarchized and the competitive strategic alternative is selected/customized. The judgment of eight experts from the eight major regions of Romania has been used in the applied fuzzy AHP and TOPSIS methodologies. The robustness of the results is analyzed against the sensitivity analysis. Following the sensitivity analysis, the alternatives retained their rank so that the eight experts’ assessments have been validated. By developing a sustainable MSWM, it is claimed that the recycling rate in Romania will increase.
Keywords
Introduction
The rapid industrialization of the cities has led to the explosion of population in urban environments. The existing EU solid waste management challenges are closely linked to the recycling, re-use and recovery targets of organic waste stipulated in European directives and regulations. In accordance with the European Commission, the Indicator 11 of Sustainable Development Goals refers to the development of environmentally sustainable communities and cities. In this respect, the EU has taken important steps to reduce its impact on the environment from the point of view of mining waste generation and the exposure of the urban population to air pollution [13, 27]. Globally, the situation shows some differences from the perspective of MSWM [31]. Inappropriate elimination causes a negative impact on all components of the environment and human health [39]. At a global level, the predominant waste treatment method is storage [24, 30]. At the level of the United States, an annual quantity of 730 kg of waste / person is produced, while at EU level about 475 kg [24]. At the EU level, most countries store waste even though landfill is the least favorable option in the waste management hierarchy. A similar situation is registered in the United Kingdom [17]. Austria, on the other hand, aligns itself with the EU targets, registering a recycling rate of 57.6%. Despite that, major technology measures on collection and sorting will be needed to increase the competitiveness of MSWM [11]. Finland generates 460 kg of waste / person / year, and recycling is driven by the need to close loop material, thus reaching the principle of circular economy [15]. Various studies [11, 15–17] claim that if household waste is evaluated, it can be seen as made up of a range of materials that vary according to composition and depend on the community and consumers’ income and lifestyle, on the industrialization level, as well as on the economic development of the country and the educational level [19]. These studies also show that the season of the year and the number of people in the household influence waste quantity and composition. The larger the household, the less waste per capita is generated [22, 36].
The composition of the municipal waste in developed and developing countries has the distribution displayed in Table 1.
Municipal waste composition in different countries [16]
Municipal waste composition in different countries [16]
MSWM systems are fairly diverse depending on the country’s level of development, economic factors, environmental sustainability, information availability as well as on individual factors such as culture, level of education, level of training, workplace, etc. [32–34].
Starting from the above-mentioned considerations and the outline provided with respect to the current situation within EU and Romania, the present research aims at identifying and structuring the factors contributing to the development of a competitive MSWM, while identifying the importance exerted by MSWM factors and shaping a framework of the actions to be taken for the implementation of a competitive MSWM at the macroeconomic level of Romania. The research objectives are developed in line with EU requirements and customized for the specific situation of Romania.
The paper is structured as follows: the first part presents MSW situation in EU, and in the second part the case study of Romania (current situation, characterization of the current situation for the purpose of applying some corrective actions, and a fuzzy MCDM methodology is used to evaluate and prioritize the factors contributing to MSWM). Finally, the discussions and the main conclusions are presented.
EU-developed policies contribute to reducing the country’s environmental impact, economic efficiency, improved living conditions and, last but not least, its global sustainable development [25]. In 2017, amount of 251320 thousand tons of municipal waste was generated in the EU. In Table 2 it can be observed that recycling plays an important role, being involved in the highest amount of waste. The use of landfills is predominant in the southern European countries [13, 27]. Storage rates have declined in recent years, and recycling rates have started to increase, according to studies made by the European Commission.
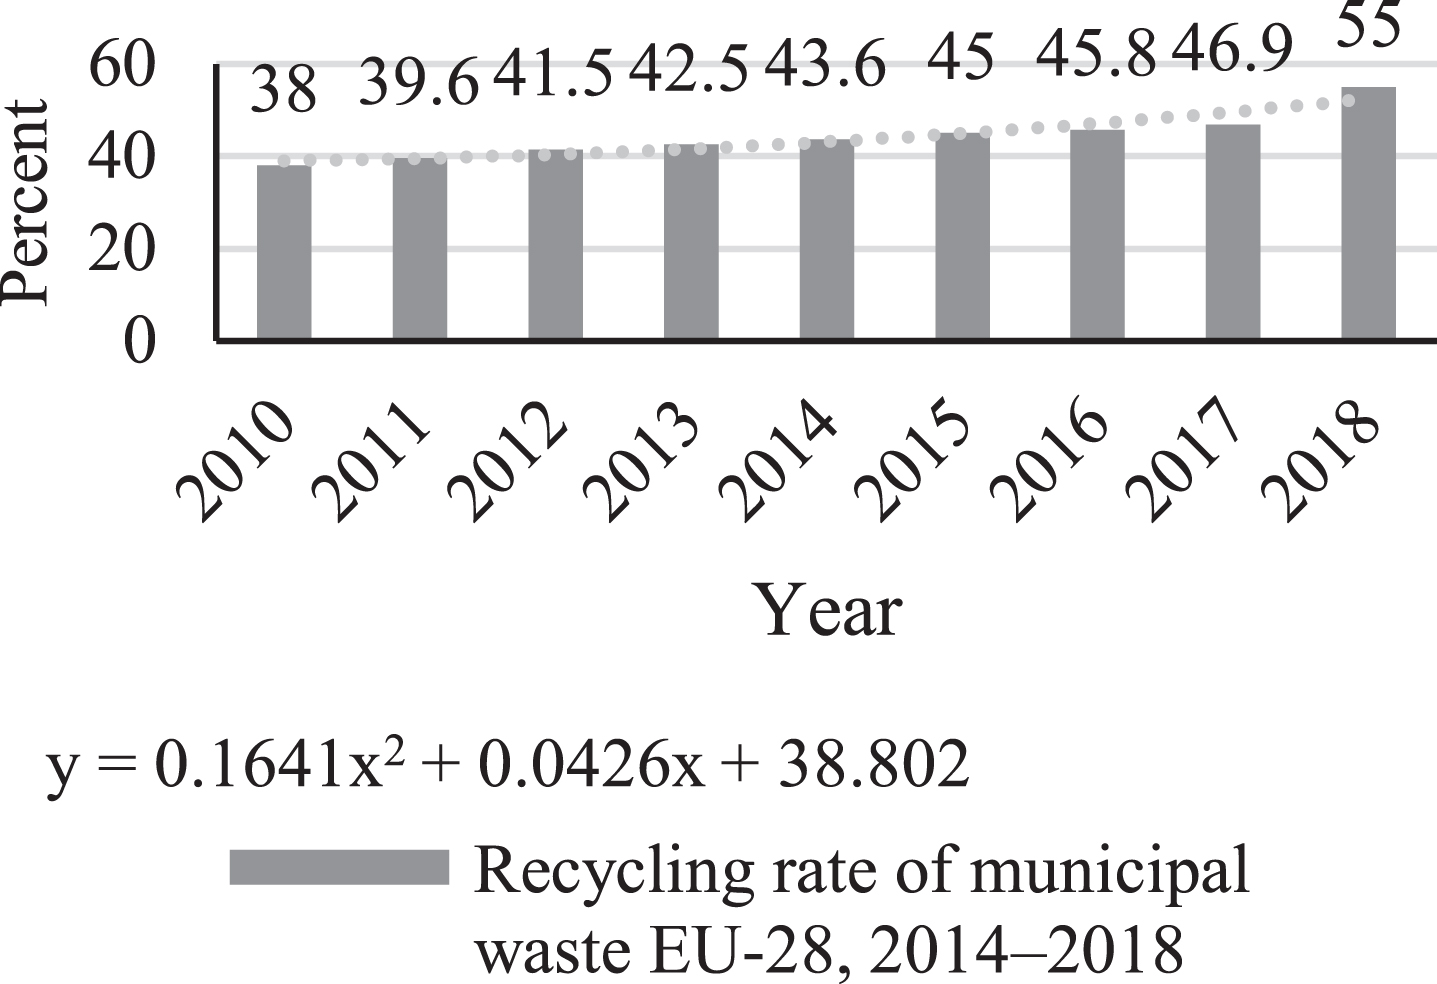
Given that a considerable amount of waste is recycled, the situation of waste recycled at the EU level is presented 55% of the municipal waste was recycled or composted in 2018. This rate has increased by 28% compared to 2000. In 2017 there is a 46.9% recycling rate, and in 2016 a 45.8% rate. Based on an assessment of the EU recycling rate presented in Fig. 1, it can be noted that the percentage has increased annually over the analyzed period 2010– 2018 [13]. The polynomial equation generated for this evolution is shown in Fig. 1.
The recycling rate of the municipal waste (% of total waste generated) EU-28, 2014– 2018 [13] (*the data for 2018 are approximate).
Assessing the recycling rate of municipal waste at the level of the EU member states, it can be seen that most countries, 60% of them, register a recycling rate above 20%. The year 2016 was chosen to exemplify the situation at the EU level, by country, as it was the most complete data series available for numerous countries.
Figure 2 shows the existing EU data series, with some countries not having the recycling rate set for 2016. For Poland, Turkey, France, Germany, and Czech Republic data are estimated. Austria has the highest percentage of municipal waste recycling, registering 57.6%, but this percentage is down 10% compared to 2014 when it was 63.5%. The next position is held by Switzerland, which in 2016 recorded a 52.5% increase of 4% compared to 2014, when it recorded a level of 50.5%. As the EU strategy outlines, the main challenge for Romania is the development of a clearly defined strategy that will apply for the separate collection and recycling of municipal waste. As available studies of the specialized literature point out [23, 34]. Romania falls within the category of countries where the development is at an average level and the inhabitants’ literacy regarding waste management is minimal. The MSWM strategy must take into account these economic and social aspects.
The recycling rate of the municipal waste (% of total waste generated) EU countries member, 2017 [13].
Current situation
Romania has been a member state of the European Union since 2007. By applying the existing Directive 2008/98/EC at the international level, Romania is required to reduce the impact on the environment and greenhouse gases. The EU’s goal is to recycle 50% of the municipal waste by 2020 [12]. For packaging materials according to European Directive 94/62/EC (glass, metals, and plastics) and for biodegradable waste, EU legislation imposes recycling targets. For these types of packaging, it is necessary to recycle at least 55% of the total weight of packaging materials contained in packaging waste, at least 60% for glass and cardboard, at least 50% for metals and at least 22.5% for plastic, of the weight of each type of material contained in the total municipal waste. For Romania, the amount of waste generated is presented in Fig. 3. The amount of waste decreased by 15% in 2018, compared to 2010, due to the beginning of the process of implementation of integrated and monitored waste collection systems, training campaigns among population and the decreasing number of inhabitants.

Municipal waste generated at the level of Romania during 2010– 2018 [27] (*the data for 2018 are approximate).
In 2010, there were 20.3 million inhabitants in the country, and in 2018 there were 19.2 million inhabitants, lower by about 4%.
The amount of municipal waste generated in 2018 is 5412 thousand tons. The biodegradable achieved 57% of the total waste generated.
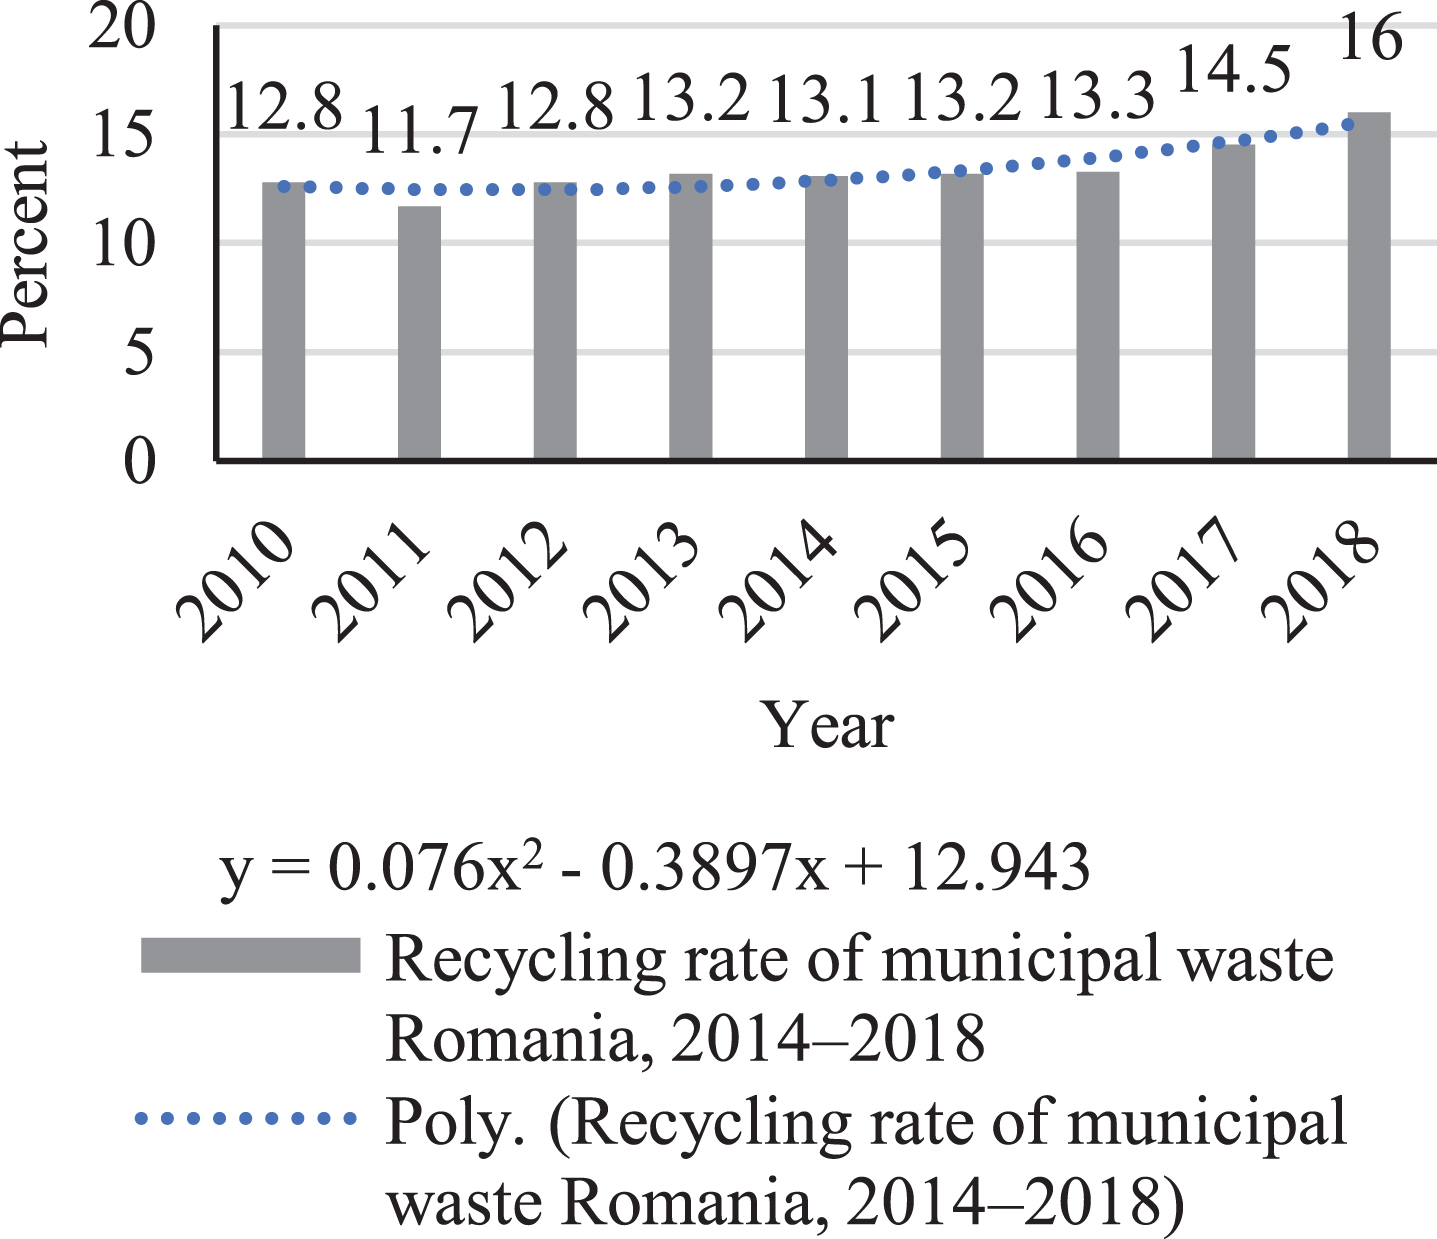
The recycling rate registered in Romania for the period 2010– 2018 is presented in Fig. 4 [27]. It can be noticed that, in 2018, there was an increase of 25% in the recycling rate compared to 2010 and of about 22% compared to 2014. The increase of the recycling rate at the level of Romania can be seen to be rather slow, so the assessment and ranking of the important factors for the development of waste recycling strategy are very important on a national level.

The recycling rate of the municipal waste (% of total waste generated) of Romania, 2014– 2018 [27] (* the data for 2018 are approximate).
The recycling infrastructure of Romania consists of: sorting stations with the capacity of 110 000 tons/year, centralized composting plants (able to treat 50 000 tons/year of biodegradable waste), local composting equipment (for residential areas that include houses), anaerobic fermentation equipment, capacity for separate fermentation (dry method and wet method), and equipment for incineration, pyrolysis and gasification.
Although municipalities have already spent between 30% and 40% of their budgets on solid waste management, the services provided still do not cover all citizens. To reduce the financial implications, municipalities should: address fundamental aspects of the sector, change citizens’ behavior and separate the sources of organic waste, provide access to basic services for underdeveloped areas and an average level of waste management literacy, as well as increase transparency and accountability in the use of public funds by developing a strategy based on continuous monitoring [1, 38].
Characterization of the current situation for the purpose of applying some corrective actions
Considering the above-mentioned facts and the different strategies existing at the national level [27] the situation in Romania can be characterized as follows: Modest sanitation actions in numerous cities due to the lack of a locally developed strategy; Lack of sanitation actions in rural areas except for the ones located in the neighborhoods of several large-sized cities; Population’s lack of civic spirit derived from the lack of information as well as from the limited or absent waste collection-related education in kindergartens, schools and universities; Prevalence of several discrepancies in the Romanian legislation disregarding already-enforced EU requirements; Low level of access to funding to develop the existing infrastructure; Insufficient actions by non-governmental organizations to support the environment and to inform the population about EU regulations;
Although Romania’s population has declined in recent years and the amount of municipal waste generated has been fluctuating (rising in 2017 as compared to 2016), the recycling rate has increased as a result of the development of efficient actions customized for current conditions in Romania, which all contribute to a sustainable MSWM.
Materials and method
The fuzzy MCDM methodology is used to evaluate and prioritize the factors contributing to MSWM. Starting from the definition of the problem, it continues with the identification of the factors based on the knowledge of the MSWM experts and then the methodology described below is applied [14].
While determining the importance of factors contributing to the development of frameworks is essential, developing strategies or schemes is equally important. The use of a numerical scale (1 to 5 or 1 to 10) to assess the importance of each factor cannot capture the whole of the human reasoning [2, 29]. The analytic hierarchy process (AHP) as MCDM is an approach close to human reasoning, accepting relative appreciation. The use of the AHP method with numbers from 1 to 9, or another scale, does not take into account experts’ uncertainty during the evaluation. The use of fuzzy logic also takes into account the uncertainty associated with mapping a number [7, 28]. Thus, the linguistic evaluation of MSWM factors is done with triangular fuzzy numbers (TFN). By using this fuzzy AHP methodology, a ranking of MSWM factors has been achieved. Following the ranking of MSWM factors, the implementation strategy is selected using the Technique for Order of Preference by Similarity to Ideal Solution (TOPSIS) [4, 9].
The Fuzzy AHP method
The Set Theory was introduced for the first time by Latfi Zadeh in 1965, and fuzzy logic was derived from this theory to be used in various applications [8, 20, 21]. The Fuzzy triangular numbers are used.
Applying the fuzzy AHP method leads to the following steps:
1. Building the hierarchical structure of the criteria that contribute to the development of a competitive MSWM. The hierarchical structure is developed in accordance with the needs of the problem to be solved.
2. Forming fuzzy pairwise comparison matrix of criteria and determining the weighting of decisions. The Saaty scale is used to compare the pairs of criteria [8, 35]. The decision-maker will compare criteria on a two-by-two basis using triangular fuzzy numbers. For example, if the scale chosen for the comparison of the two criteria is 1, this means that the two criteria have the same importance of the analysed issue. The fuzzy triangular number scale (l, m, u) is (1,1,1). If the selected scale is 3, this means that the first criterion is more important than the second criterion.
The consistency ratio (CR) value must be within certain limits based on the number of evaluated criteria.
3. Determine the synthetic value/relative weight for each decision criterion using the relationship, illustrated in Equation (1)
S i is the value of the correlation of the criterion on line j with the one on column I, and (li, mi, ni) is a TFN.
The value
Obtaining the transposition
And the transposition uses the relationship,
These values will be also fuzzy triangular values. The consistency of the normalized matrix containing the information obtained is verified. The value and vectors of this matrix are determined.
4. The degree of possibility (the bigness degree of Si) is determined,
If
The relationship, illustrated in Equation (7) is equivalent with the relationship, illustrated in Equation (8)
5. Calculating the weights by the possibility degree. The degree of possibility for a fuzzy convex number to be larger than convex fuzzy numbers k, M
i
(i = 1, 2, 3, …, k) is defined using the relationship, illustrated in Equation (9).
Assuming the relationship, illustrated in Equation (10),
Then the weight of the factor is given by the relationship illustrated in Equation (11),
S1 (i = 1, 2, …, n), are n elements.
At this step, the vector of the decision weights will be determined by calculating the average values. These values represent the decision weights of the criteria selected for analysis.
6. By normalizing the previous values we get the vector W of the normalized weights related to the decisional criteria. This vector is obtained by applying the relation, illustrated in Equation (12).
Hwang and Yoon have proposed the TOPSIS (Technique for Order of Preference by Similarity to Ideal Solution) method [35]. This is a technique for order preference by similarity to ideal solutions. The method selects the alternative closest to the positive ideal solution and the furthest to the negative ideal solution. The fuzzy method TOPSIS uses linguistic variables and sorts preferences according to the closeness coefficient [8, 35]. For the application of the TOPSIS method, there are a number of developed tools, and ETL software plays an essential role in business intelligence for present research.
The steps of TOPSIS method are presented below:
The normalized decision matrix is calculated. The normalized value nij is obtained by applying the relation, illustrated in Equation (13).
b. The weighted normalized decision matrix is calculated. The weighted normalized value vij is obtained by applying the relation, illustrated in Equation (14).
wi – the weight of the ith attribute or criterion,
c. The positive-ideal and negative-ideal solutions are determined. These solutions are obtained by applying the relation illustrated in Equation (15).
O – benefit criteria, I – cost criteria.
d. By using the n-dimensional Euclidean distance, the separation measures are calculated. The separation of each alternative is presented obtained, the ideal solution, by applying the relation illustrated in Equation (16), and the separation from the negative-ideal solution by applying the relation illustrated in Equation (17).
e. The relative closeness to the ideal solution is calculated. The relative closeness of the alternative Aj with respect to A + is obtained by applying the relation, illustrated in Equation (18).
j = 1, ... , m
f. The preference order is ranked.
The sensitivity analysis is typically performed to verify the robustness of the results obtained. Whenever there is uncertainty about an estimation of the parameters or hierarchies achieved, the sensitivity analysis can be applied [8]. This technique is used to determine how the values of the independent variables will influence a certain dependent variable within a set of assumptions. In the case of the fuzzy AHP and TOPSIS methodology, the application of the sensitivity analysis is performed to test the accuracy and effectiveness of the proposed solutions [20, 35].
The proposed framework for assessing and prioritizing the factors for the development of a competitive MSWM
The model proposed for assessing and prioritizing the factors contributing to the development of an MSWM is presented in Fig. 5. Based on its experience and literature [8, 35] the categories of factors that are the subject of this assessment and their prioritization are established. These data represent the input variables for applying the AHP fuzzy methodology. After determining the factors to be evaluated, data from experts is collected. Based on the data obtained from the experts, the matrix of the compared criteria is established. We calculate relative weights of elements and the ratio consistency.
The proposed framework for the development of a competitive MSWM in Romania.
The next step is the calculation of the relative weights. Finally, the normalizer vector is obtained, which is a non-fuzzy value. Thus, at the end of the fuzzy AHP methodology, the hierarchy of factors contributing to the development of a competitive MSWM system is achieved. The development of a competitive MSWM in Romania is a prominent problem since the recycling rate is below 15% and the deficiencies in the waste management are stringent.
Using a methodology close to human reasoning and common appraisals helps to increase the efficiency of the proposed model [3, 40].
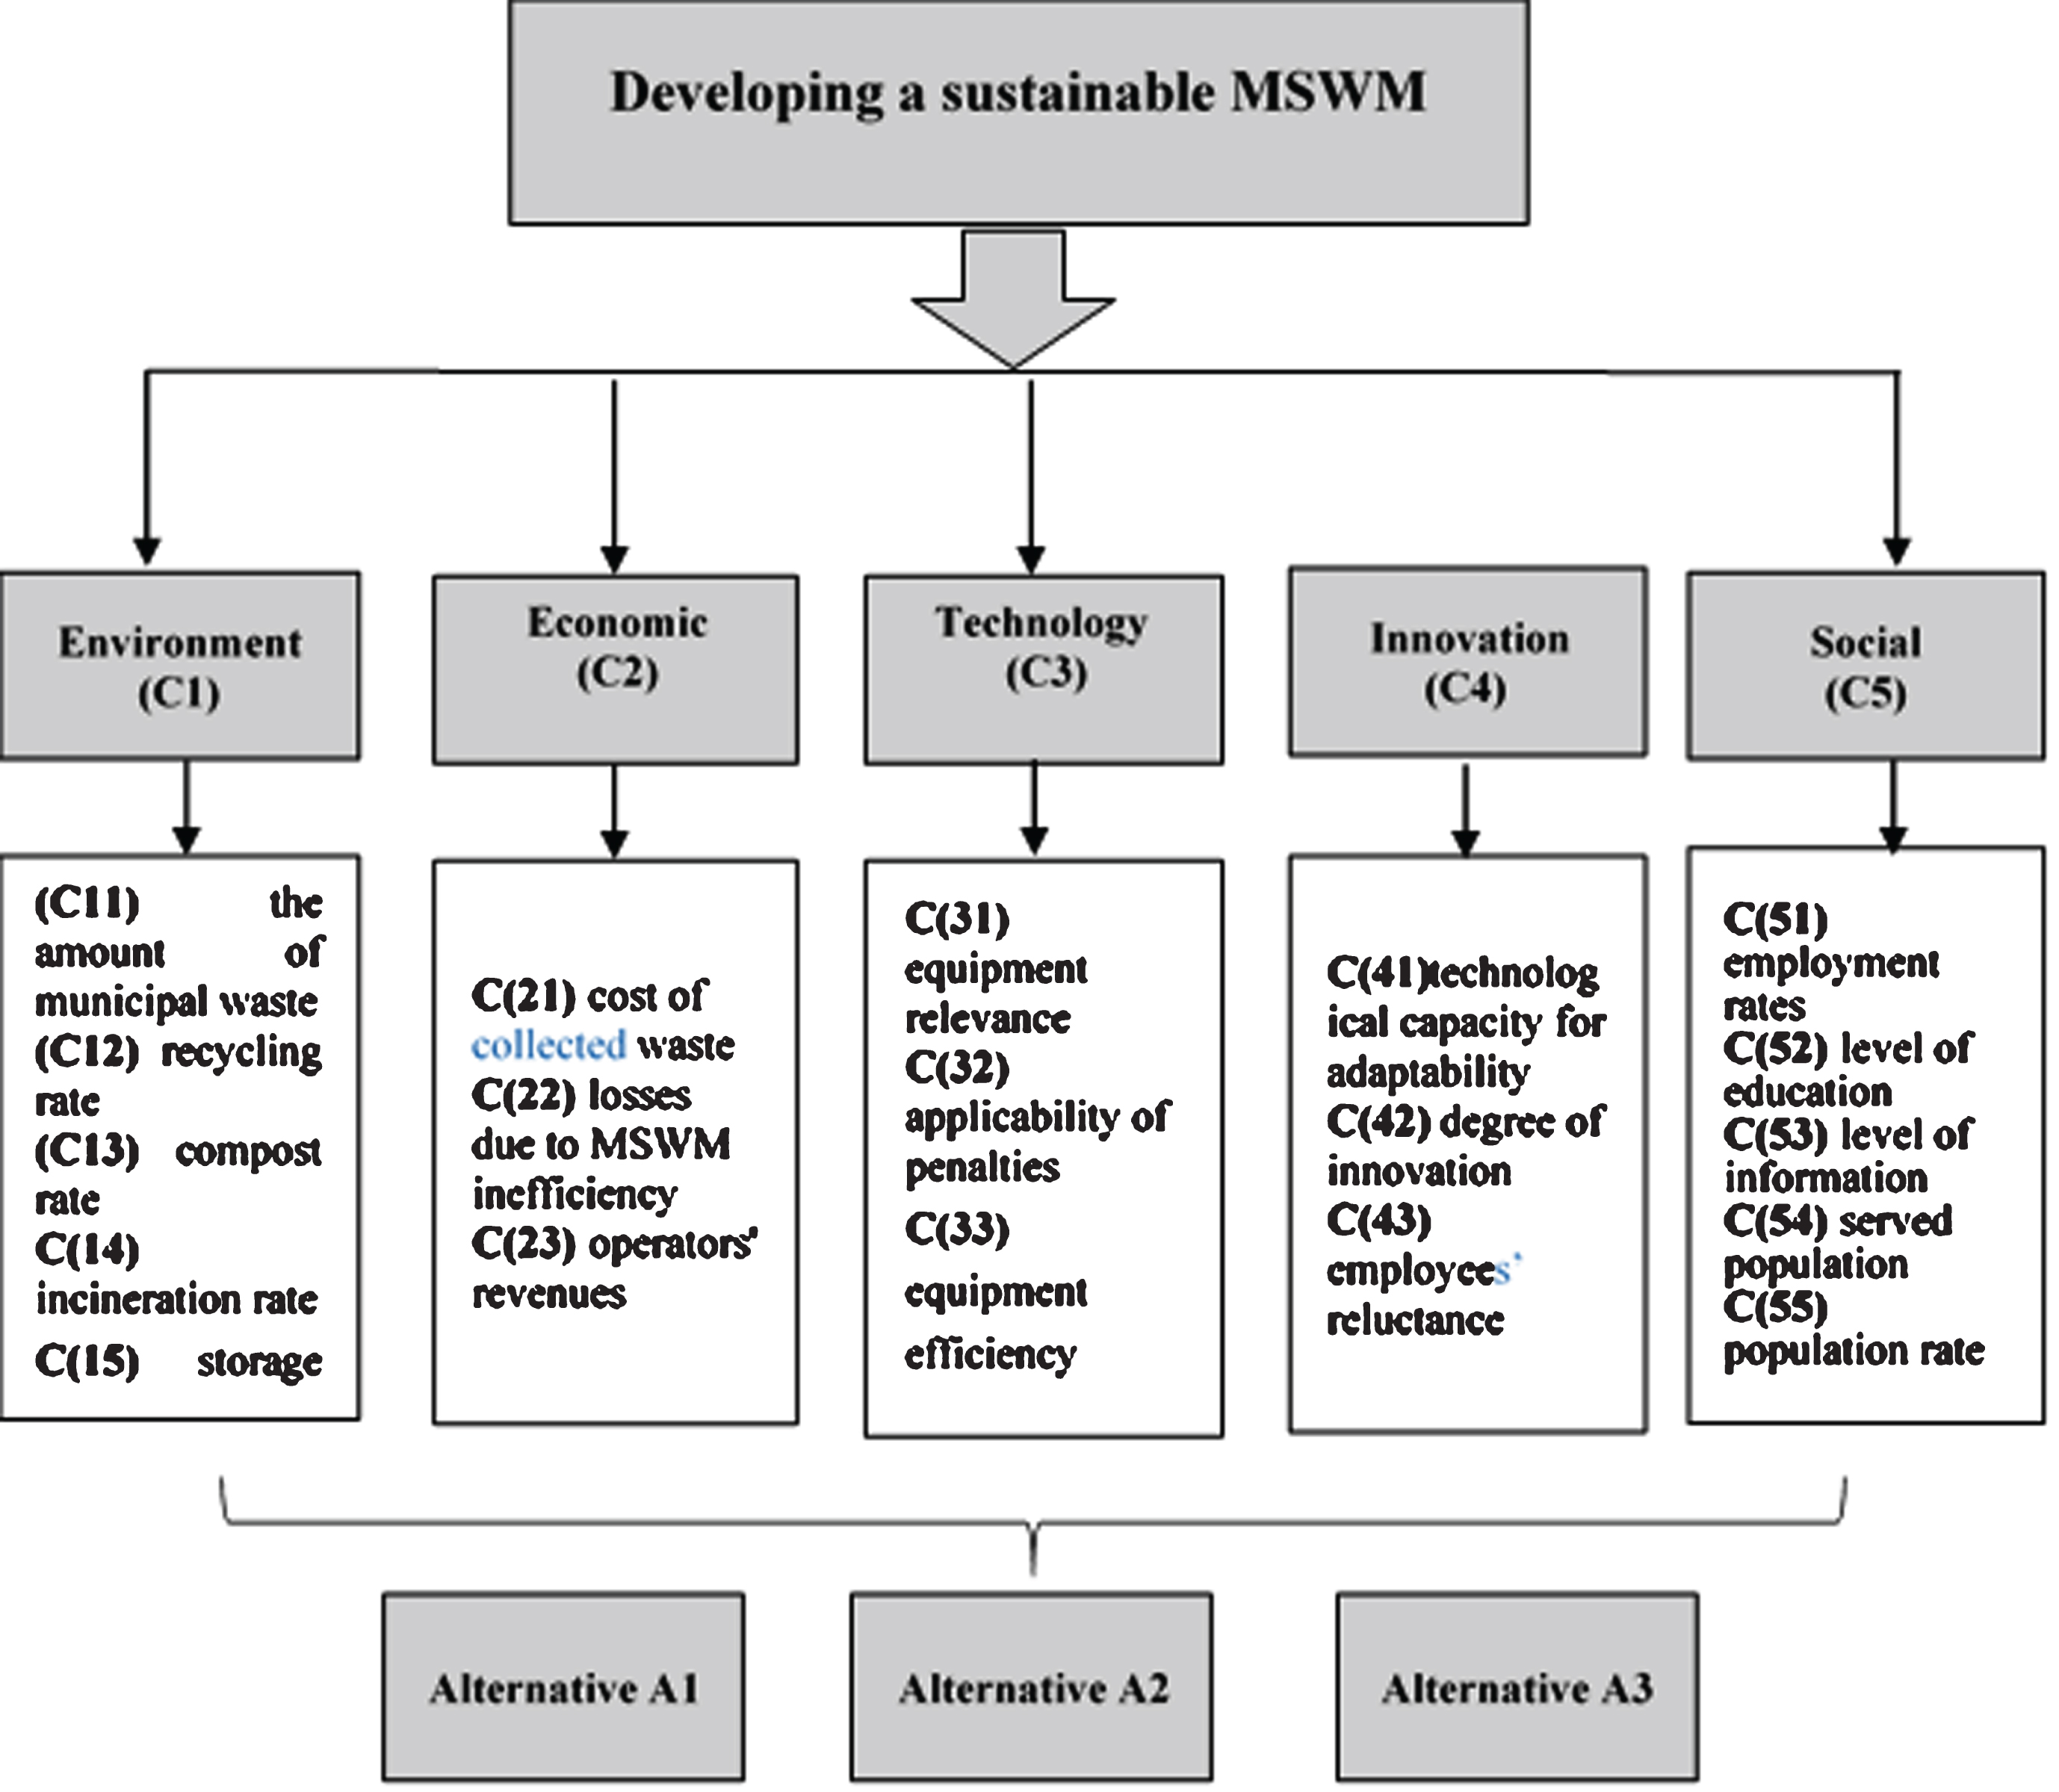
This section presents the results obtained by applying the proposed framework from Fig. 5 and the steps outlined above. The categories of factors and subfactors considered for prioritization are presented in Fig. 6, and then the application of the AHP fuzzy methodology to obtain a competitive MSWM is shown. Such an improved system is needed since Romania lacks an MSW management. Improving management practices contributes to a sustainable national and global development.

Hierarchical structure of factors and subfactors considered for the present research.
The review of specialized literature combined with the assessment of the various judgements issued by waste experts has enabled the outline of those categories of factors that contribute to a genuine increase of the MSWM efficiency and the recycling rate. They include: environmental, economic, technological and social factors [3, 40] The objective of this research is to develop a competitive MSWM by prioritizing the factors and subfactors tangential to the field in question. The hierarchical structure of these factors and subfactors is rendered in Fig. 6.
The categories of factors that impact the development of a competitive and sustainable MSWM are:
Environment (C1) – which involves factors that influence waste management. The factors considered for evaluation and prioritization are: (C11) the amount of municipal waste; (C12) recycling rate; (C13) compost rate; (C14) incineration rate; and (C15) storage rate. Economic (C2) – which refers to the economic implications of municipal waste management. The factors considered for this category are: (C21) cost of collected waste; (C22) losses due to MSWM inefficiency; (C23) operators’ revenues. Technology (C3) – which is linked to the level of technology and infrastructure existing at a national level. It also includes a national methodology and sets of regulations. This category includes: (C31) equipment relevance; (C32) the applicability of penalties; (C33) equipment efficiency. Innovation (C4) – which entails the ability to adapt to technological advances and to implement innovative concepts in waste management. This category includes: (C41) technological capacity for adaptability; (C42) innovation degree; (C43) employees’ reluctance. Social (C5) – which refers to the national population. This category includes: (C51) employment rates; (C52) level of education; (C53) level of information on waste collection; (C54) served population; (C55) population rate involved in selective collection and recycling.
Experts from the eight regions have proposed three alternatives that are compatible with the current situation in Romania. The MSWN follows: Alternative A1 – education of the population at different levels of training, information and awareness of the importance of MSWM. Alternative A2 – Accessing funding sources for building and developing the infrastructure Alternative A3 – Increasing R & D in companies
Based on this hierarchy, the results obtained following the application of the fuzzy MCDM methodology are presented.
Applying the AHP fuzzy methodology to prioritize factors/subfactors
Considering the hierarchical structure in Fig. 6, the experts’ judgments and the AHP fuzzy methodology, the authors determine the weights of all categories of factors and subfactors considered for evaluation in order to hierarchize their importance.
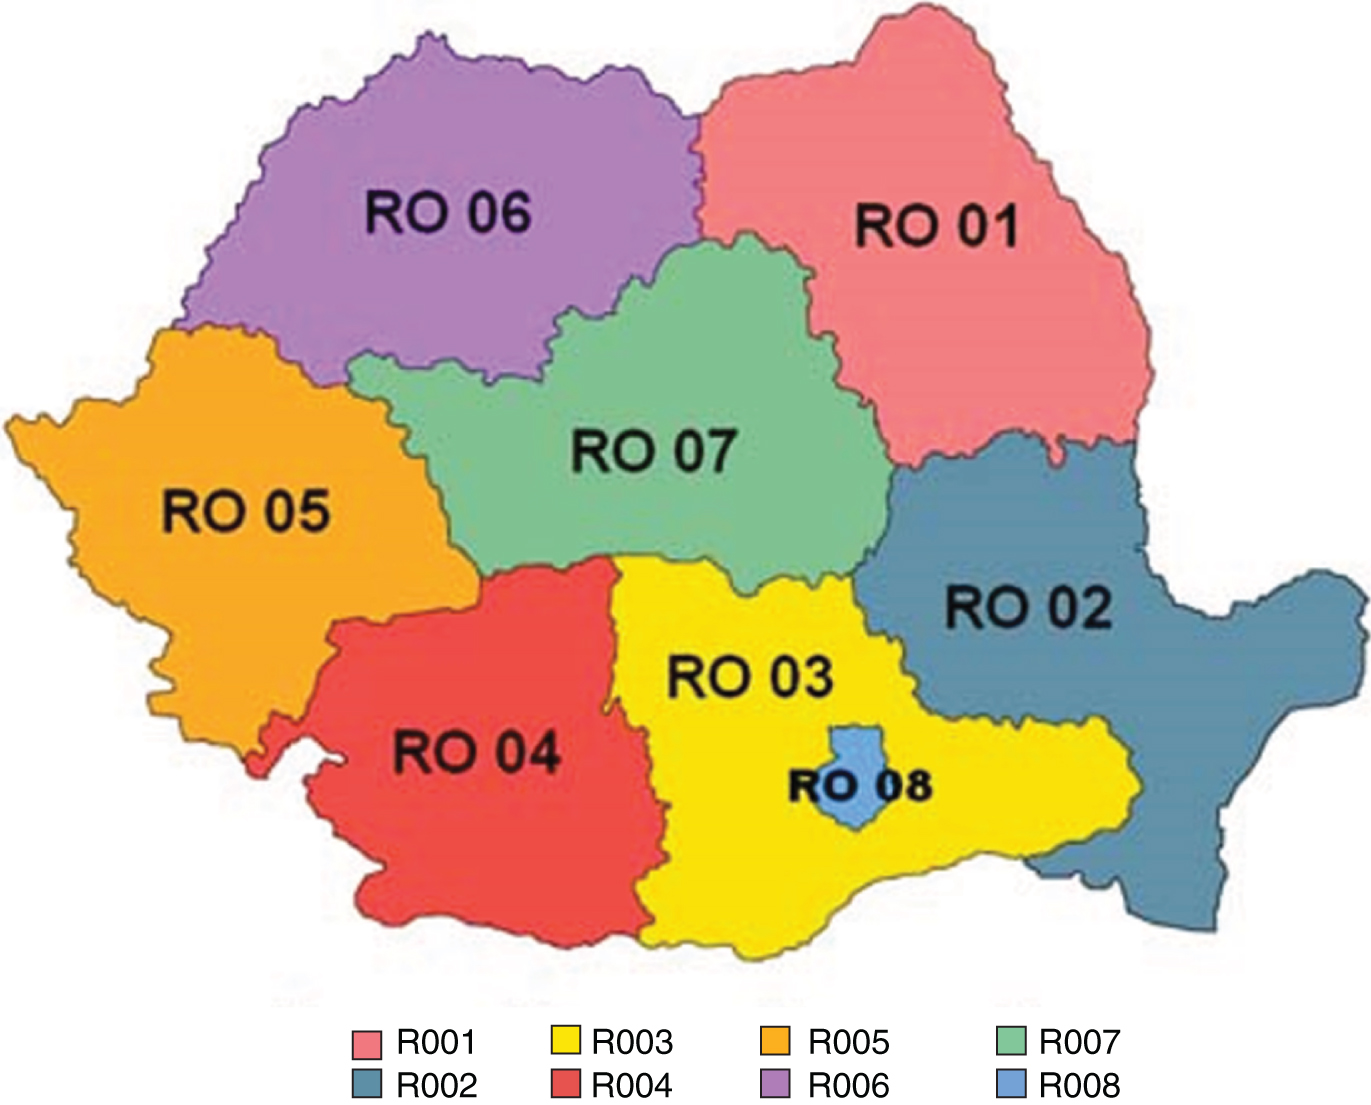
For the judgment applied in this methodology, in-depth interviews were conducted with eight experts from Romania, one expert selected from each development region. Development regions are eight statistical sizes that correspond to the EU NUTS II divisions (Nomenclature of Territorial Units for Statistics) and do not have legal personality. These Development Regions include: North-East Region (RO 01), South East Region (RO 02), South-Muntenia Region (RO 03), South West Region (RO 04) (RO 05), the Northwest Region (RO 06), the Centre Region (RO 07) and the Bucharest Region (RO 08) (Fig. 7).
The hierarchical structure is presented in Fig. 6. Making comparisons between pairs of factors and subfactors. The detailed methodology for the five categories of factors is further applied. The same methodology applies to each category of subfactors for which the final result is presented in Table 3. The fuzzy aggregate matrix of the comparison of the categories of factors with respect to the main objective of the research The number of comparisons must be at least equal to relationship illustrated in Equation (8). A value of 0.29 was obtained. For a 5×5 matrix, the value of the consistency ratio must be less than 1.12. This requirement is fulfilled. As a result, the judgment used in comparing the categories of factors could be considered correct. If this rate is within acceptable limits, move to the next step, otherwise the judgment resumes from step 2. Using the relationships illustrated in Equations (1) and (4), the synthetic values of the five categories of factors considered for evaluation are obtained. These data are presented in Table 4.
Preliminary calculation of synthetic values for the five categories of factors
The eight development regions of Romania [13].
And the synthetic values for the five categories of criteria are also FTNs with values:
Calculation of relative and normalized weights is made using the relations illustrated in Equations (8), (9) and (10). Table 5 shows the values obtained. Calculating the weights by the possibility degree d′ (C1) = min(1, 1, 1, 1) = 1 d′ (C2) = min(0.764, 1, 1, 1) = 0.764 d′ (C3) = min(0.080, 0.235, 1, 1) = 0.080 d′ (C4) = min(0.615, 0.706, 0.891, 1) = 0.615 d′ (C5) = min(0.844, 0.712, 0.612, 1) = 0.612 W′ = (1, 0.764, 0.080, 0.615, 0.612) W vector of normalized weights related to decisional criteria. This vector is obtained by applying the relation, illustrated in Equation (11).
Calculation of relative weights and normalized weights for the five categories considered
Following the fuzzy AHP methodology, the following hierarchy of the categories of factors considered to be assessed was obtained: environment, economic, technology, innovation, and social. This hierarchy of criteria, based on the judgments of the eight experts, is presented in Table 6.
The weight criteria for the five categories of factors considered for this research
Following the application of the fuzzy AHP methodology, it has resulted that the environment criterion is ranked first in terms of importance for the improvement of MSWM. On the second position is the economic criterion, followed by the social one. The last two positions are held by the technology and innovation criteria.
After applying the fuzzy AHP methodology for each category of subfactors the situation presented in Table 7 has emerged.
Criteria weight, local weight and global weight for developing a sustainable MSWM
Local weight was calculated by applying the AHP fuzzy methodology and the global weight was obtained by determining the multiplication between local weight and weight. If two local or global weights have the same value, the experts decide which of them stands as priority. Finally, the overall rankings are presented; they are shown on the “global rank” column.
For the hierarchy of alternatives, the fuzzy TOPSIS method was used. Linguistic ratings are used for the subcriteria of five criteria. For this evaluation, the ETL software was used and the following hierarchy of alternatives was obtained in Table 8. The evaluation is based on the judgments of the eight experts. This hierarchy was made according to the closeness coefficient.
The weight criteria for the five categories of factors considered for this research
This section makes an inventory of the results obtained and highlights their practical applicability. With respect to the hierarchy of the five categories of factors, the following aspects can be claimed: 19 factors were identified for the categories in question, (5 factors for the “environment” category, 3 factors for the “economic” category, 3 factors for the “technology” category, 3 factors for the “innovation” category, and 5 factors for “Social”). The technology and innovation criteria are placed on the last two categories in the hierarchy of categories inasmuch as Romania is among the countries with an average development and its ability to integrate the new technologies and to apply the concepts of innovation is limited. This limitation is mainly driven by limited financial resources. In order to improve the real-time MSWM, awareness actions on the importance of selective collection should be made for the population with the currently-existing resources. This action does not entail considerable costs. The criteria on the first two positions are environmental (with a weight of 0.33) and economic (with a weight of 0.25). As stated in this research (12), social and environmental factors are important to increase the MSMW competitiveness. At Romania’s level, the gross domestic product will decrease by 3.6% in 2019, compared to 6.8% in 2018. The absorption capacity of European funds is reduced on average in Romania. The average take-home salary in Romania in 2019 is around 3,075 RON per month (652 Euros or $ 750) compared to 1,644 euros in the EU. Taking into account the economic situation of Romania, the social and environmental factors are associated with the economic factors, which are ranked second. Third place in the hierarchy of categories is “social” with a weight of 0.21, followed by “innovation” with a weight of 0.20. This means that the inhabitants’ involvement in the improvement of the management system is very important. As shown by local rates, (C51) employment rates and (C52) levels of education, the level of education of the population contributes to improving society and increasing the recycling rate. Simultaneously the factor (C53) information on waste collection, which has a local weight of 0.211 and a total weight of 0.044, is important for the population. Continuous information of the population to increase recycling is vital. A considerable proportion of the population is not aware of the significance of the bin’s colours [1–3]. The “technology” category is on the last position because the experts considered that the equipment owned at the current level is medium as the driving technique, but there are major deficiencies in informing the population and the major impact of the waste on the environment. From the perspective of global ranks, one can notice that the first three positions are (C11) the amount of municipal waste with 0.099, (C21) the cost of collected waste by 0.096, and (C23) operators’ revenues by 0.092. Indeed, these factors are very important for the national strategy because the directives require all EU countries to reduce their waste by 2020. At present, the recycling rate in Romania is below 15%, and the amount of waste and storage costs are an important problem to be solved by an enhanced MSWM. Factors (C41) adaptability of technological capacity with a global weight of 0.081, (C12) recycling rate with 0.081, and (C43) employees’ reluctance with 0.076 are the factors on the following positions in the global ranking. The use of adequate equipment to increase the recycling rate is very important, and employees need to know clearly the objectives of the organizations.
The authors have further developed a sensitivity analysis to test the accuracy and effectiveness of the proposed framework and to analyse the outcomes. For this analysis, several situations/scenarios are discussed where weights have a value of 10%, 20% and 30% lower than the base weight and by 10%, 20% and 30% higher than the basic weight.
Figure 8 presents the results for which the sub-criteria related to “Environment” become more important or less important. It can be noticed that as (C11) becomes more important, the A1 alternative increases. Exits A2 and A3 do not present significant differences. If (C12) becomes less important, there is a slight decrease in A3 score. If (C13) fluctuates, there are no significant changes.
Sensitivity analysis results of sub-criteria in environmental group.
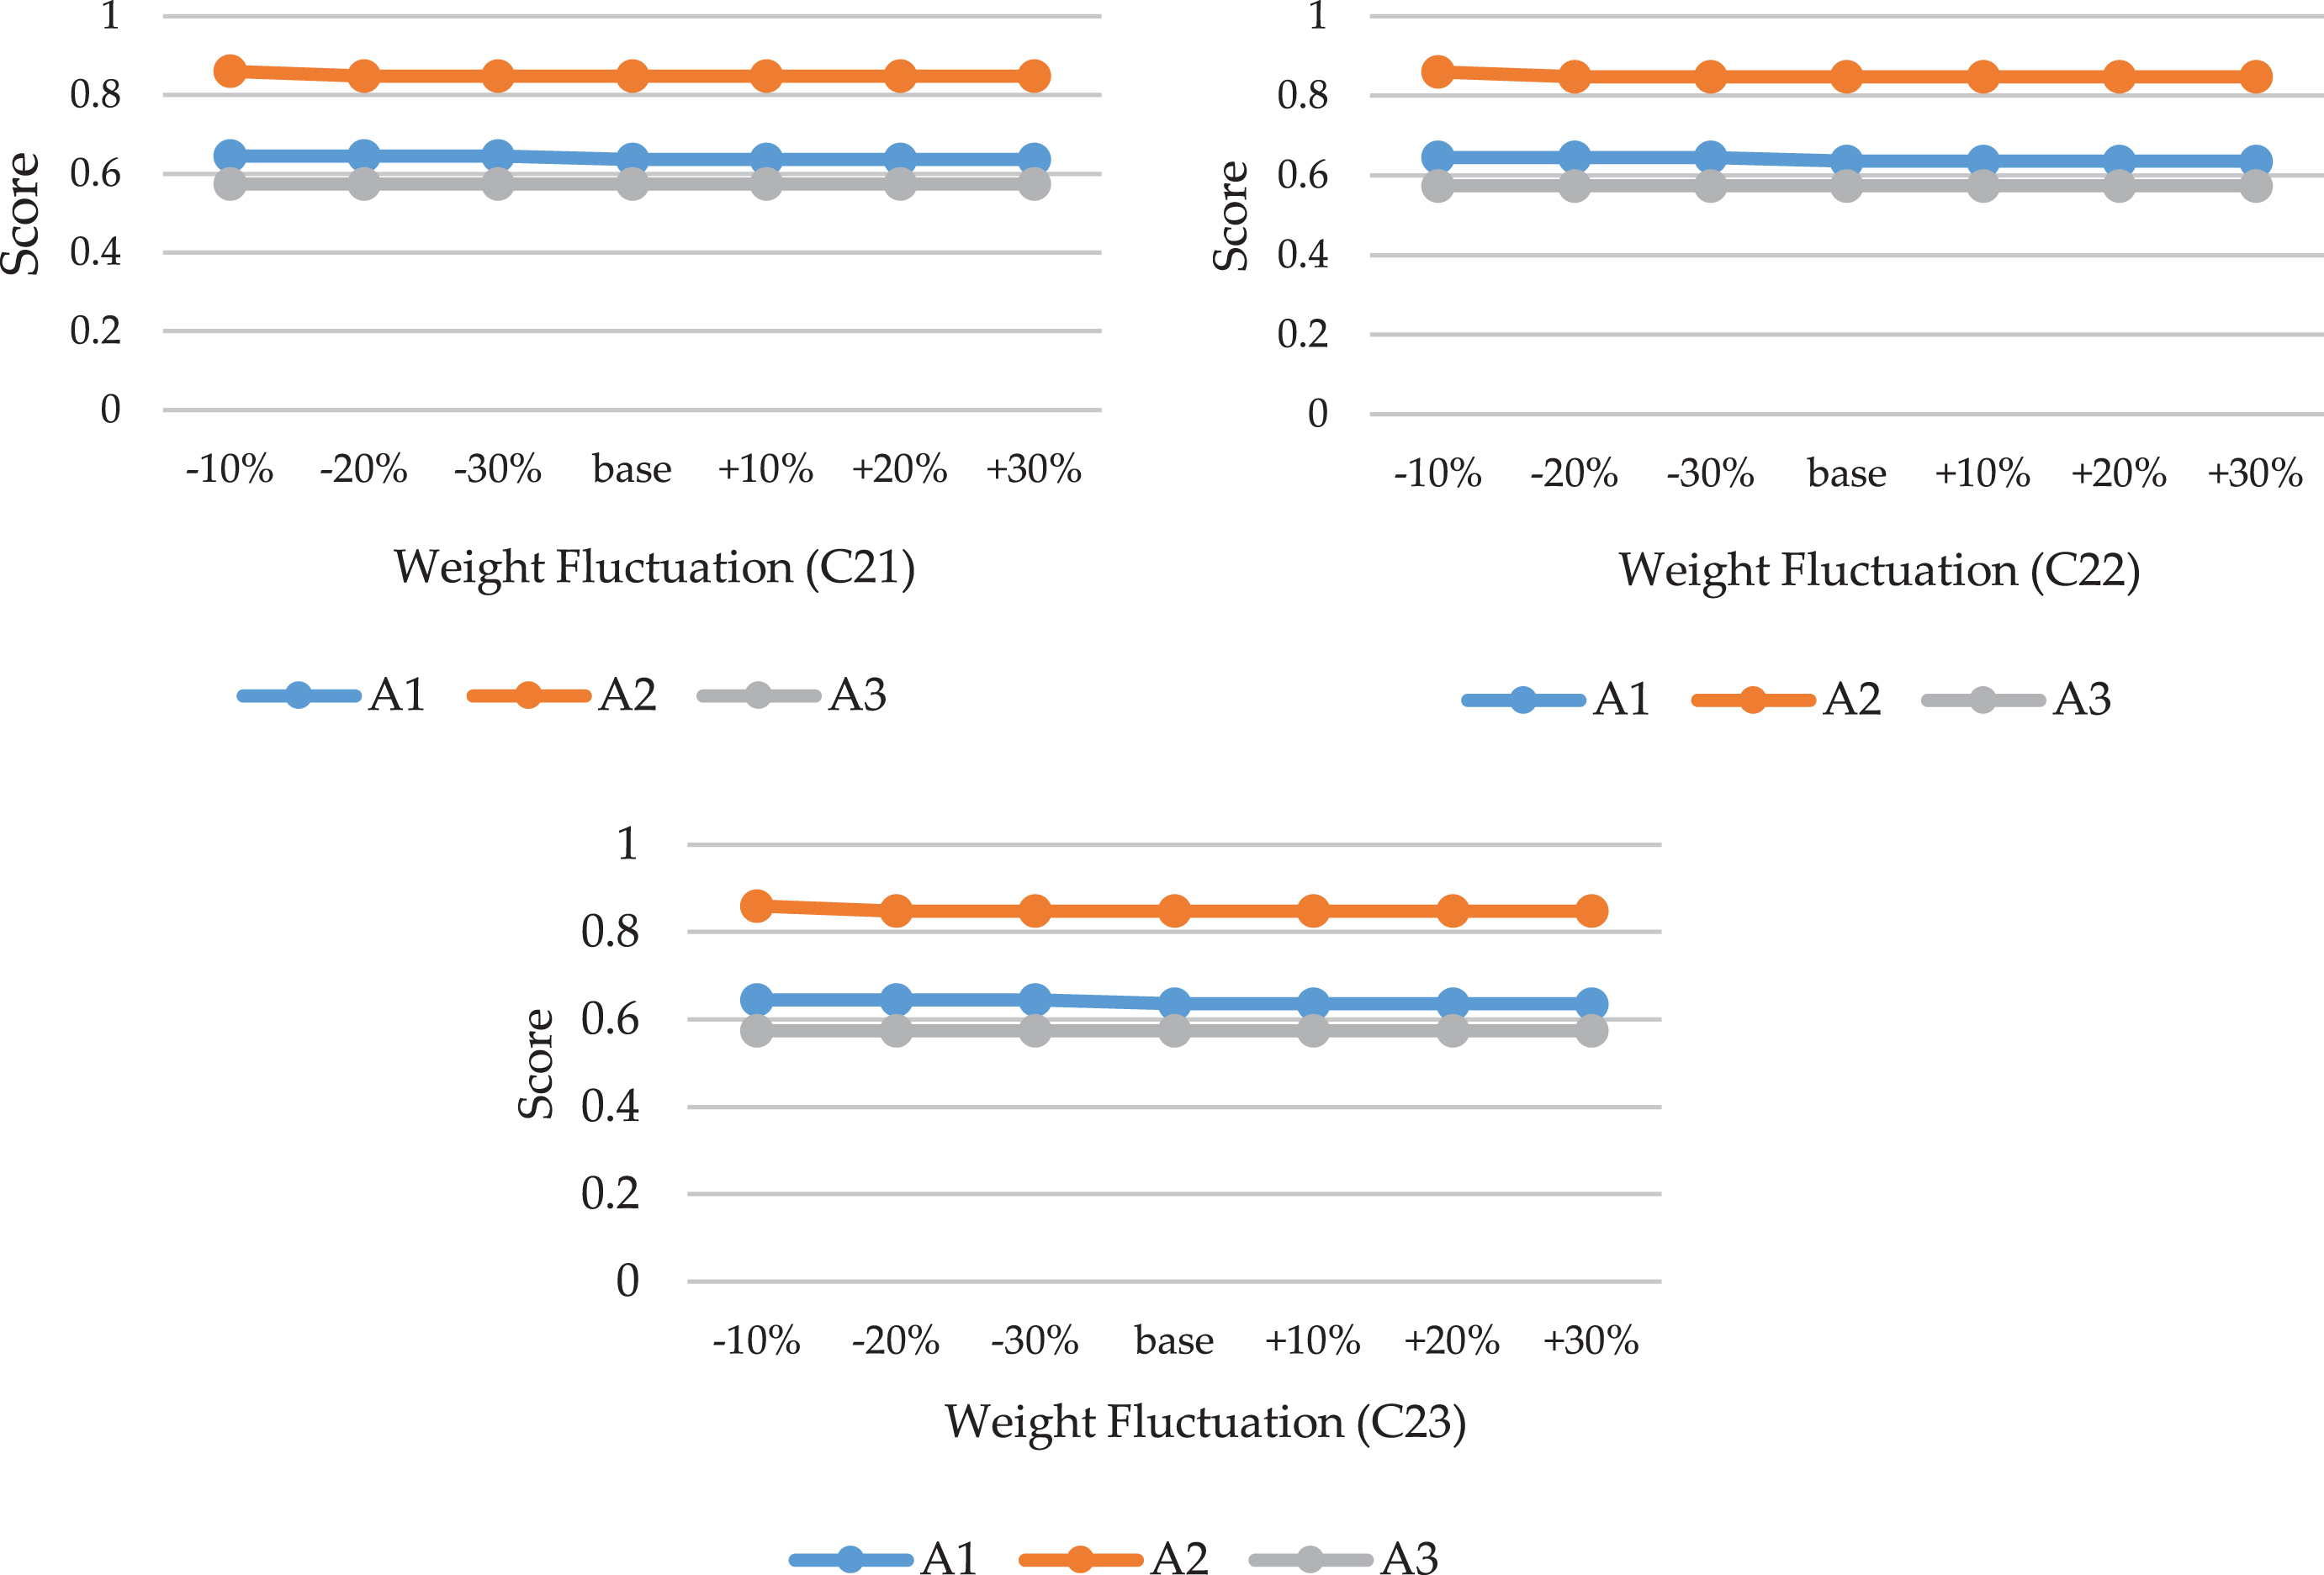
Figure 9 presents the results for which the sub-criteria related to “Economy” become more important or less important. For the situation where (C21) and (C23) become more important, the A1 and A2 output scores increase. The alternative score A3 approaches A2, when (C22) becomes more important.

Sensitivity analysis results of sub-criteria in economy group.
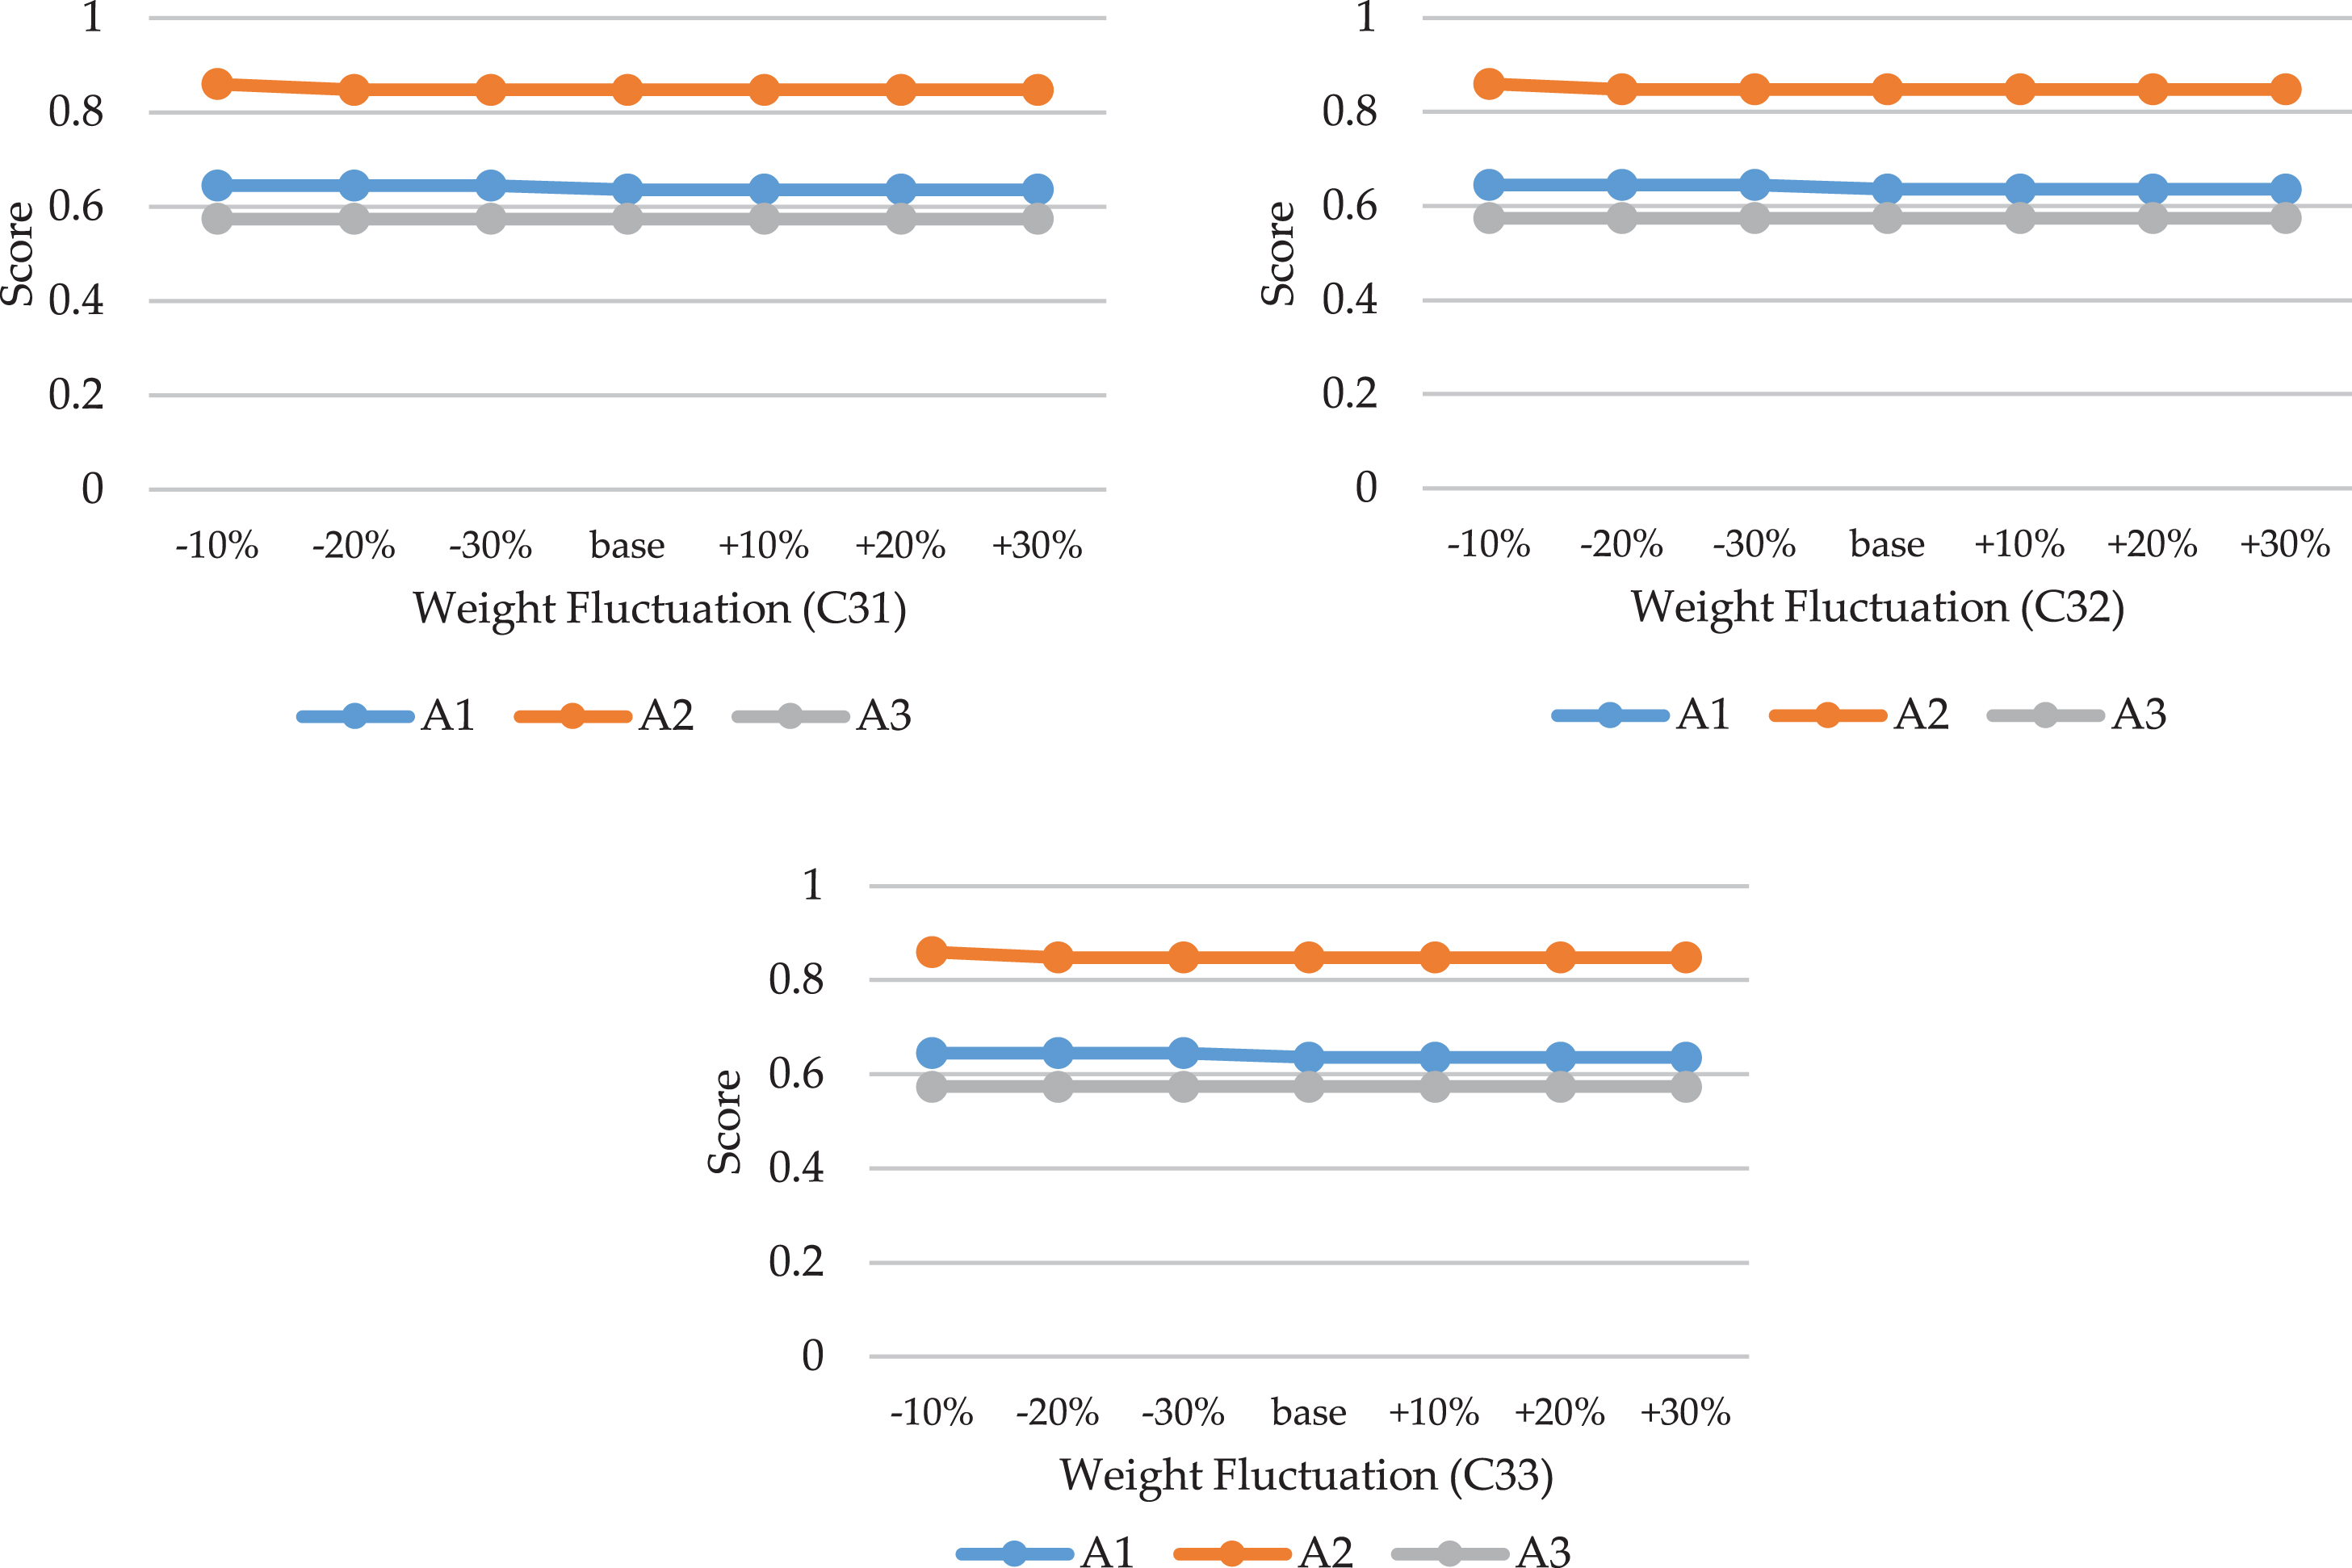
Figure 10 presents the results for which the sub-criteria related to “Technology” become more important or less important. If (C31), (C32) and (C33) become more important, the A1 and A2 output scores show a significant increase. If sub-criteria become less important, there are no significant differences.
Sensitivity analysis results of sub-criteria in social group.
Figure 11 presents the results for which the sub-criteria related to “Innovation” become more important or less important. For the situation when (C41) and (C43) become more important, A1 and A2 output scores show an increase. For the situation where (C42) becomes less important, there is a decrease in the score of the A3 alternative.
Sensitivity analysis results of sub-criteria in social group.
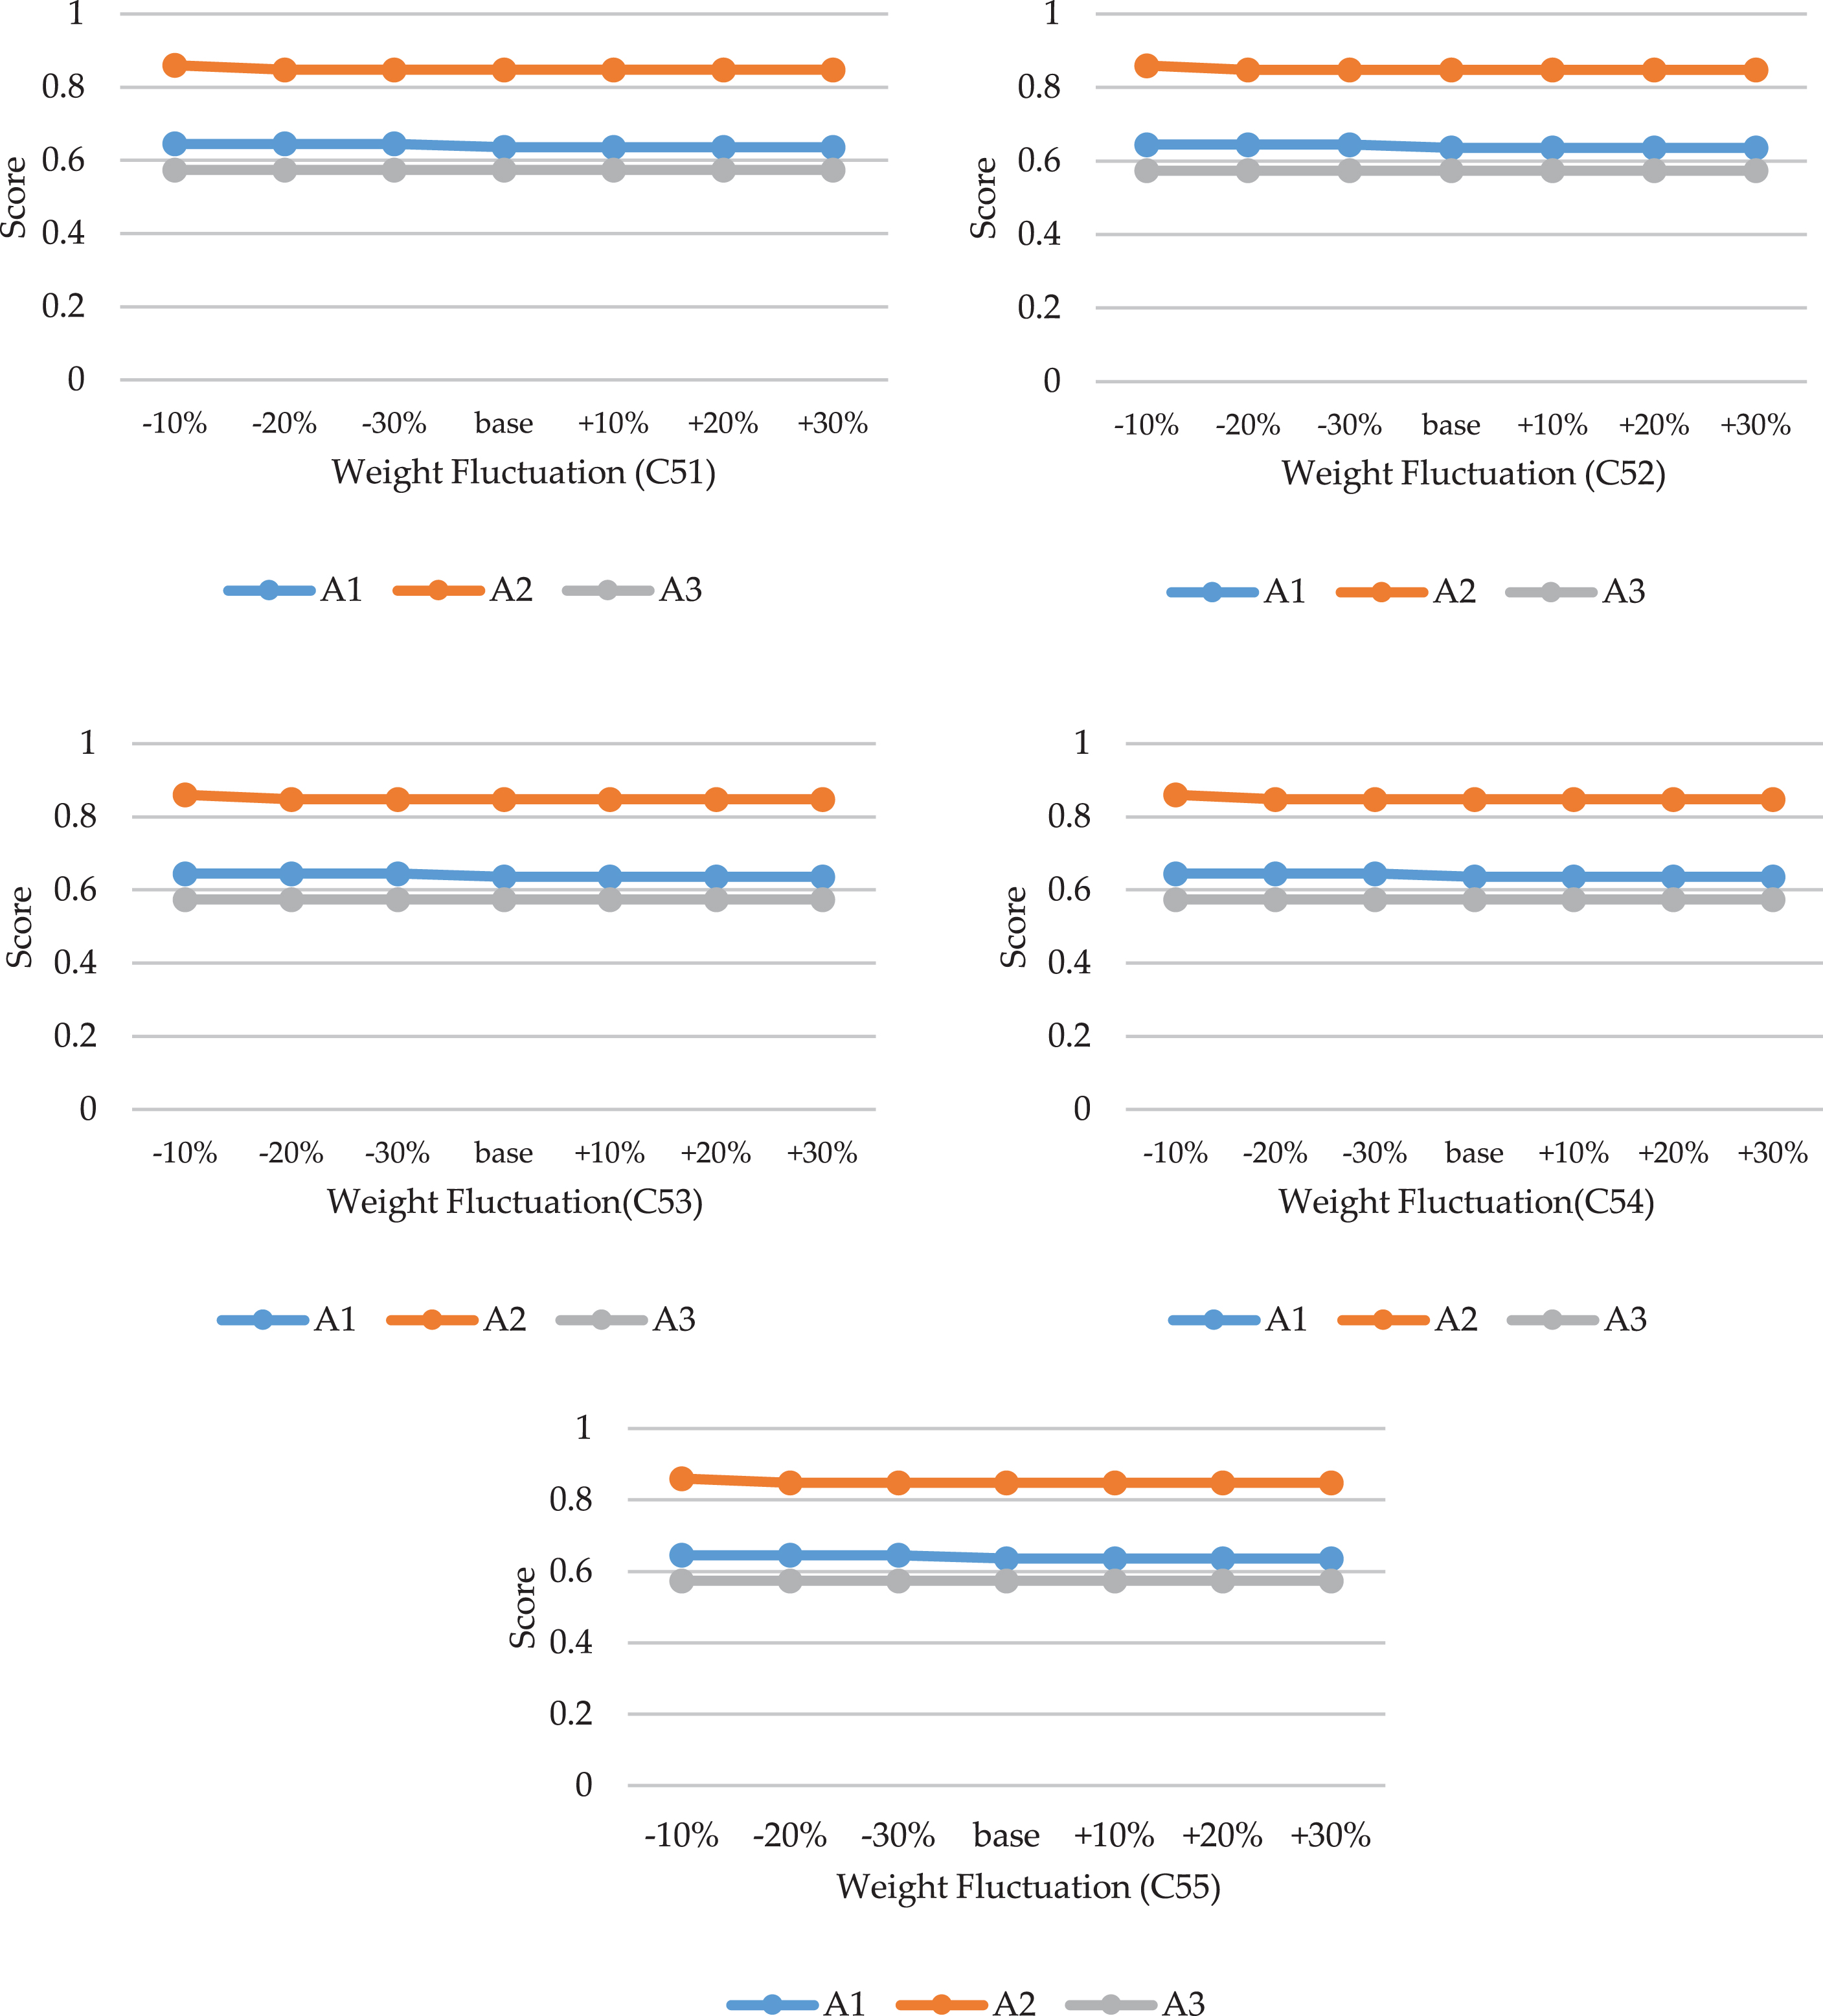
Figure 12 presents the results for which the sub-criteria related to “Innovation” become more important or less important. When (C51), (C52) and (C53) become less important, A1, A2 and A3 output scores show an increase. There are no significant differences in the situation when (C54) and (C55) fluctuate.
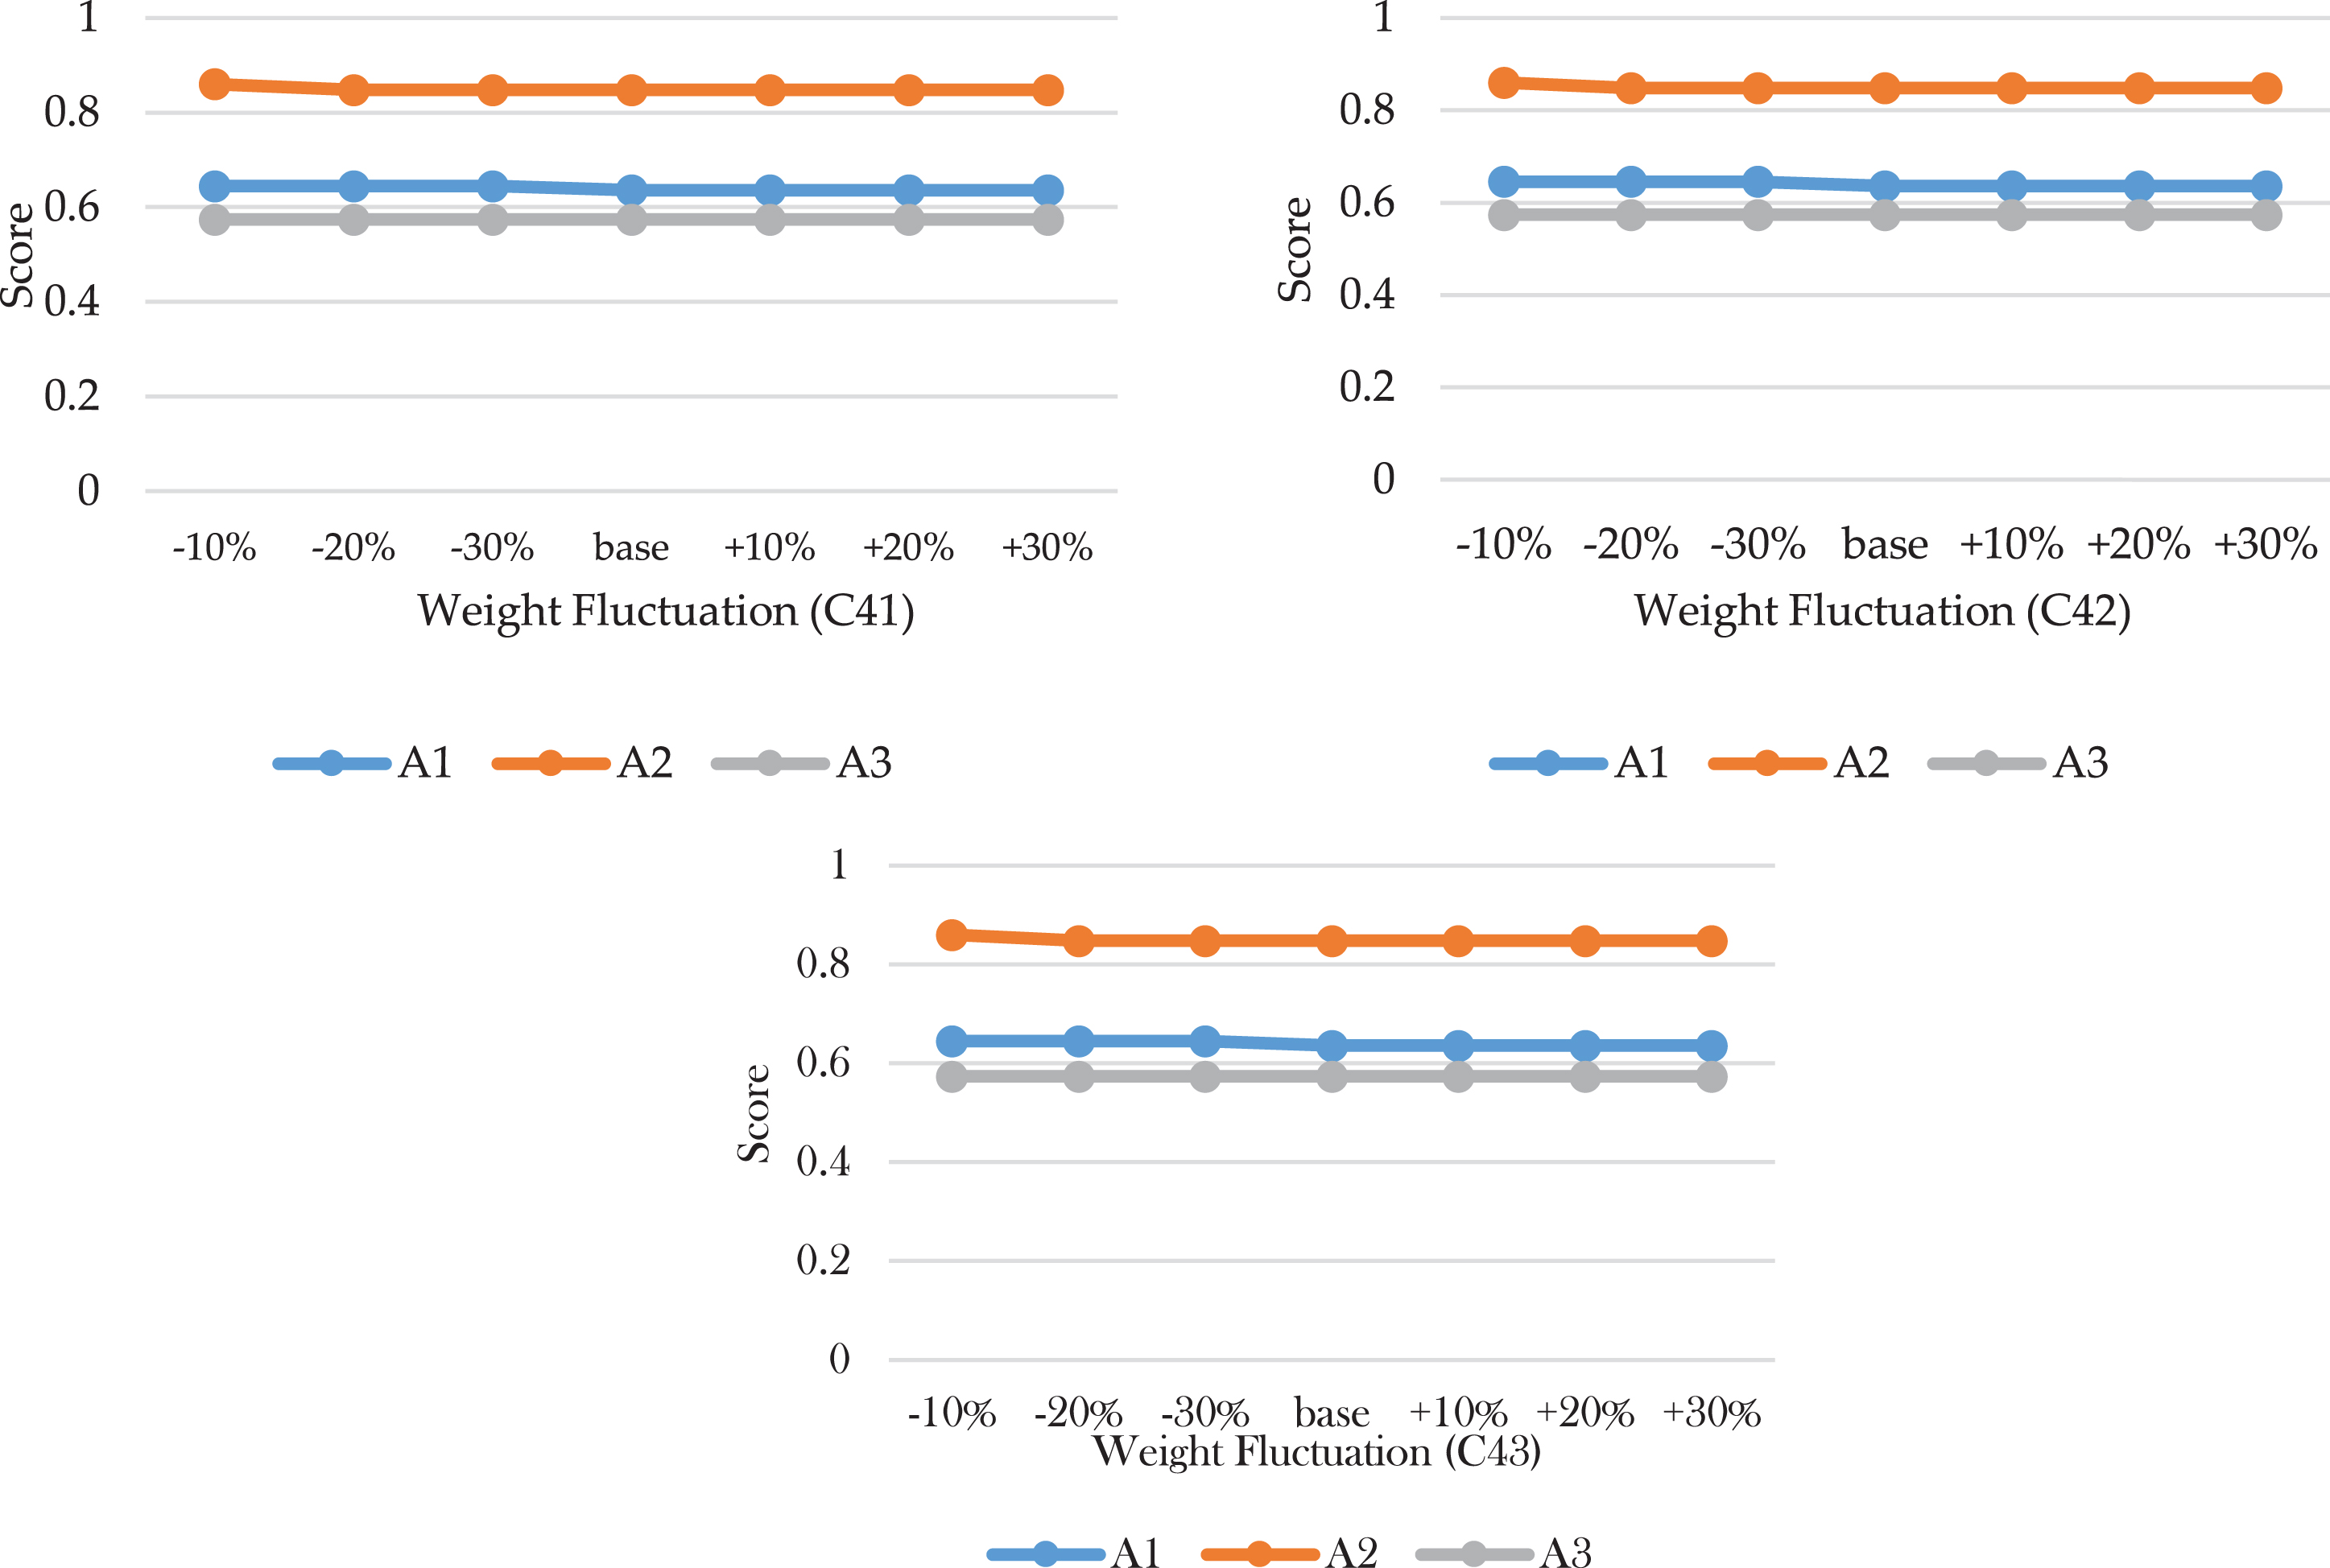
Sensitivity analysis results of sub-criteria in technology group.
Above all, the three alternatives retain their rank even though there are fluctuations in weights. This leads to the idea that the fuzzy AHP and TOPSIS methodology is robust and efficient.
This research points out that environmental (C1), economic (C2), technology (C3), innovation (C4) and social factors (C5) are central to sanitation companies. The judgment applied in the fuzzy MCDM methodology is adapted to the economic conditions characteristic of Romania and to the country’s capacity for development and adaptability. Based on the outputs of the fuzzy AHP and TOPSIS methodologies, the following actions are proposed for the winning alternative (A1): Promoting the economic implications of waste disposal; Promoting the reduction of waste generation in residential production; Increasing the awareness of the individual carbon footprint (i.e. how much each individual/each family/each region pollutes); Increasing the awareness of the waste route from the generator to the storage (from the household to the landfill); Implementing educational actions, ranging from the first levels of education to the university environment, related to the importance of selective collection and reduction of waste amount; Enhancing promotion across different environments and present the situation at national and EU levels; Consistent information on the achievement of the objectives set at the national level.
These proposals are relevant for the situation in Romania. Updating and improving current MSWM contributes to improving people’s quality of life and reducing environmental pollution. Since, at a national level, there is a need to develop a sustainable waste management system, it is necessary to choose indicators that best translate into a comprehensive and meaningful assessment of waste management systems. At the level of Romania, innovation and technological advance should be used to achieve the average level of EU activities [10].
The advantage of using this methodology is that the evaluation is very close to human thinking, while a disadvantage can be that the evaluation is dependent on the personality of the experts and the evaluators.
Further research directions will address the application of fuzzy AHP to the composition of municipal waste to determine factors contributing to the reduction of the generated waste amount, simultaneously focusing on applying sustainable methods based on the concept of reverse logistics.
The limitations of the research refer to the fact that some data sets used from the databases of the European Commission, of the European Environment Agency, of the Ministry of Environment and Climate Change, and the Romanian National Institute of Statistics (NIS) are incompletely defined, presenting an average degree of uncertainty.
Author contributions
All authors have contributed equally to the research presented in this paper and to the preparation of the final manuscript.
Conflicts of interest
The authors declare no conflict of interest.
Footnotes
Acknowledgments
This work was partially supported by research grant GNaC2018-ARUT, no. 1359/01.02.2019, financed by Politehnica University of Timisoara.