
Abstract
In order to overcome the problem of low fitting between traffic uncertainty prediction results and actual values in existing research methods, a traffic flow uncertainty prediction method based on K-nearest neighbor algorithm is proposed. The original database, classification center database, k-nearest neighbor database and intermediate search database are used to construct the database needed in the prediction process. Based on the database, multivariate linear regression is used to assign weights to state variables, and k-nearest neighbor algorithm and Kalman filter are used to update the weights to adapt to the uncertainties of traffic flow until the predicted values are obtained, and the uncertainties of traffic flow are predicted. The experimental results show that the maximum average absolute error and average relative error of the proposed method are 0.018 and 0.02, respectively. Compared with the traditional method, the proposed method has higher overall prediction accuracy, higher fitting degree, and is feasible.
Introduction
In the context of the continuous improvement of people’s living standards in China, the public’s travel experience requirements show a gradual upward trend. At present, the per capita vehicle ownership in China continues to increase, which leads to the deterioration of traffic congestion. It not only causes inconvenience for the public to travel, but also becomes a very important factor restricting economic development. In the first-tier cities of China, traffic congestion and other related problems are extremely serious. The cross-section passenger flow of urban traffic line is similar to that of road traffic flow. The flow situation of urban traffic line is uncertain at different stages. If more traffic flow is chosen, the traffic congestion will be more serious and the pressure of urban traffic will be increased. Predicting the uncertainty of urban traffic flow, obtaining the unstable information of traffic flow, and choosing the appropriate time to travel with less traffic flow are conducive to alleviating traffic pressure and avoiding rush-hour travel. Therefore, predicting the stability of traffic flow plays an important role in relieving traffic pressure and improving travel efficiency [1–3].
Traffic flow theory is comprehensive. This theory contains many disciplines such as traffic engineering and applied mathematics. The main purpose of this theory is to accurately describe the current situation of traffic flow through modern scientific knowledge, and to realize traffic simulation by constructing correct relevant models, so as to reveal the essence of traffic flow and realize the scientific management and control of traffic flow [4–6]. In recent years, with the rapid development of ITS, traffic control and traffic guidance have become a very hot topic in ITS. In traffic control guidance, real-time and accurate prediction of traffic flow has a direct impact on traffic control. With the continuous breakthroughs in the related methods and technologies of traffic flow prediction, researchers in this field have put forward many excellent results.
Reference [7] proposes an uncertainty prediction model for traffic flow based on multi-dimensional time series. In the process of research, a series of factors such as statutory holidays and weather are taken into account. At the same time, considering the particularity of regional tail number restriction, the factors of “weeks” are taken into account, and the traffic flow data of expressway are used to complete the prediction, but this method is not satisfactory. The prediction accuracy needs to be further improved. In reference [8], it is pointed out that the analysis and processing of traffic flow uncertainty is a very important part of intelligent transportation system, especially the prediction of traffic flow uncertainty. According to the current research results and considering the time-varying and complexity of traffic flow, a traffic flow prediction model based on fuzzy linear regression is proposed to realize the design of traffic guidance and control scheme. The empirical research is carried out by collecting traffic flow data on the spot. However, the overall implementation process of this method is complex and its application scope has high limitations. In order to improve the accuracy of traffic flow uncertainty prediction, a noise reduction prediction method based on RVM and ARIMA is proposed in reference [9]. In the process, the noise reduction process of traffic data is designed and constructed, and the error evaluation index of noise reduction method is screened out. According to the traffic flow prediction method and process of RVM and ARIMA, the average absolute relative error is used as the evaluation index of the prediction method effect. The validity of the method is tested by using traffic flow data of a city as experimental data, but the fitting degree of the method is low. Reference [10] presents a real-time traffic flow instability prediction model. VDS sensor is used to collect traffic flow data, three-dimensional Markov random field is used to dynamically model the collected traffic flow data, and then group parameters are used to characterize the spatial-temporal relationship between traffic flow and road sections, and support vector regression is used to determine the relevant parameters of the model to complete the traffic. Flow instability prediction, but this method has the problem of high prediction cost. Reference [11] to reduce the incidence of traffic accidents and traffic congestion, traffic flow instability is predicted by traffic surveillance video. The prediction model of traffic flow instability is established by using periodic video image processing technology. In the range of traffic roads, the two-dimensional motion of traffic vehicles is measured to complete the prediction of traffic flow instability, but the prediction accuracy of this method is low.
In order to solve the problems of the prediction methods mentioned above, an uncertainty prediction method for traffic flow based on k-nearest neighbor algorithm is proposed to realize the accurate prediction of traffic flow instability. The overall implementation scheme of the proposed method is as follows:
(1) Constructing traffic flow database, the red-black tree in the balanced binary tree is used to store traffic flow data, laying the foundation for accurate uncertainty prediction of traffic flow;
(2) According to the established traffic flow database, multivariate linear regression is used to assign weights to the given state variables.
(3) k-nearest neighbor algorithm and Kalman filter are used to update the weights according to the measured data of the relevant sections, so as to realize the accurate uncertainty prediction of traffic flow.
(4) Analysis of experimental results.
Through the above scheme, the accurate uncertainty prediction of traffic flow is completed.
Uncertainty prediction method for traffic flow based on K-nearest neighbor algorithm
Construction of traffic flow database
In the process of using k-nearest neighbor algorithm to predict traffic flow, it is a prerequisite to construct relevant databases.
In the uncertainty prediction method for traffic flow based on K-nearest neighbor algorithm, the components of the database are original database, classification center database, k-nearest neighbor database and intermediate search database. In addition to the intermediate search database, other databases can query and update data according to the sequence number primary key. However, data preservation in intermediate search libraries that are directly matched with current vectors needs to be carried out according to certain strategies. Assuming that storage is based on sequential tables, the query efficiency will be greatly reduced.
After comprehensive consideration, the intermediate search library uses the balanced binary tree structure to realize data storage. Based on the balance degree, the binary tree can be divided into many kinds. Considering the complexity and other issues, the red-black tree can be used to meet the requirement of the height balance of left and right sub-trees in each sub-tree of the binary tree [12].
The structure of data points in the intermediate search database in the red-black tree mentioned above consists of specific data fields, namely hash address, data sequence number of classification center, color field and pointer field. Figure 1 shows the database structure.
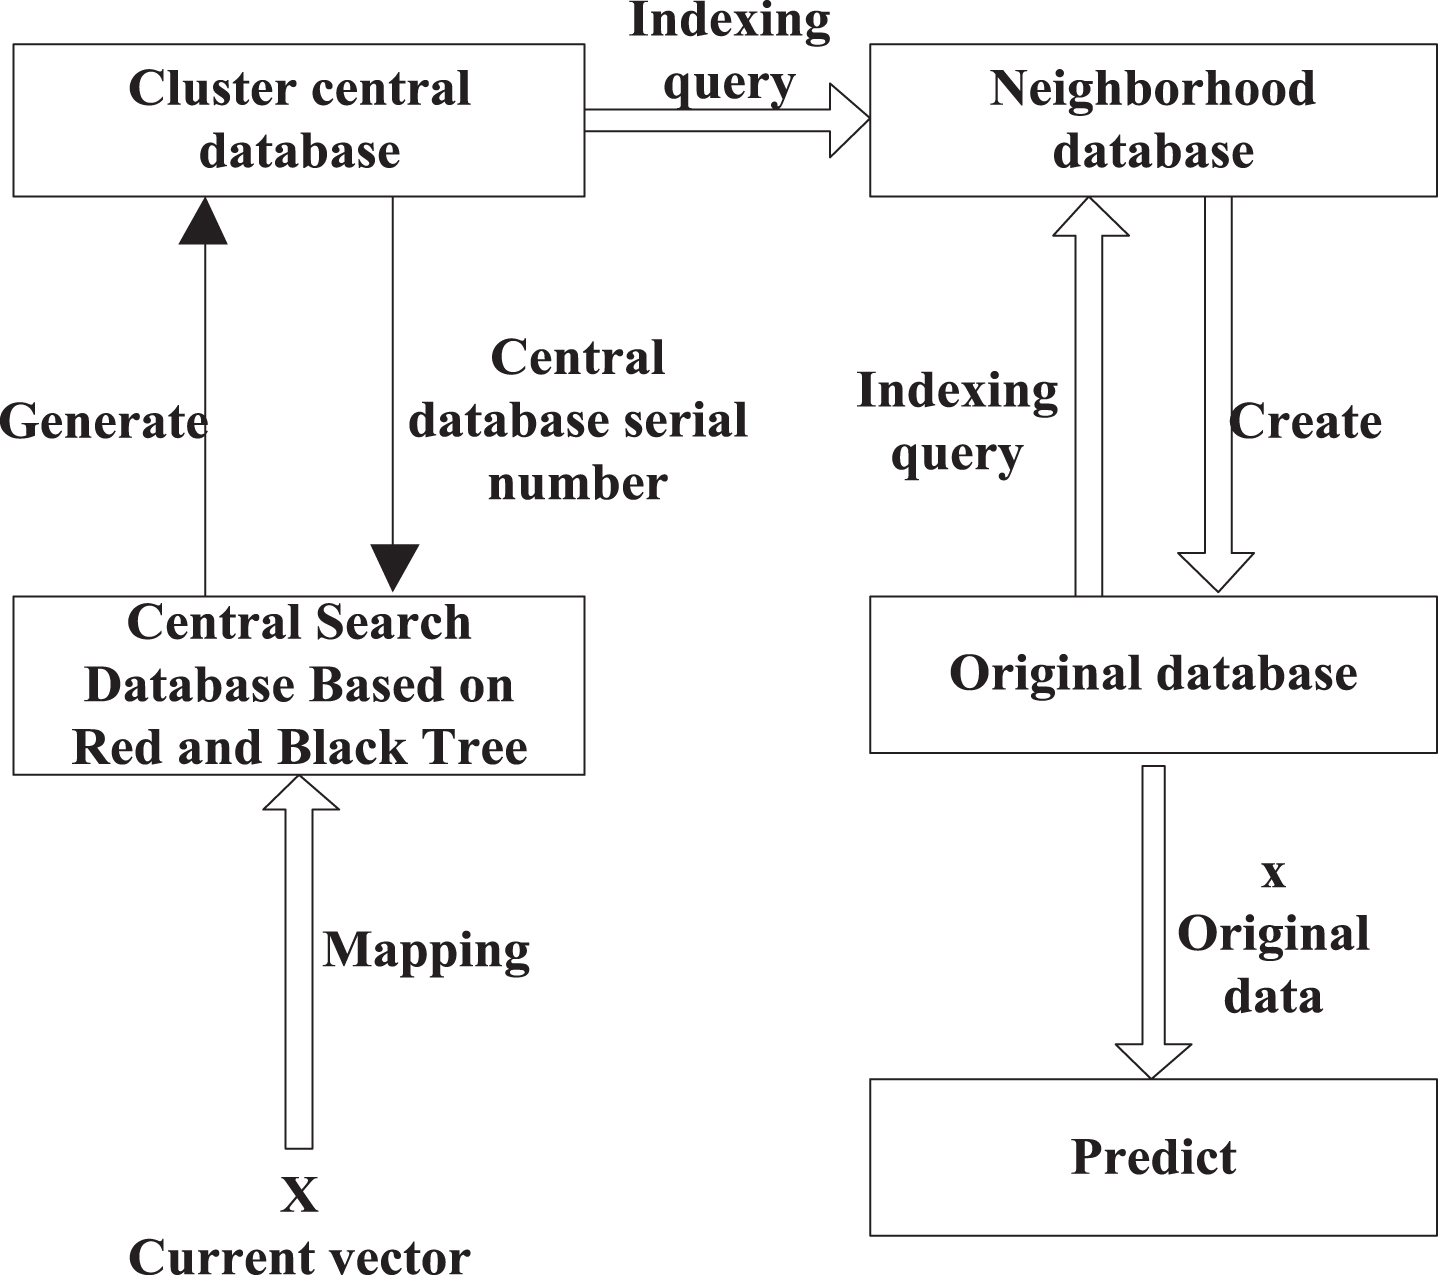
Database structure.
In the above, the relationship between the current vector and each database is as follows: the classification center database uses hash function to get the intermediate search database. In the same way, the current vector X retrieves the most recent data in the intermediate search library and gets the most recent data index number. According to the index number, k index numbers of nearest neighbor can be obtained, and then the required data is acquired and applied to the prediction in the original database [13–15].
The intermediate database is mainly based on the red-black tree, so the construction and updating of the database are all related to the design of the red-black tree.
Nature of red-black tree: The tree structure is a binary search tree, which only adds a gamut, that is, red and black. A binary tree is a red-black tree if it satisfies the following properties:
(1) Each node may be red or black;
(2) The root node is black.
(3) All leaf nodes are black.
(4) Assuming that one node is red, the two sub-nodes are black.
(5) For each node, all paths from the node to its sub-node contain the same number of black nodes.
Rotation operation of red-black tree
Rotation operation: The operations in the database involve insertion and deletion of red- black tree. Rotation is the basic operation to maintain balance, which is divided into left and right rotation, as shown in Fig. 2.

Left and Right Rotation of Red-Black Tree.
Insertion operation: In the process of insertion operation, according to the condition of the parent node of the inserted node, it can be divided into several conditions as shown in Table 1.
Insertion operation of red-black tree
Insertion operation of red-black tree
Insertion strategy when parent node is red
The following is an analysis of the strategies for dealing with the various situations mentioned above.
Strategy 1: Both the current and parent nodes are red, which violates the feature (4). Therefore, the parent node is set to black to solve the problem, as shown in Fig. 3.

Insertion operation schematic diagram of Strategy 1.
Strategy 2: Taking the parent node as the new current node, and the new current node is used as the fulcrum to achieve left-handed. The schematic diagram is shown in Fig. 4.

Insertion operation schematic diagram of Strategy 2.
Strategy 3: Insertion operation schematic diagram of Strategy 3 is shown in Fig. 5.
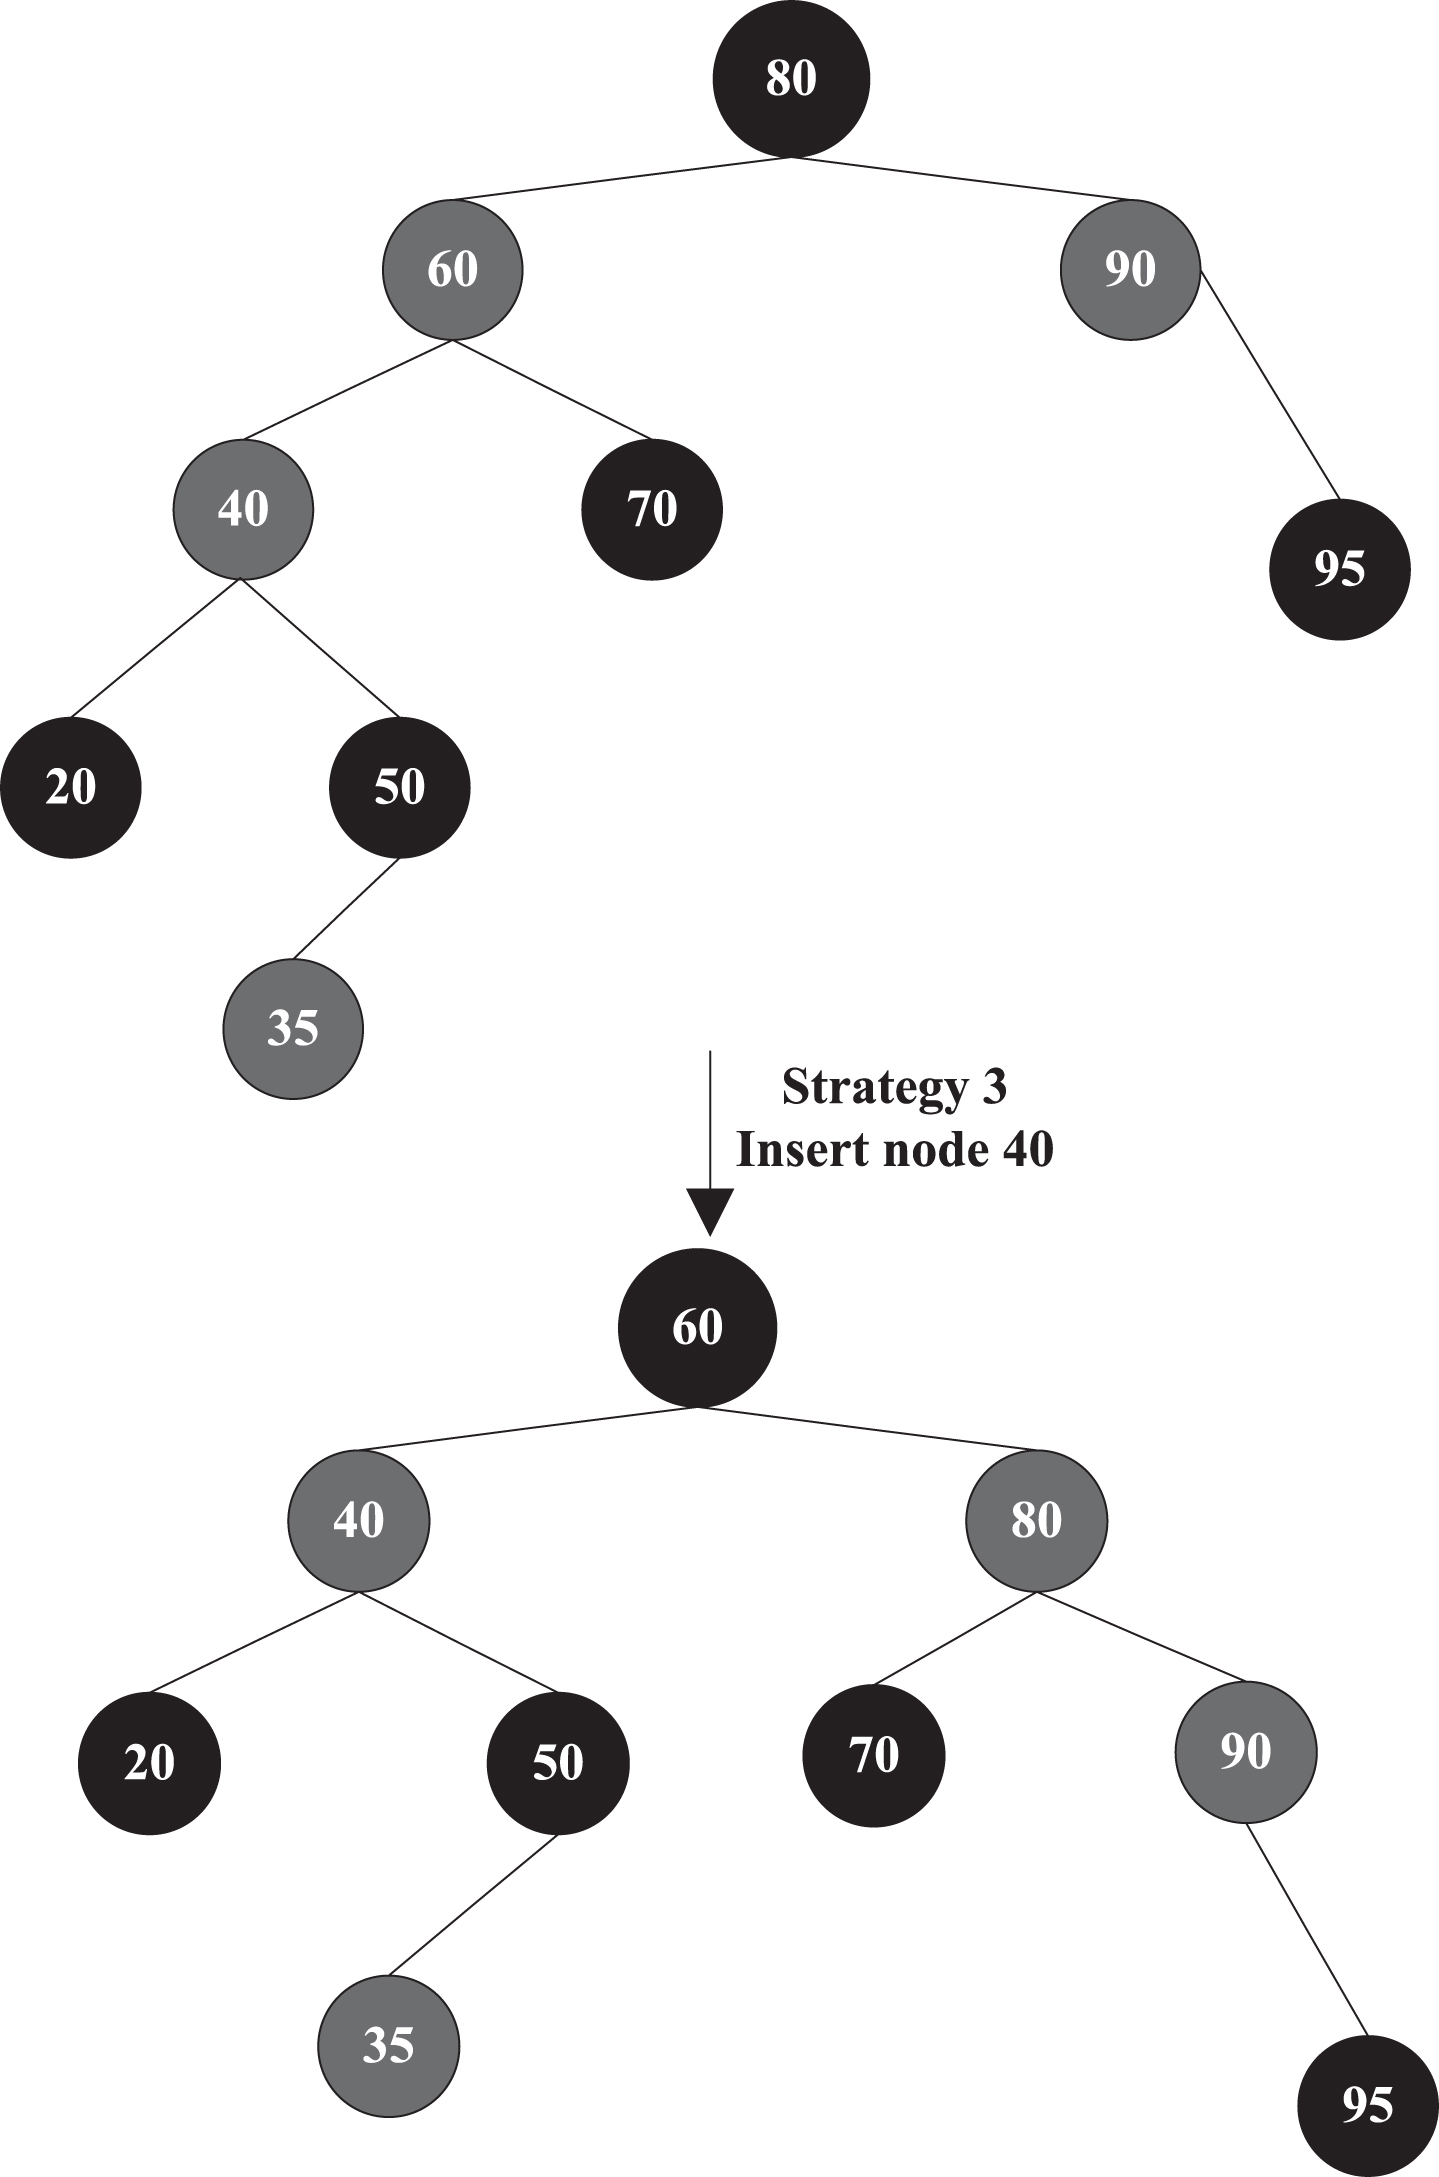
Insertion operation schematic diagram of Strategy 3.
The detailed process of deleting a node on the red-black tree is as follows: the red-black tree is treated as a binary search tree, then the node to be deleted is deleted in the tree, and then the tree is modified by rotation and re-colouring, which is transformed into a red-black tree [16–18].
Table 3 shows the deletion operation scheme of nodes in the red-black tree.
Deletion operation scheme of nodes in the red-black tree
Deletion operation scheme of nodes in the red-black tree
Operational scheme for deleting nodes when they are double black
The following is an analysis of the strategies for dealing with the various situations mentioned above.
The deletion operation scheme of Strategy 1 is shown in Fig. 6 (a), the deletion operation scheme of Strategy 2 is shown in Fig. 6 (b), the deletion operation scheme of Strategy 3 is shown in Fig. 6 (c), and the deletion operation scheme of Strategy 4 is shown in Fig. 6 (d).
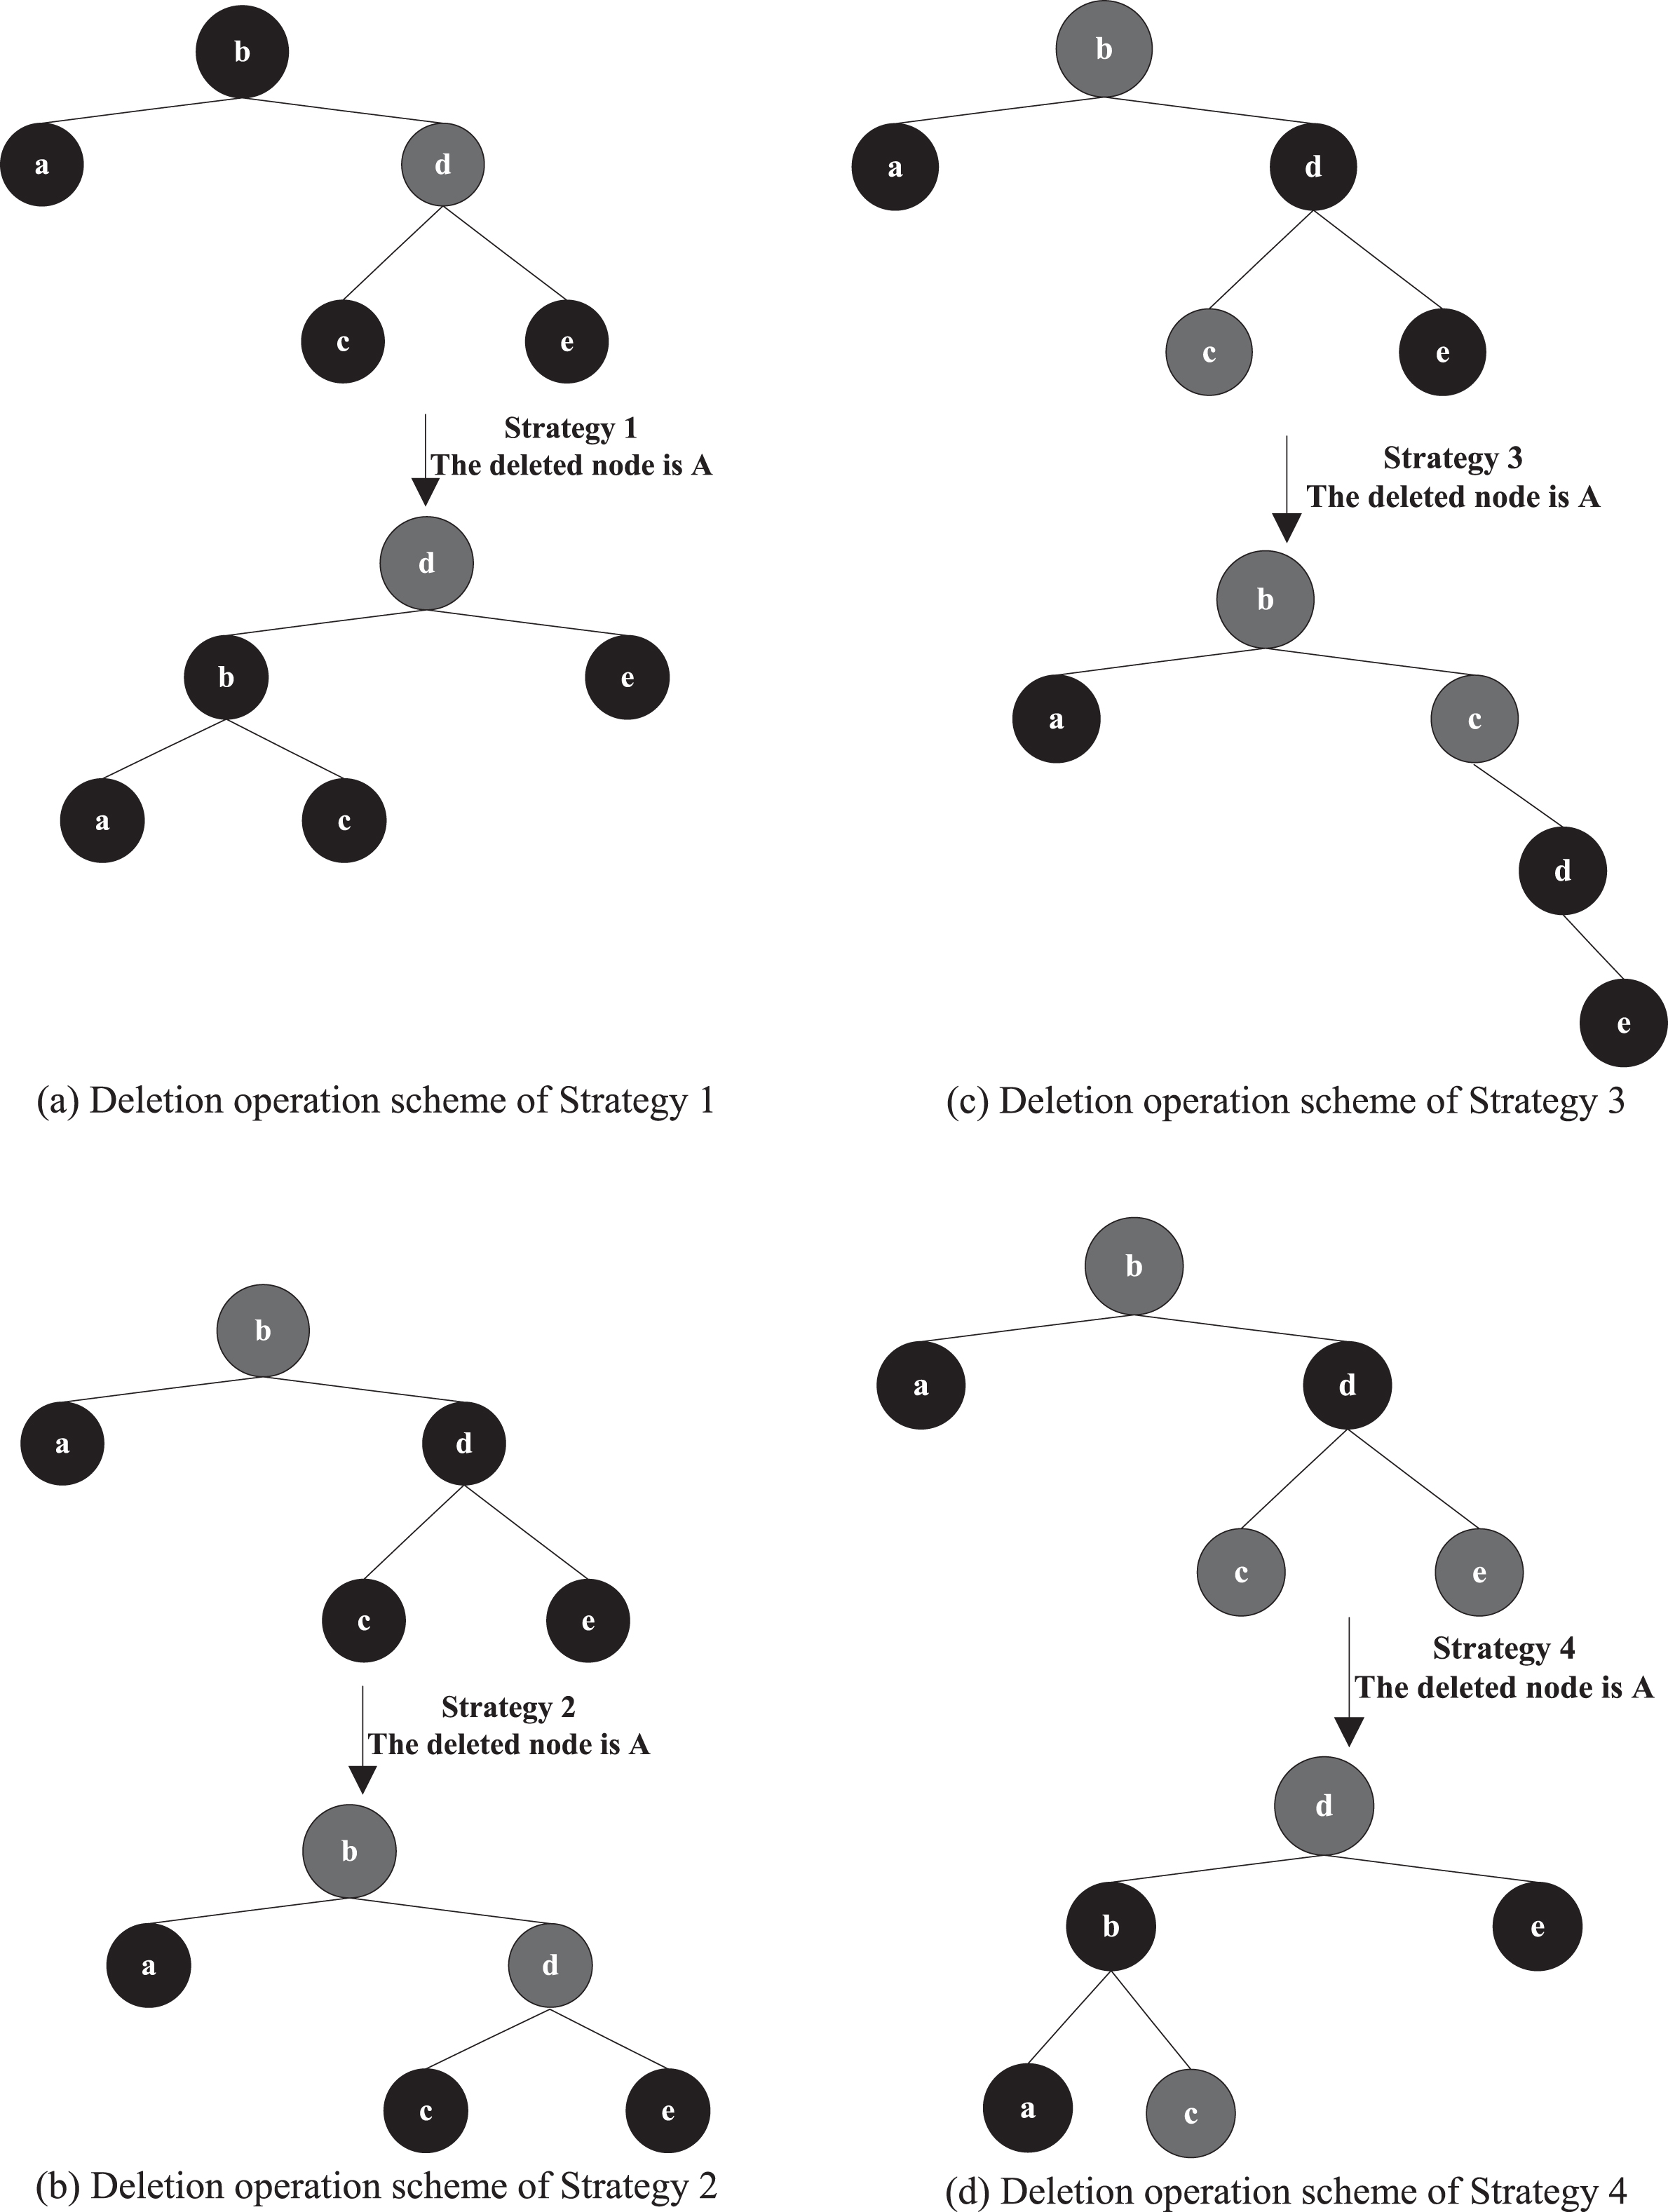
Schematic diagram of different deletion operations.
Combined with the above treatment, the characteristics of red-black tree can be fully satisfied, as shown in Fig. 6 (d). So that the intermediate database is constructed and used in traffic flow prediction.
K-nearest neighbor algorithm
K-nearest neighbor (k-nearest neighbor) algorithm is a kind of machine learning algorithm, which is often used in the research of classification methods. The principle of k-nearest neighbor algorithm is very simple. It is a method to determine the class of samples by measuring the distance between the features of samples and the eigenvalues. The schematic diagram of k-nearest neighbor algorithm is shown in Fig. 7.
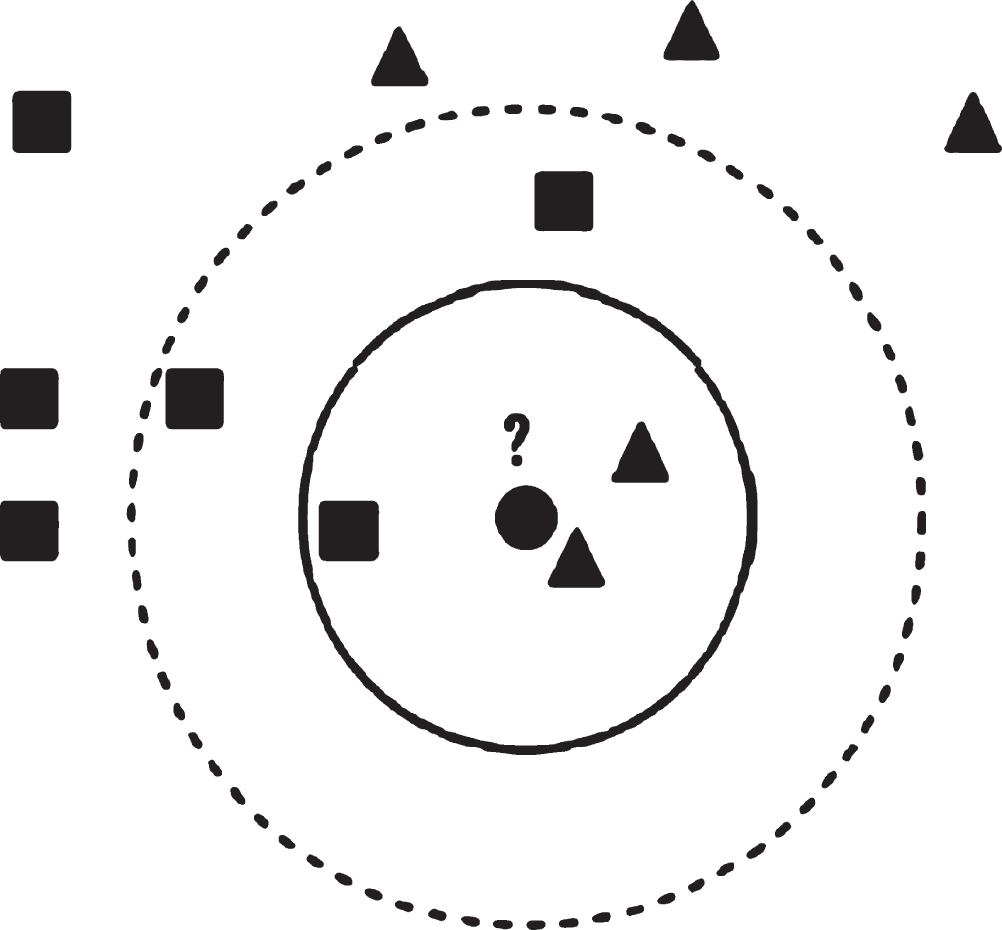
Schematic diagram of k-nearest neighbor algorithm.
There is a sample data set, which is used as training data set. Each data in the data set has a separate attribute tag, that is, there is a mapping set in the data set. When a new data is added to the training data set, the k-nearest neighbor algorithm compares the data with each data feature in the training sample data set, and selects the first K feature labels similar to the data. Finally, the data with the highest frequency of K data label is classified accordingly, and this category is regarded as the category of new data. The value of K is determined by the size of training data set.
In view of the uncertainty of urban road traffic flow, the k-nearest neighbor algorithm and Kalman filter are combined to realize the uncertainty prediction of traffic flow.
For convenience of description, the road in Fig. 8 is used to construct the prediction model.
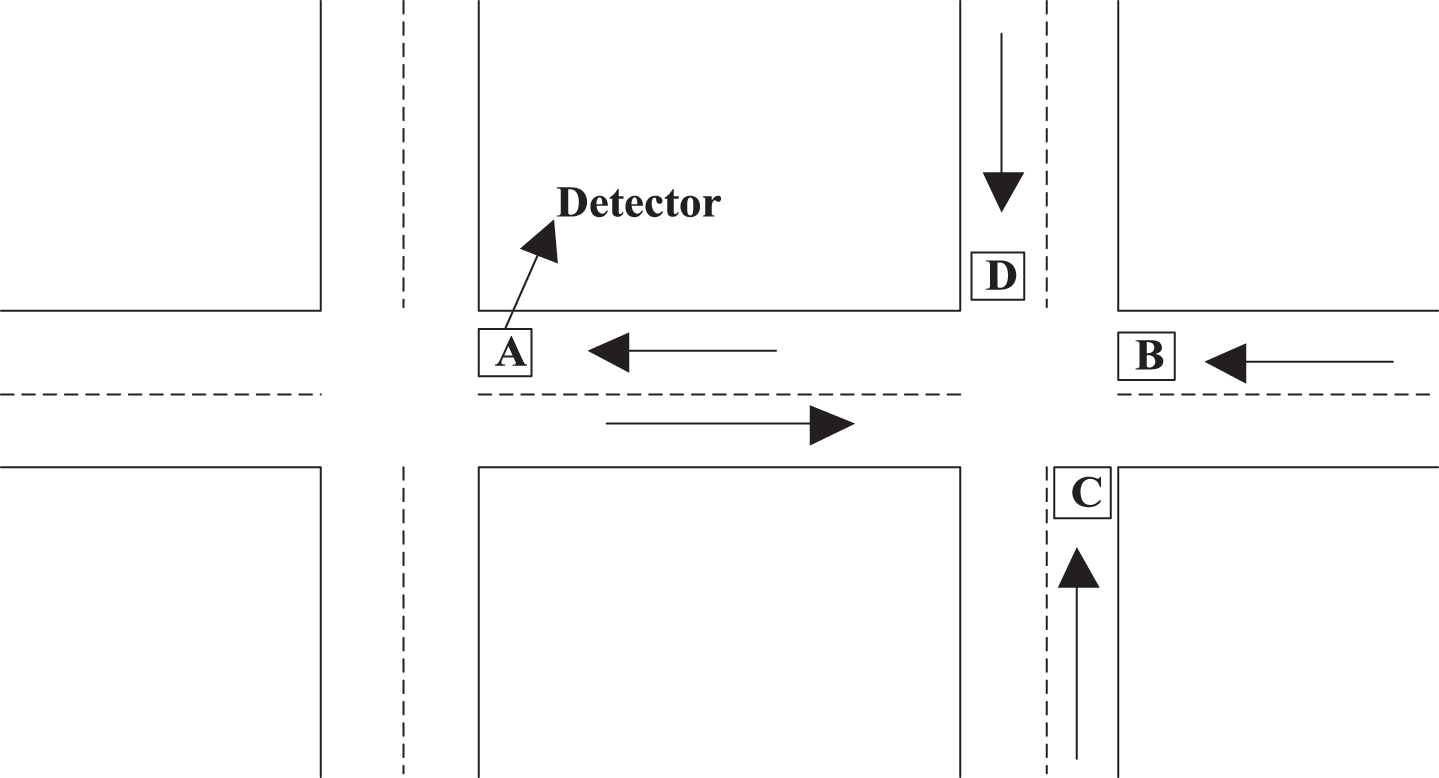
Diagram of road area.
Assuming that A represents the predicted section, there are currently road section data of A, B, C and D. The current period of section A and the data of the first two statistical periods are used to form the state vector, and then the set of input variables is formed. Based on the above, the prediction flowchart is shown in Fig. 9 the detailed prediction process is as follows:
(1) Put all the data into the traffic flow database constructed in 2.1.
(2) Let qA (t), qA (t - 1), qA (t - 2), qB (t - 1), qB (t - 2), qC (t - 1), qC (t - 2), qD (t - 1), and qD (t - 2) be as the components of the state vector, which are the flow data in the current period of section A and the first two statistical cycles respectively.
(3) Let the instantaneous traffic flow of section A be as dependent variable, the instantaneous cycle of section A and the flow data of the first two statistical cycles be as independent variables, then a multivariate regression model is constructed, and the regression parameters are fitted as initial values.
Kalman filtering theory is introduced to deform formula (1), to obtain state vectors that take a1, a2, a3, b1, b2, c1, c2, d1 and d2 as components, and the observation matrix that takes qA (t*), qA (t* - 1), qA (t* - 2), qB (t* - 1), qB (t* - 2), qC (t* - 1), qC (t* - 2), qD (t* - 1) and qD (t* - 2) as elements. According to the recursive evaluation principle of Kalman filter, the initial value of this period is corrected by the measured value of this period, and the best state evaluation result of this period is obtained. Then, according to the measured value of this period of the target section, the former regression coefficient is corrected.
(4) To measure the similarity between the set of input variables and the state vectors in the database by Euclidean distance, there are:
Where di represents the distance between the current input data set and the data of group i in the database. ωj represents the j-th weight value of the input vector at the present stage. This value is related to the regression coefficient of the item in formula (1). The larger the coefficient is, the greater the impact of a component on the overall prediction results of the target section will be, and the smaller the weight will be [19–21]. Xj represents the j-th subitem value in all the input data at present, and Xji represents the j-th subitem value in the data of group i in the database. The expression of ωj is as follows:
(5) The results of the above steps are arranged according to the order from large to small, and the k-group data with the smallest distance is selected. In this paper, k is defined as 5, that is to say, the five groups of data with the highest overall similarity of registration success are selected for prediction.
(6) The traffic flow to be predicted in the next period of the nearest time at t** of each group is found out. According to the reciprocal weighting method of matching distance, the k-th traffic flow value is weighted and summed to obtain the final prediction result:
Where, qAi (t* + 1) represents the flow value of the predicted section in the next period of time at t**. According to formula (4), the smaller the distance is, the higher the similarity is and the greater the weight is.
(7) The current state vector coefficients are updated. After measuring the target traffic flow in the prediction period, the regression coefficients of formula (1) are updated by Kalman filtering principle, and the updated regression coefficients are reflected in the next prediction period of the k-nearest neighbor target. That is to say, through formula (3), the matching weights of each subitem in the new input vector are updated until the predicted values are obtained.
In order to verify the reliability of traffic flow uncertainty prediction method based on K-nearest neighbor algorithm, a correlation experiment was carried out. Simuls is chosen as the traffic simulation software in the experiment. The simulation section is shown in Fig. 10. In order to make the experiment more stable, the traffic flow data of the simulated section are collected at a sampling interval of 5 minutes. In order to obtain real-time traffic flow data, the detector is placed in the section, and the data obtained is the overall traffic flow of the section. The test lasted for 30 days. A total of 8640 sets of data were obtained. The first 8350 sets of data were selected as experimental samples.
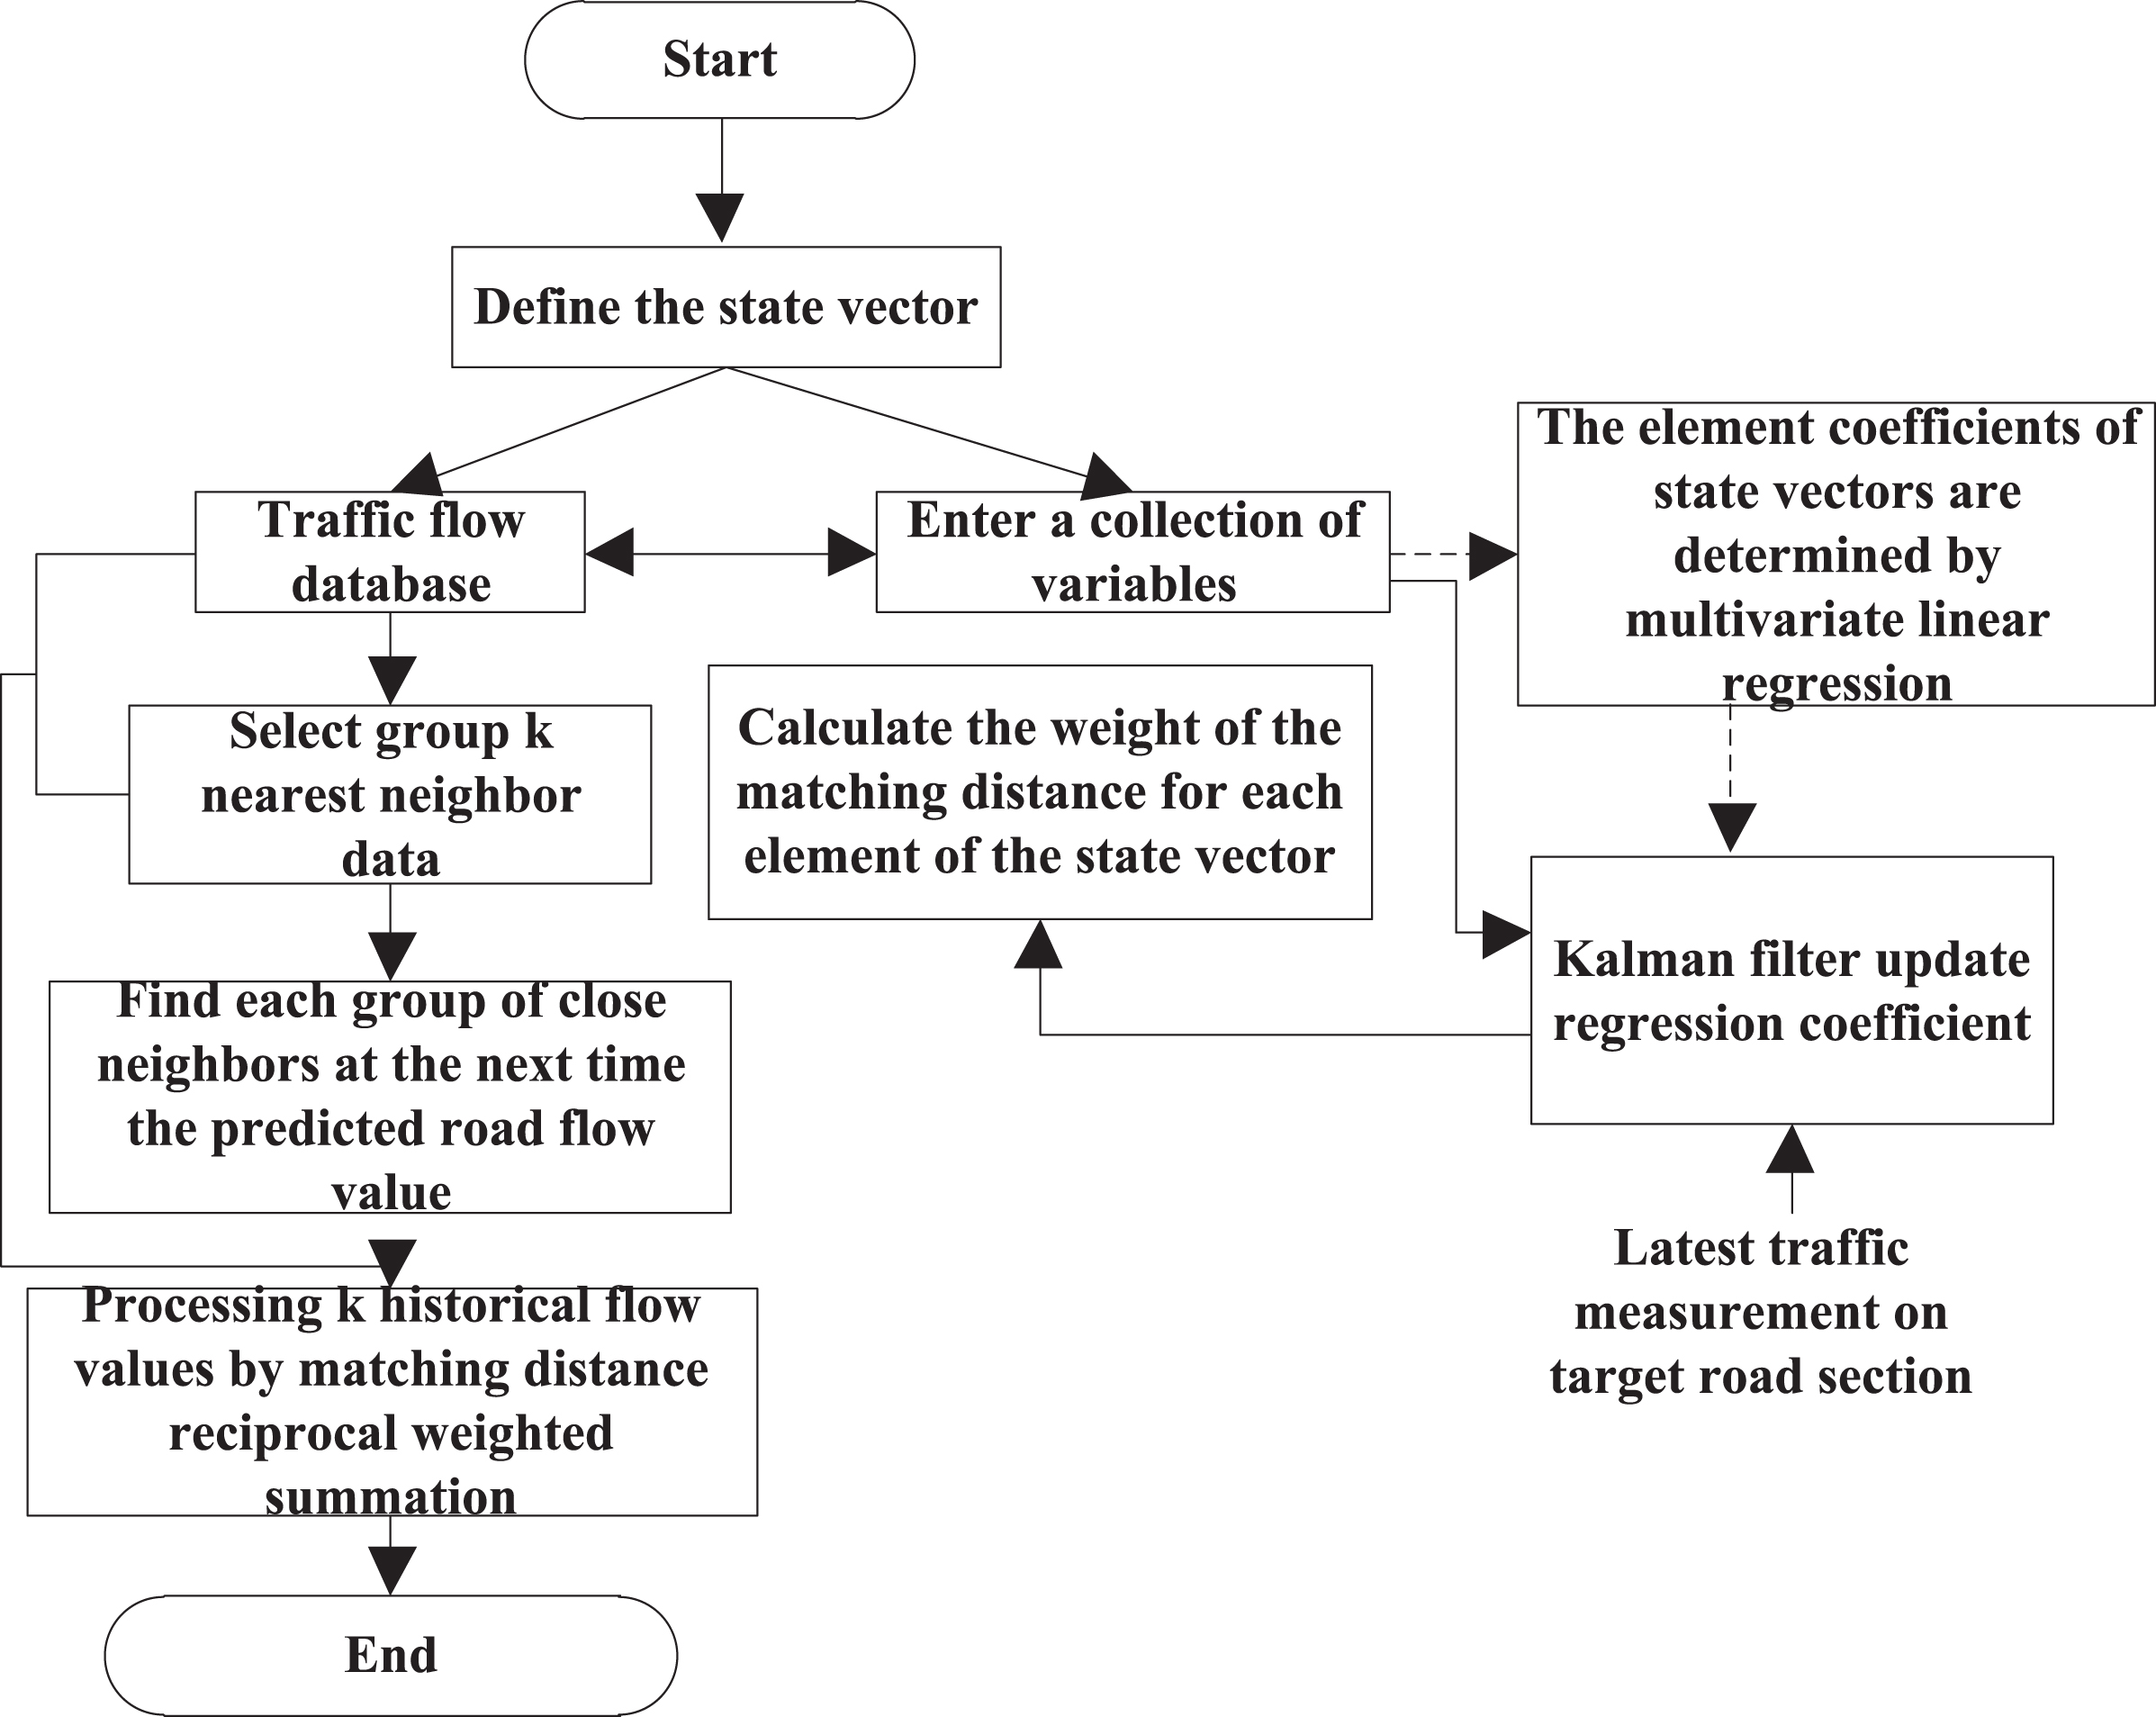
Prediction flow chart.

Simulated road.
The mean absolute error (MAE), mean square error (MSE) and mean relative error (MAPE) are used as the experimental comparison indexes. The comparison experiments among the methods in reference [7], reference [8], reference [9] and the method in this paper are carried out to verify the fitness of the predicted results and the actual values of the proposed method.
The MAE comparison results of the four methods are shown in Fig. 11.
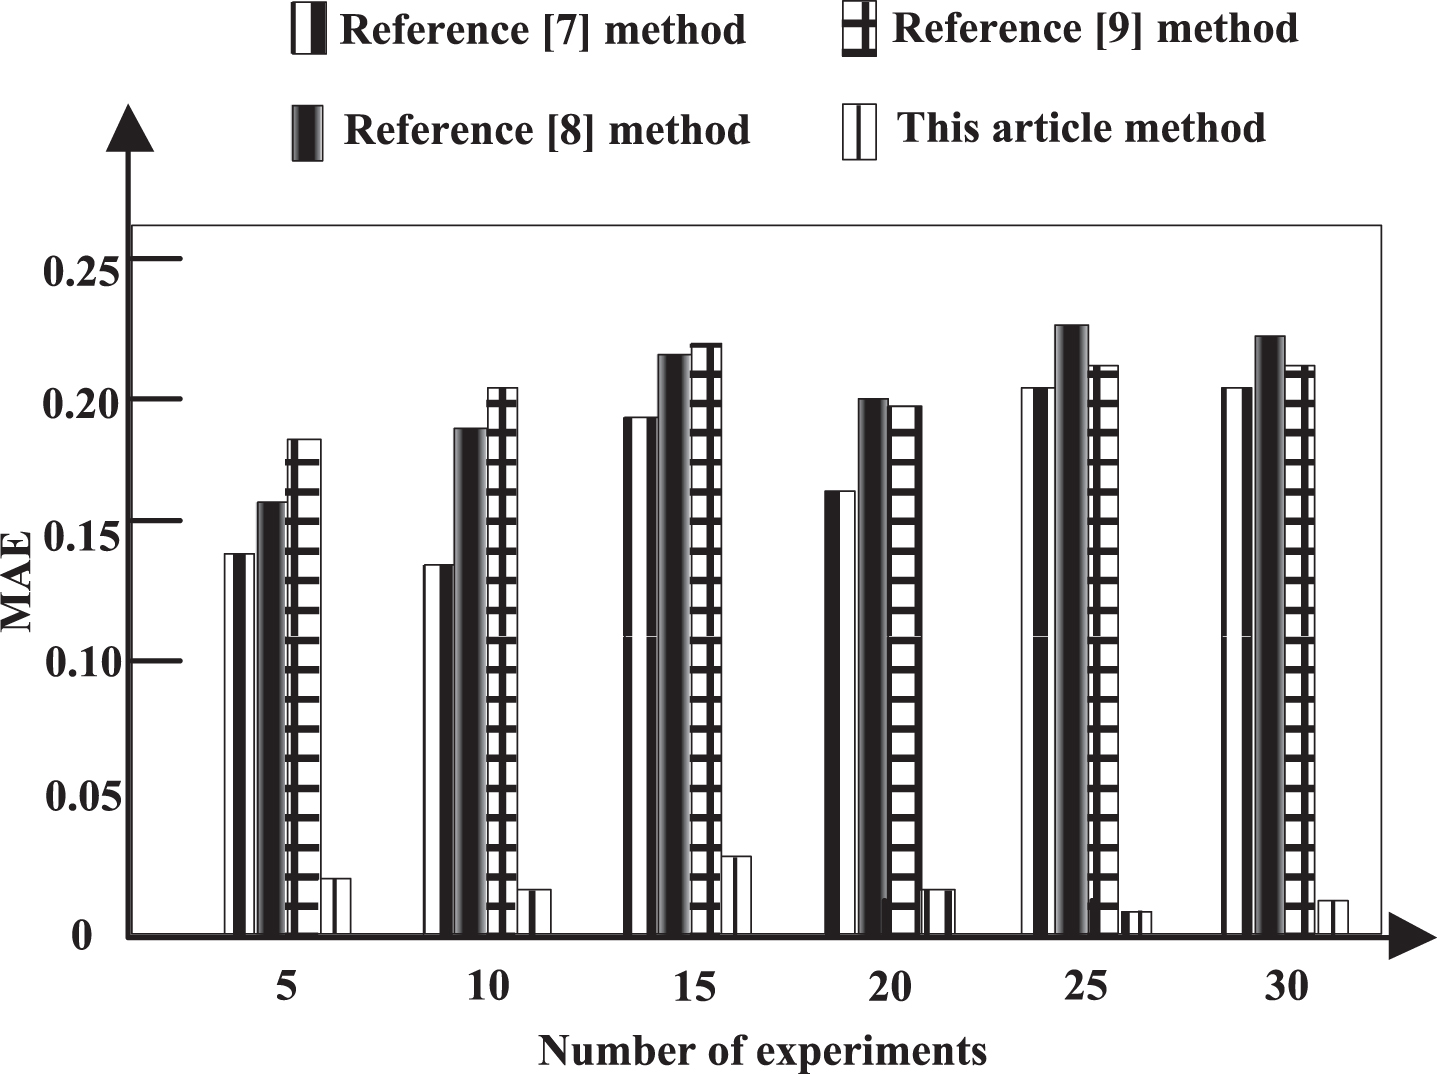
MAE comparison of different research methods.
Analysis of Fig. 11 shows that the average absolute error of the proposed method is less than that of the literature comparison method under the increasing number of experiments. Under 25 experiments, the average absolute error of this method is 0.018, and the average absolute error of literature [7], literature [8], literature [9] methods are 0.19, 0.23 and 0.21, respectively. This shows that the average absolute error of the three literature comparison methods is higher, and the prediction accuracy of this method is higher. This paper uses k-nearest neighbor algorithm, according to the characteristics of k-nearest neighbor algorithm, the unstable traffic flow data can be carefully screened, so the error rate of prediction results in this paper is very low.
It can be seen from Fig. 12 that the mean square error of this paper is only 0.01, and the root mean square error of the reference [7], reference [8], and reference [9] is 0.18, 0.21. 0.23, the mean square error MSE of the three literature comparison methods is higher than the method of this paper, which fully demonstrates that the proposed method has high accuracy of traffic flow uncertainty prediction.

MSE comparison of different research methods.
The smaller the prediction error is, the higher the prediction accuracy is, that is, the higher the fitting degree between the predicted value and the actual value is. From the experimental results of Fig. 13, it can be seen that the MAPE of the uncertainty prediction method for traffic flow based on k-nearest neighbor algorithm proposed in this paper is much smaller than that of the comparison methods in references, showing good feasibility. In this paper, the red-black tree in the balanced binary tree structure is used to store the data in the middle search database, which provides support for the acquisition of data in traffic flow prediction and lays a foundation for high-efficiency and high-precision prediction. Taking into account the uncertainty of traffic flow, Kalman filtering method is combined with k-nearest neighbor algorithm to realize traffic flow prediction and adapt to the uncertainty of traffic flow, which improves the fitting degree between the predicted value and the actual value.
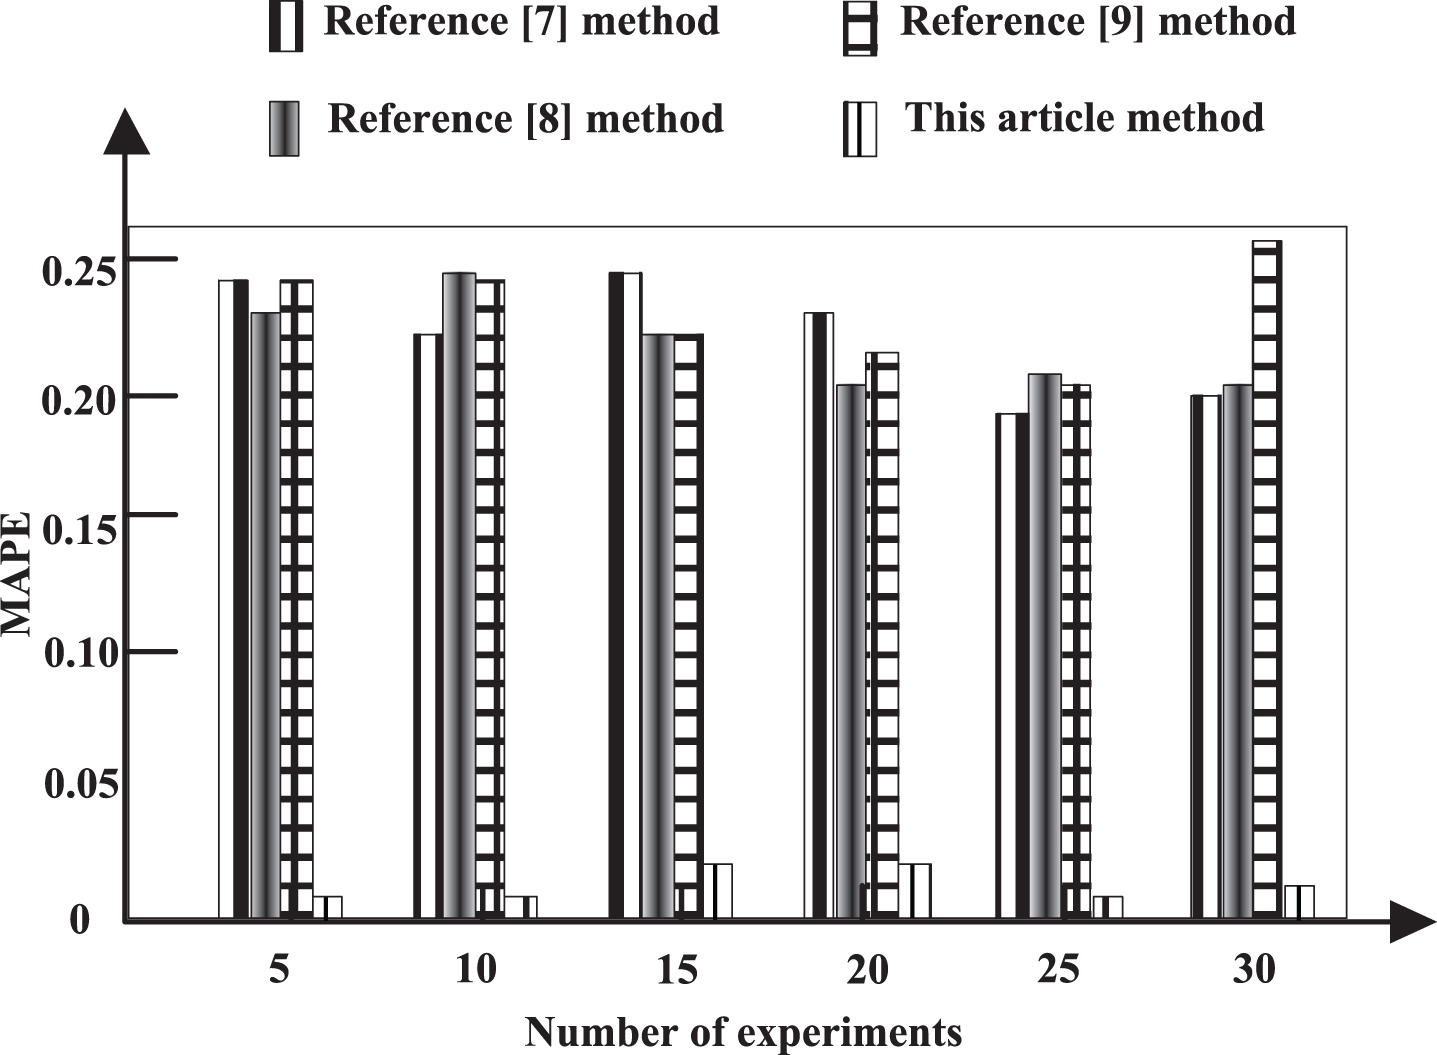
MAPE Comparison of different research methods.
Real-time and accurate prediction of traffic flow is an indispensable part of intelligent transportation system. In view of the existing problems of related research results, a traffic flow uncertainty prediction method based on K-nearest neighbor algorithm is proposed. The following conclusions are proved theoretically and experimentally. The proposed method has lower root mean square error and average relative error in the prediction of traffic flow instability. Specifically, compared with the prediction method based on multi-dimensional time series, this method has lower root mean square error, the lowest is only 0.01; compared with the prediction method based on RVM and ARIMA, this method has lower average relative error, the highest is only 0.025. Therefore, the prediction method based on K-nearest neighbor algorithm proposed in this paper can better meet the demand of traffic flow instability prediction. There are many traffic flow acquisition facilities in the current intelligent transportation system. The next step is to collect traffic flow prediction data in the form of multi-source acquisition, so as to further enhance the credibility of the prediction results.