
Abstract
In order to overcome the problems of poor accuracy and high complexity of current classification algorithm for non-equilibrium data set, this paper proposes a decision tree classification algorithm for non-equilibrium data set based on random forest. Wavelet packet decomposition is used to denoise non-equilibrium data, and SNM algorithm and RFID are combined to remove redundant data from data sets. Based on the results of data processing, the non-equilibrium data sets are classified by random forest method. According to Bootstrap resampling method with certain constraints, the majority and minority samples of each sample subset are sampled, CART is used to train the data set, and a decision tree is constructed. Obtain the final classification results by voting on the CART decision tree classification. Experimental results show that the proposed algorithm has the characteristics of high classification accuracy and low complexity, and it is a feasible classification algorithm for non-equilibrium data set.
Introduction
With the continuous development of information technology, data in various industries show explosive growth. It is not only inefficient but also costly to rely on manual identification for complex and numerous information data. Therefore, how to identify and classify these data quickly is an efficient means to improve the level of information data processing in various industries, and also a key technology to speed up the development of related industries. In this case, data mining appears in the public view [1]. Data mining technology is a new data analysis technology which combines artificial intelligence and machine learning. Machine learning is the core content of this technology. It can complete learning based on prior knowledge already existing, and can accurately predict forthcoming events or uncertain events.
Through the above analysis, we can see that although the amount of data is huge, the proportion of data containing individual types is very small, that is to say, the data set categories are unbalanced, and these data are usually the key for experts and scholars in various fields to rely on for their research [2, 3]. At present, the non-equilibrium data classification methods only aim at a few data samples, and the recognition rate is not very high, so a new non-equilibrium data classification algorithm is needed.
Literature [4] proposes a classification algorithm for unbalanced data sets based on machine learning. Firstly, the sparse domain and dense domain of the sample set are detected by introducing “coefficient of variation”. Then, an improved oversampling method (USMOTE) is proposed for a few samples in the sparse domain. For most class samples in dense domain, an improved undersampling method IS proposed. Finally, the balanced data set IS sent to the machine learning classifier for training, so as to realize the classification of non-balanced data set. However, this method has the defect of poor accuracy in the application process. Literature [5] proposed a classification algorithm of unbalanced data set based on SVM algorithm. First, different sampling multiples are set for different samples of a few classes according to markov sampling method, and the combination of values of these sampling multiples is coded as individuals in the population. Then GA selection, crossover, mutation and other operators were used to optimize the population, and the optimal combination of sampling ratio was obtained when the shutdown condition was reached. Finally, the optimal combination of unbalanced data sets is classified according to SVM algorithm, but this method has the defect of high complexity. Literature [6] proposed a classification algorithm for unbalanced data sets based on linear regression. This article on the basis of the generalized linear model structure, applying the generalized extreme value distribution of GEV will link function and calibration loss function as objective optimization function, to constitute a convex optimization problem, by asymmetry characteristics of generalized extreme value distribution of unbalanced data classification, but the accuracy of this method in the application process of the problem of high complexity and poor.
Nowadays, the problem of classification of non-equilibrium data set is becoming more and more prominent. The above-mentioned research results only complete the classification of non-equilibrium data set without judging and making decisions on the classification results. Therefore, the problem of poor classification accuracy and complexity has arisen. In order to solve the problems mentioned above, the classification decision tree has been constructed and a decision tree classification algorithm for non-equilibrium data set based on random forests is proposed. This algorithm lays a foundation for the progress of unbalanced data set classification technology, solves the problem of mass information classification in modern society, and improves the level of information processing. The overall design scheme of the algorithm is as follows: The wavelet packet decomposition method is adopted to de-noise the non-balanced data. For the complete data with redundancy, SNM algorithm and RFID are combined to divide several filtered data records into a group and sort the data according to the time stamp. When the sliding window moves on the data set after sorting, its size will be adjusted accordingly based on the change of random factors, and the redundant data in the window will be compared with whether there are redundant records, so as to realize the filtering of redundant data. Based on the results of data processing, non - equilibrium data sets are classified by random forest method. According to Bootstrap sampling method with certain constraint conditions, samples of most classes and few classes in various subsets were sampled to obtain the sample set needed in the training process of decision tree. Using CART to train the data set and build the decision tree, the minimum gini coefficient is introduced to realize the split of node attributes. The generated data non-equilibrium coefficient is used to realize the weighting of each decision tree, and the discourse power of non-equilibrium data decision tree in voting is improved. The final classification result is obtained by voting on the classification of CART decision tree. The classification accuracy and complexity of different research methods were compared. conclusion
Decision tree classification algorithm for non-equilibrium data sets based on random forests
Denoising of non-balanced data set
In order to achieve accurate classification of unbalanced data sets, reduce the generation of useless work and reduce the influence of other factors on classification accuracy, this paper introduces wavelet packet decomposition method to carry out denoising processing on unbalanced data sets.
(1) Wavelet packet decomposition
Wavelet packet is a set of functions {un (t)} generated by the combination of scale function φ (t) and wavelet functionψ (t) in the process of multi-resolution analysis, and satisfies the recursive concept of formula (1)[7]:
In the formula, h (k) and g (k) represent the coefficients of low-pass and high-pass filters in the filter banks and satisfy the orthogonal relationship as shown in formula (2):
Where, the essence of wavelet packet is to decompose Hilbert space into two parts: low frequency and high frequency by using h (k) and g (k). Figure 1 is a three-layer wavelet packet decomposition of data.
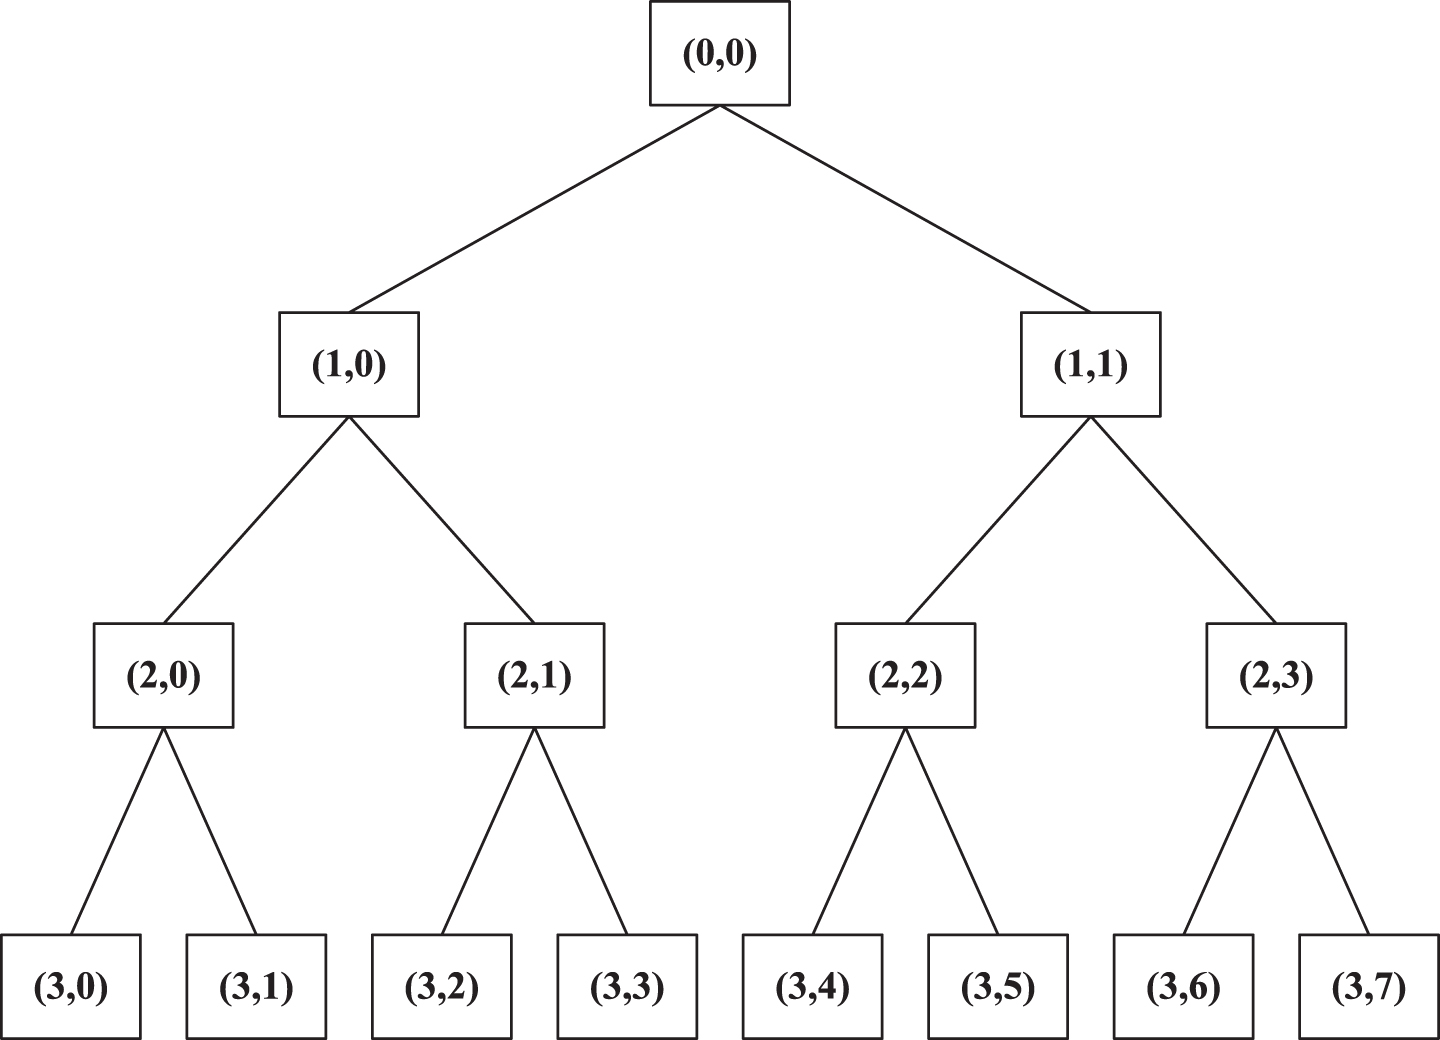
Framework of wavelet packet decomposition tree.
In the figure, (i, j) represents the j-th node in layer i, each node is a data feature. (0, 0) is the original data, (1, 0) is the first low-frequency coefficient in the wavelet packet decomposition, (1, 1) is the first high-frequency coefficient in the wavelet packet decomposition, and the remaining nodes are analogous.
(2) Denoising of shrinkage data of wavelet packet decomposition coefficient
Data with additive noise can be expressed as:
In the formula, x (n) represents noise data [8], s (n) represents real data, e (n) ∼ N (0, 1) represents white Gaussian noise, and σ represents the deviation of noise data.
The purpose of data denoising is to recover the polluted raw data from the observed data [9, 10]. According to the denoising idea of wavelet packet decomposition coefficient, appropriately selected thresholds are used to quantify the wavelet packet decomposition coefficients. The coefficients less than or equal to the threshold are treated as zero. Data reconstruction is realized based on the wavelet packet coefficients above the threshold, which not only removes most of the noise in the observed data, but also retains the original data characteristics [11]. According to the above, the selection of threshold has a great influence on the denoising effect.
Denoising of wavelet packet decomposition consists of three steps:
Where, W (·) and W-1 (·) represent wavelet packet decomposition and reconstruction, D (Y, T) represents shrinkage processing of wavelet packet decomposition coefficients of given threshold T, X represents noise data, Y represents the wavelet packet decomposition coefficient X, Z represents the wavelet packet coefficient after shrinkage,
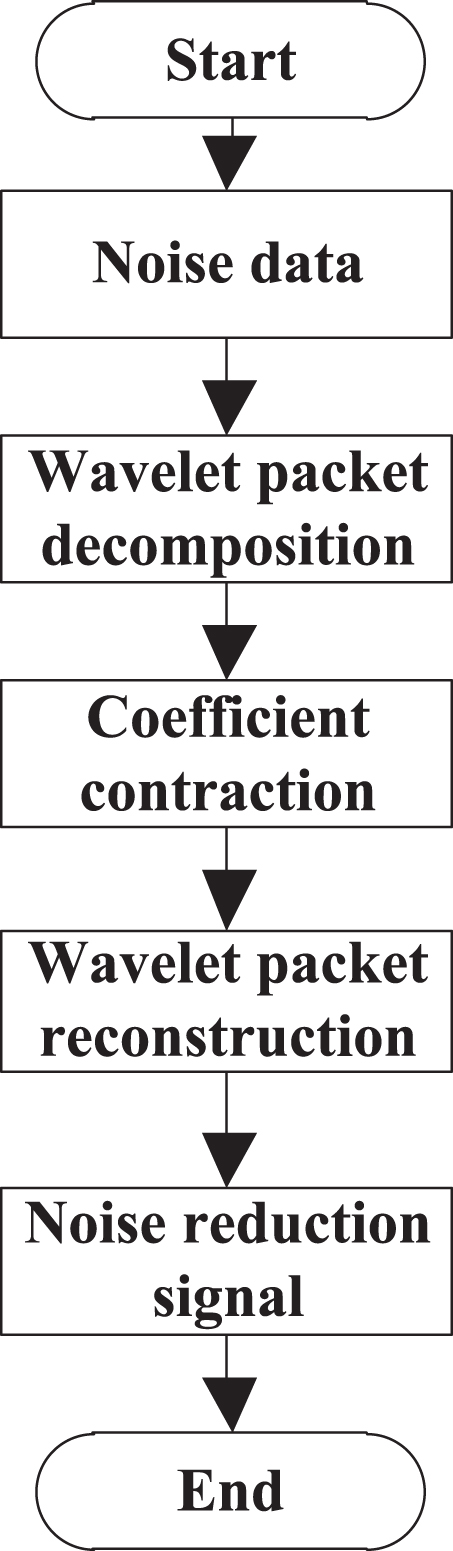
Denoising flow of shrinkage data of wavelet packet decomposition coefficient.
In the process of processing noisy data, the key is the selection of threshold function. This paper chooses the soft and hard threshold functions, and the difference between them is shown in Fig. 3.
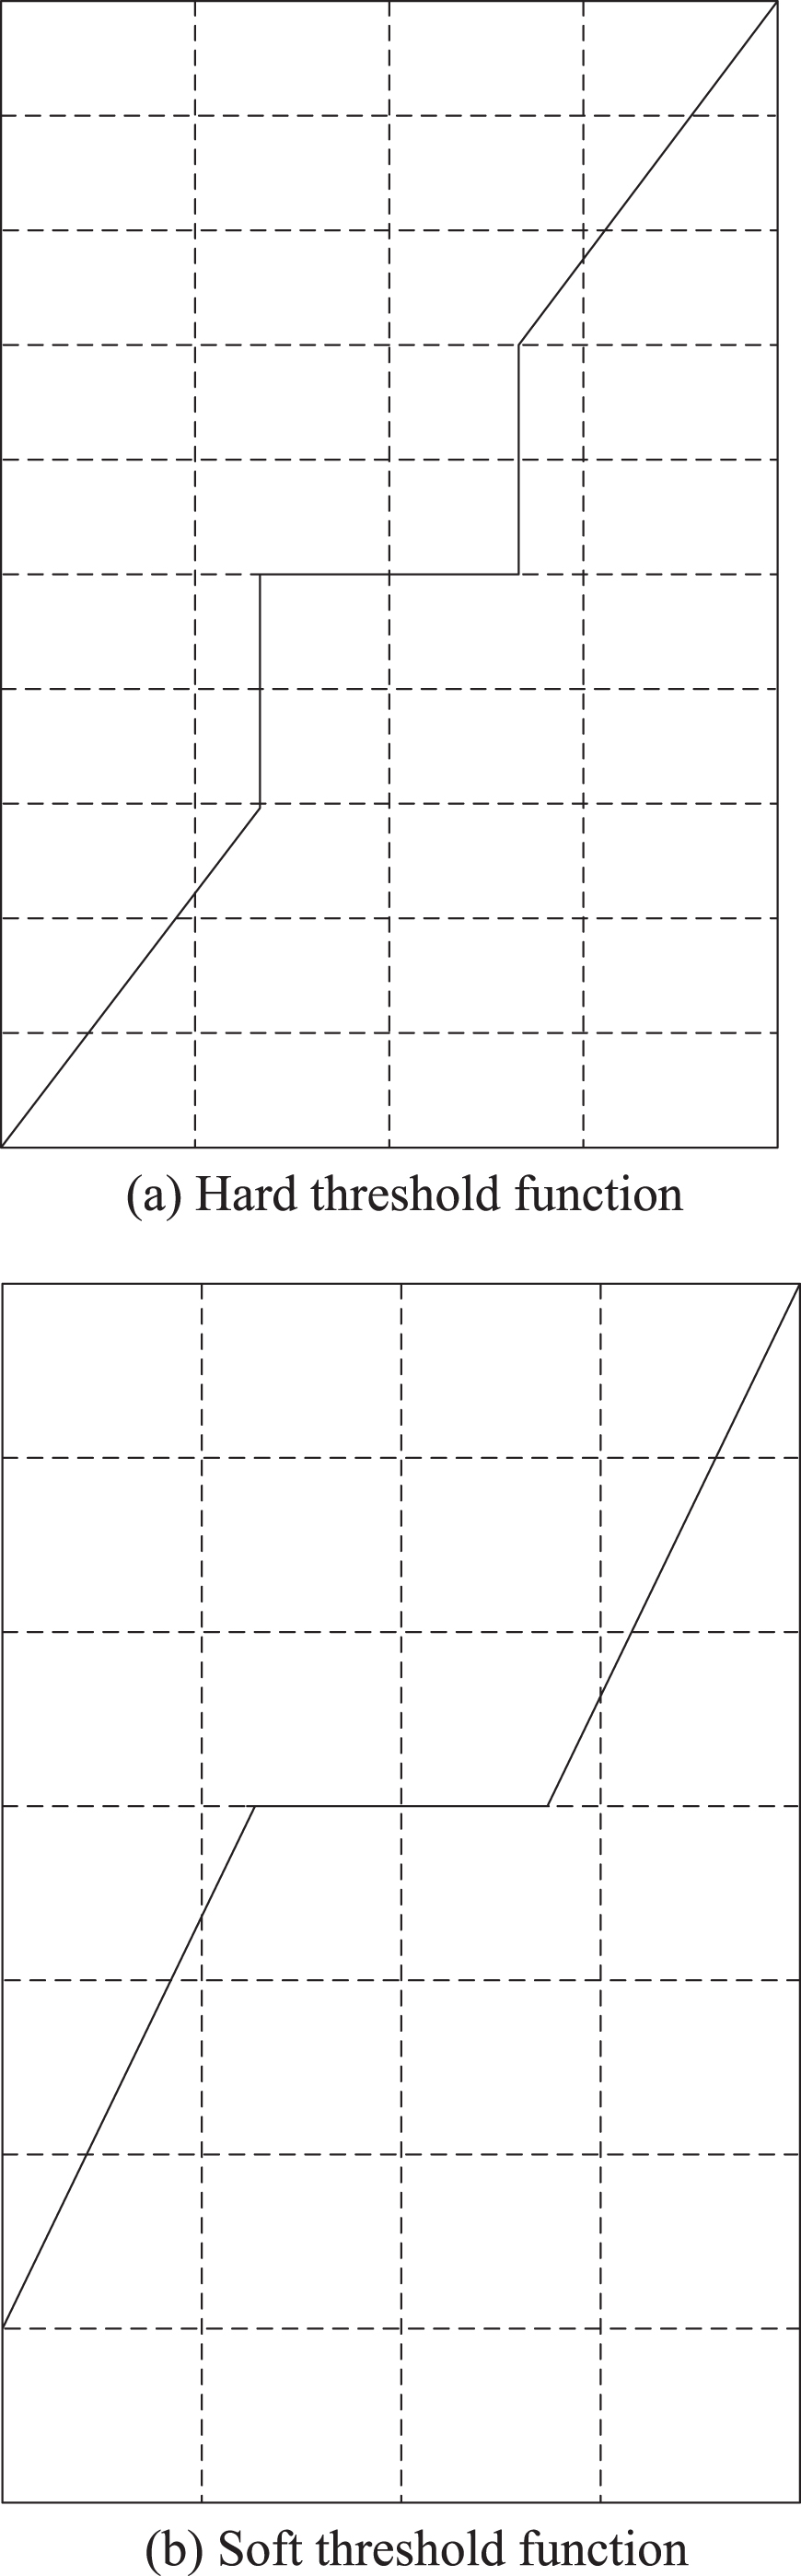
Soft and hard threshold functions.
The mathematical expressions of hard and soft threshold functions are as follows:
The expression of the hard threshold function is as follows:
The mathematical expression of soft threshold function is as follows:
The different threshold conditions in formula (7) and formula (8) are combined with wavelet packet decomposition step (4), (5), (6) to achieve denoising of non-equilibrium data set.
In order to achieve better classification of non-equilibrium data set, the combination of SNM algorithm and RFID is used to remove redundant data in data sets.
Usually, redundant data detection needs to identify two or more duplicate data. The basic operation idea of SNM algorithm is to determine the keyword, sort the data in the data set based on the keyword, and add a fixed size sliding window in the sorted data set, in which only the data in the window is detected [12, 13]. Assuming that the sliding window contains m records, the sliding window size is m. In the process of window moving, the first record in the original window will be moved out. The data in the new window is compared with the m - 1 record in the original window, and whether there are duplicate records is identified until the data stream is processed completely. Figure 4 illustrates the principle of window sliding.
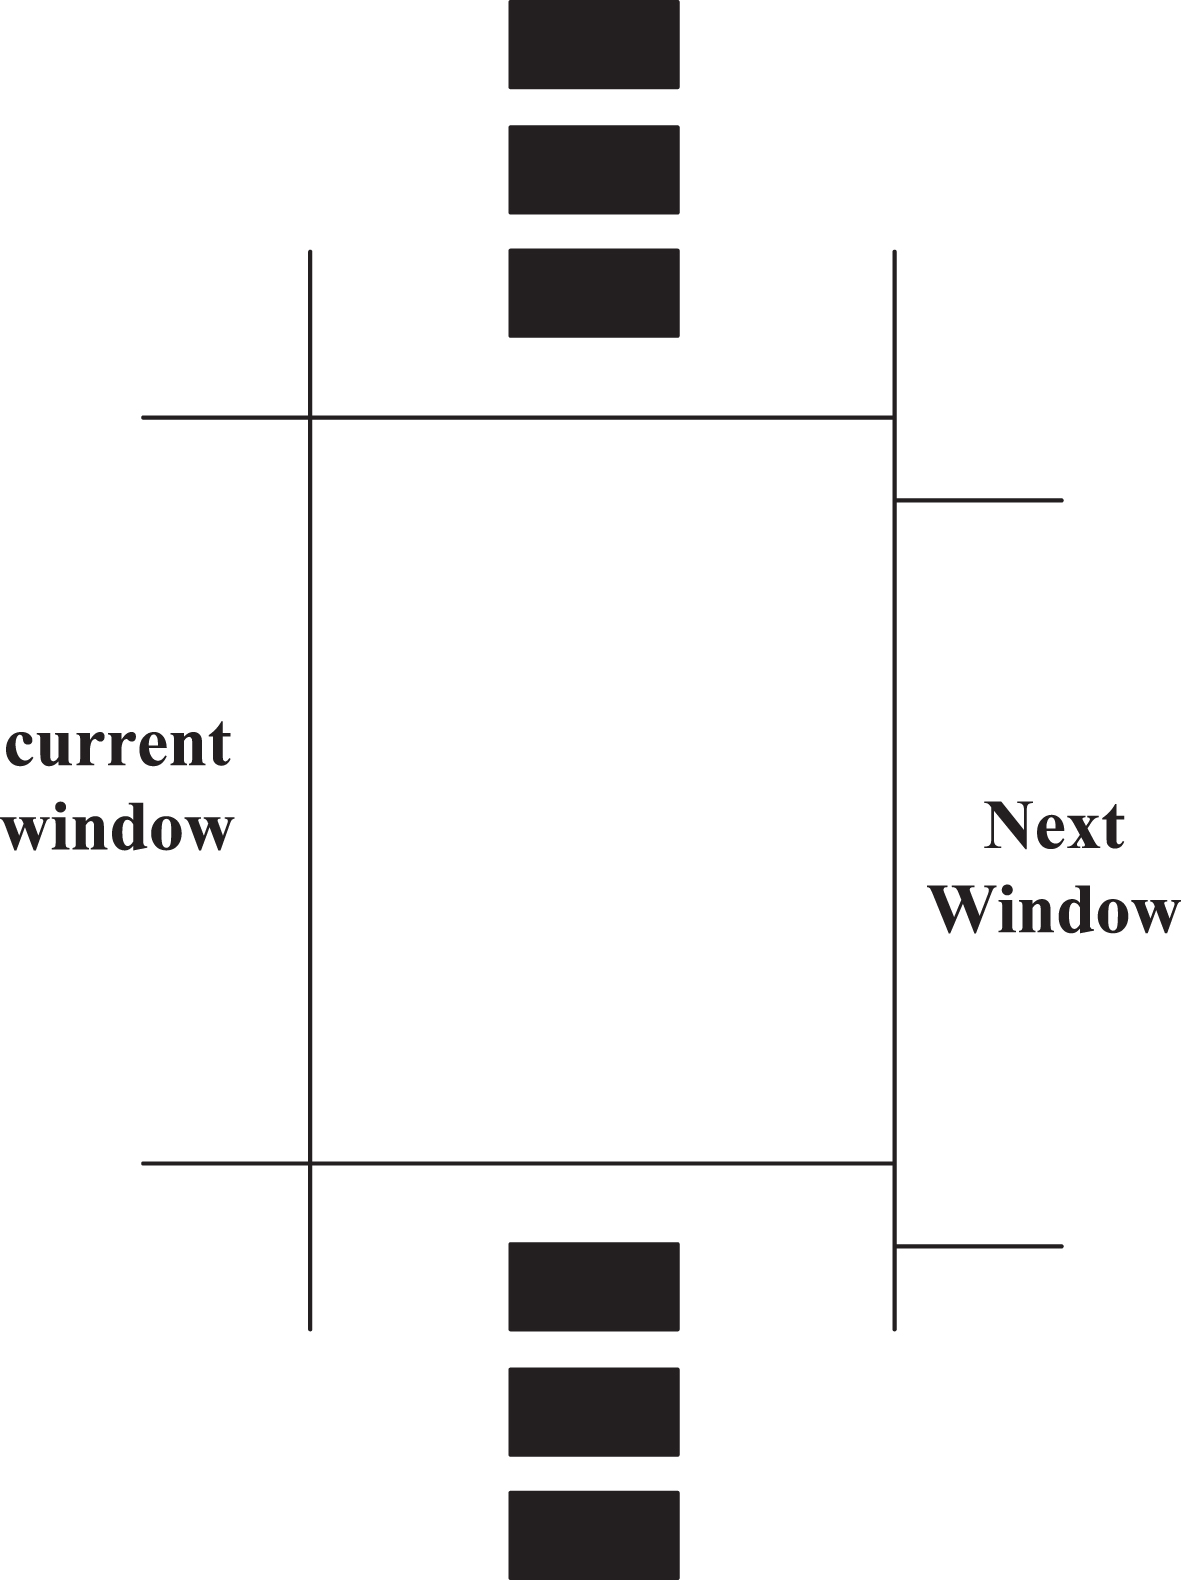
Operating principle of window sliding.
The running process of SNM algorithm is shown in Fig. 5.
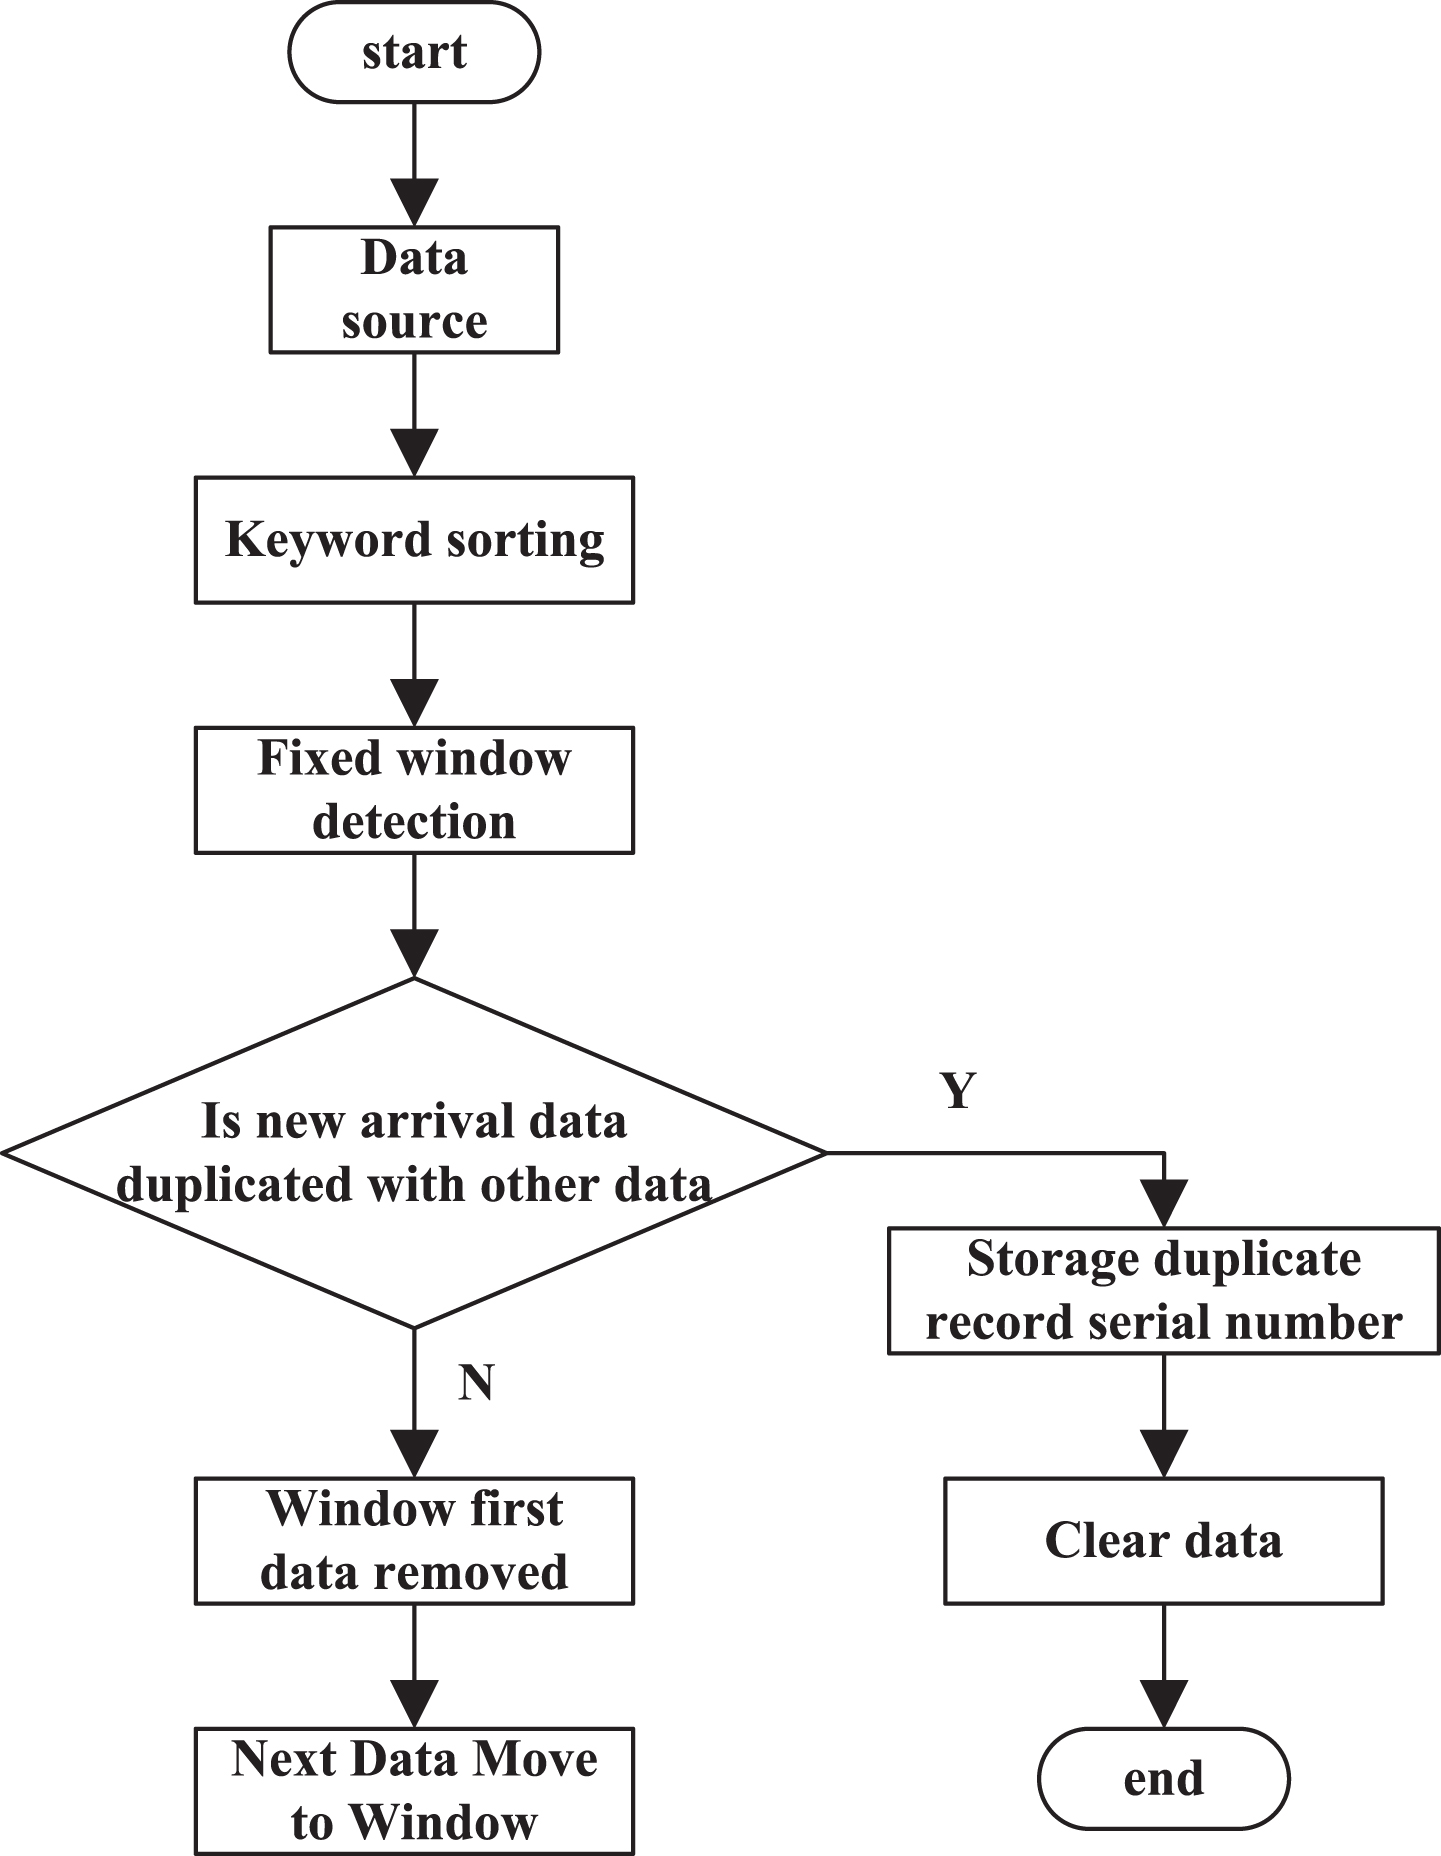
The running flow of SNM algorithm.
According to the above idea of redundant data detection and processing algorithm, RFID is introduced. For data redundancy, through the time stamp sorting, it is made corresponding processing, and then reordered based on reader ID to further process redundant data, and improve the accuracy of removal. The detailed process is as follows: first, the integrity of each data is judged according to the order, and if it is incomplete, then it is deleted directly; if it is complete, then each M filters is recorded as a group and sorted according to the timestamp. The window moves on the sorted data set, and the size of the window is adjusted accordingly based on the change of random factors. The data in the window is compared whether there are redundant records or not [14]. The detailed process is as follows:
Step 1: Check the data integrity. If the data is incomplete, delete the data directly. If the data is complete, then execute step 2.
Step 2: Group the complete data after detection according to the rules, and divide each M data into a group.
Step 3: Sort M data according to timestamp.
Step 4: Move the random change window on the data set sorted in step 3.
Step 5: Contrast the redundancy between the first data in the current window and the remaining data below, if redundancy exists, then go to step 6; on the contrary, go to step 7.
Step 6: When one data and the first data in the window are redundancy, the number of data redundancy is increased by 1, while the old timestamp data is deleted, and the latest timestamp data is retained.
Step 7: Judge whether the first data in the window is the last one or not. If not, move it out and go to step 5. On the contrary, move the last data out and go to step 8.
Step 8: Discriminate whether there is unprocessed data. If it is yes, go to step 3; otherwise, end the algorithm.
The redundant data detection and processing under the combination of SNM algorithm and RFID is shown in Fig. 6.
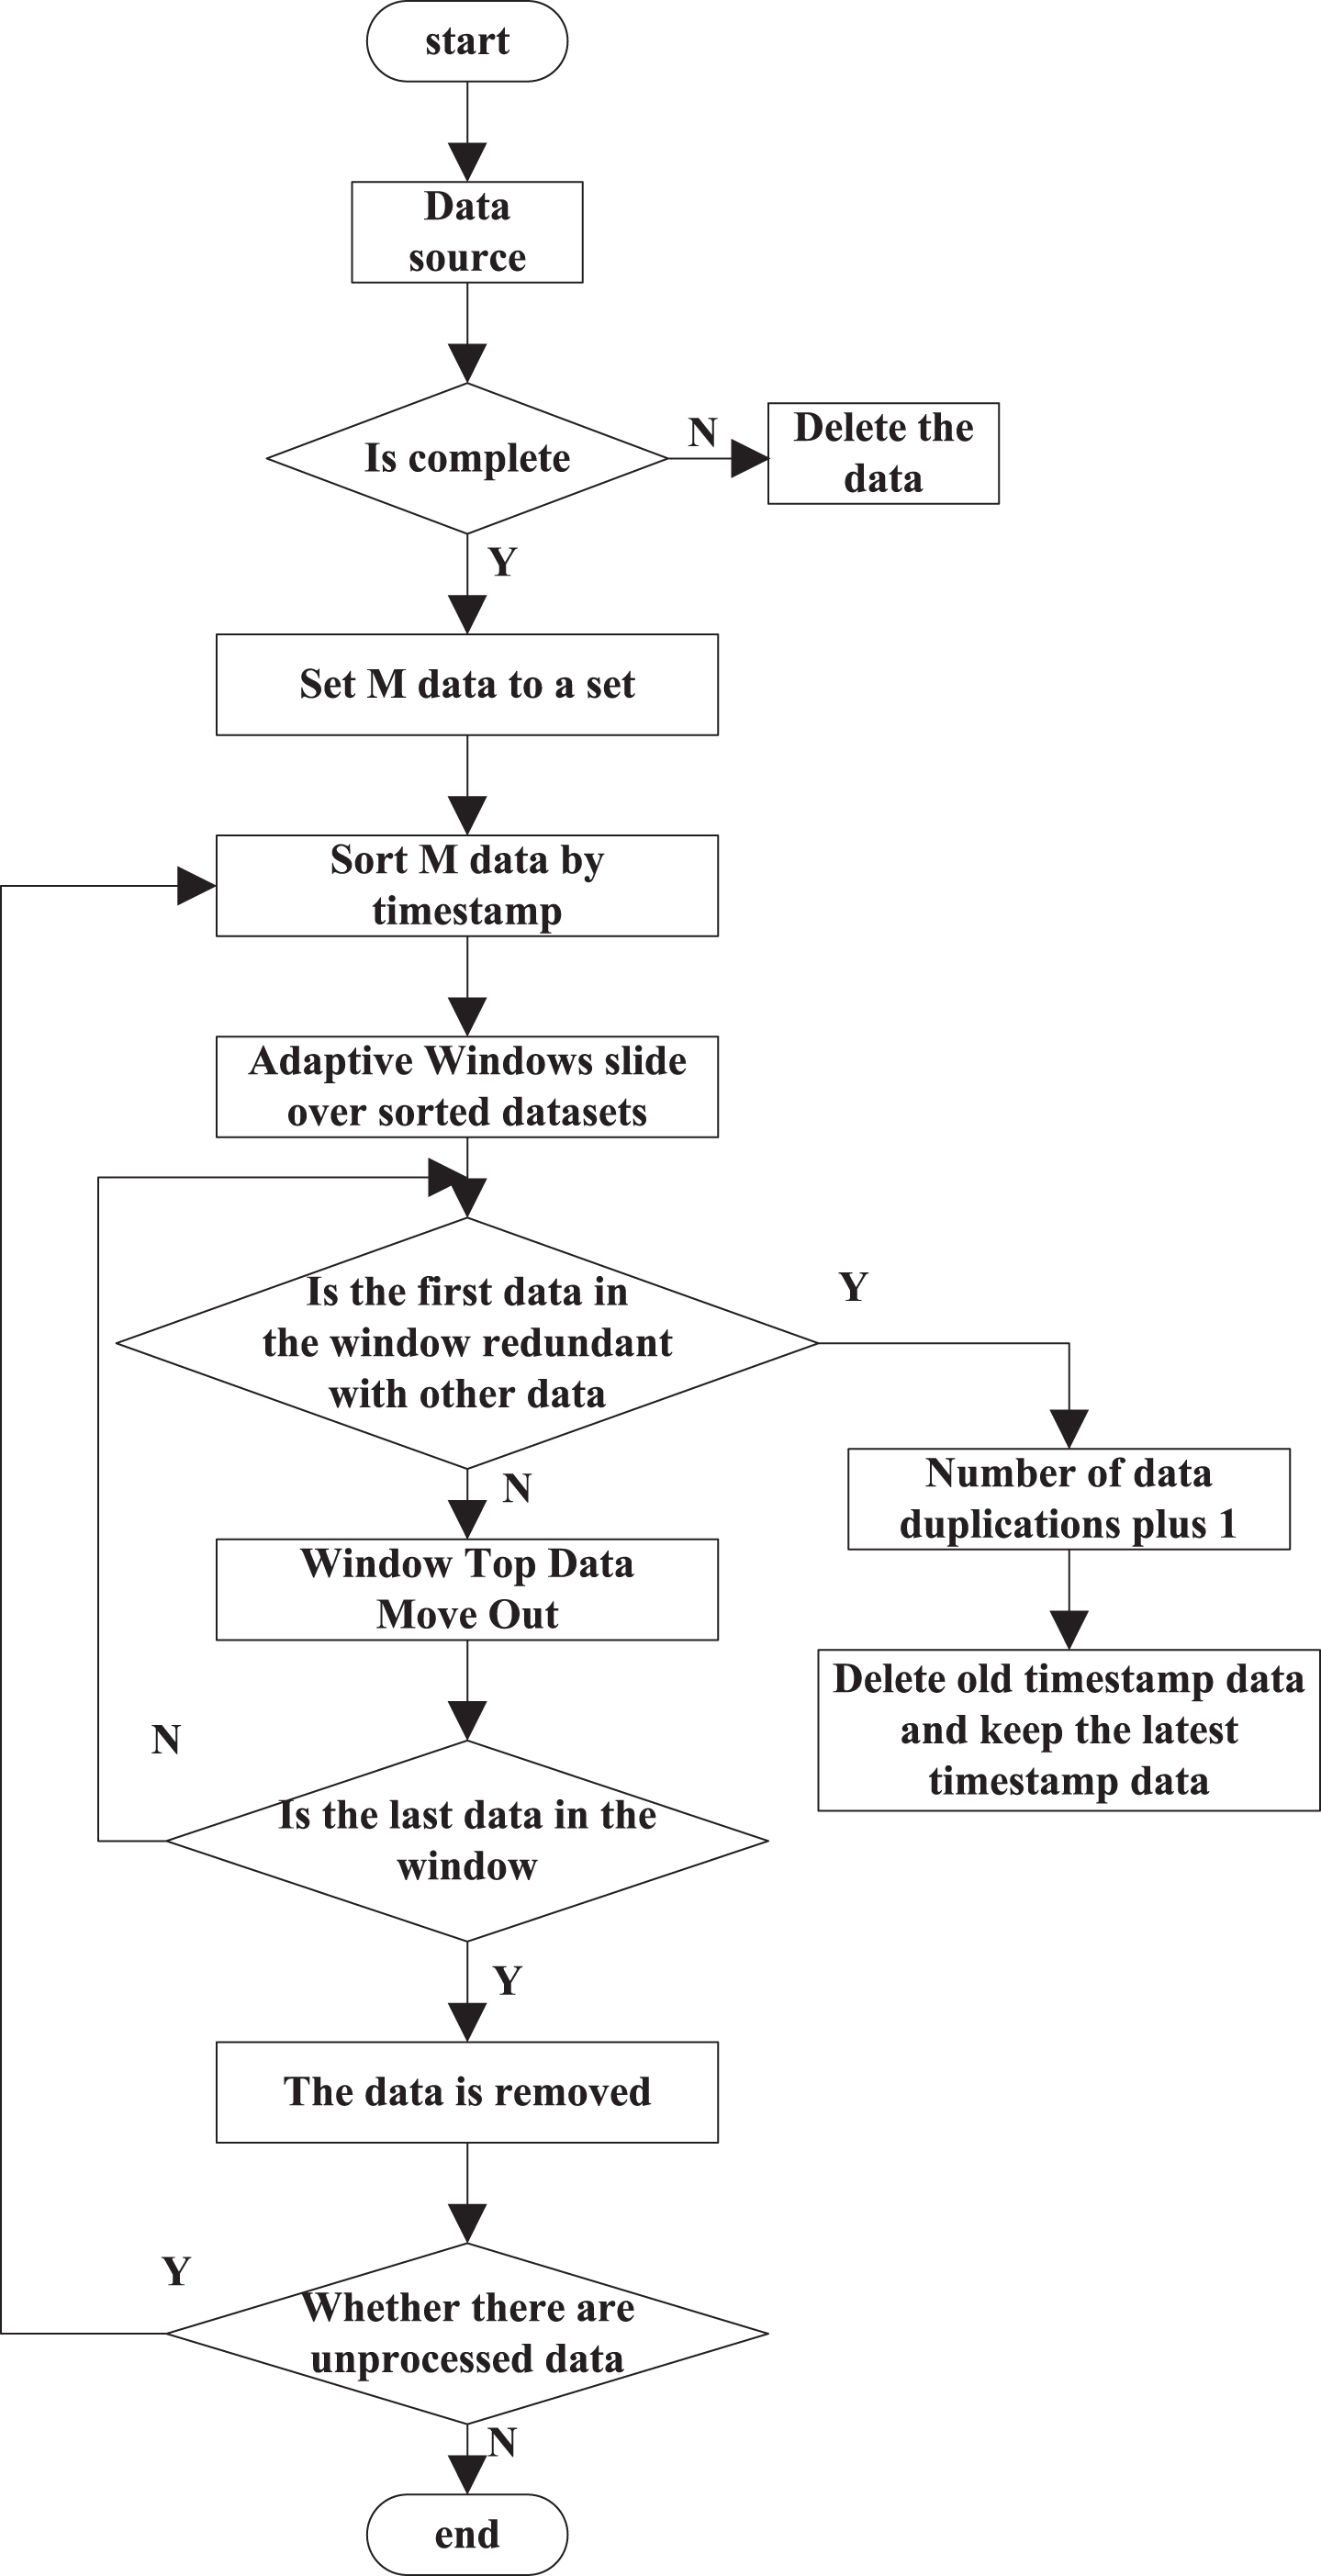
Processing flow of redundant data detection by SNM algorithm combined with RFID.
The data denoising and redundant data filtering in 2.1 and 2.2 effectively reduce the complexity of data set classification. Based on the above data processing, random forest is used to classify the non-equilibrium data sets.
In order to realize the high accuracy and low complexity of the classification of unbalanced data sets, the random forest algorithm is chosen in the decision tree classification of unbalanced data sets. Random forest is an algorithm that integrates multiple trees through the idea of integrated learning. Its basic unit is decision tree, and its essence is a branch of machine learning. Random forest is a very flexible and practical method, which has the following advantages:
Excellent accuracy; Can effectively run on the big data set; It can process input samples with high dimensional features without the need of dimension reduction. Ability to assess the importance of each feature in the classification problem; In the process of generation, an unbiased estimation of internal generation error can be obtained. For the default problem can also get good results.
The implementation process is as follows:
Suppose there are n samples in the training set, and each sample has d characteristics, and a random forest containing T trees needs to be trained. The specific algorithm flow is as follows: for T decision tree, repeat the operation respectively: Bootstrap sampling was used to obtain training set D of size n from training set D; randomly select m from d features for classification, the final category shall be determined according to the voting principle.
The generation of each tree is random, as for the randomly selected feature number, how to determine the size of the randomly selected feature number, there are mainly two methods: one is cross validation, and the other is empirical parameter setting.
The decision tree classification of non-equilibrium data sets based on random forests is shown in Fig. 7.
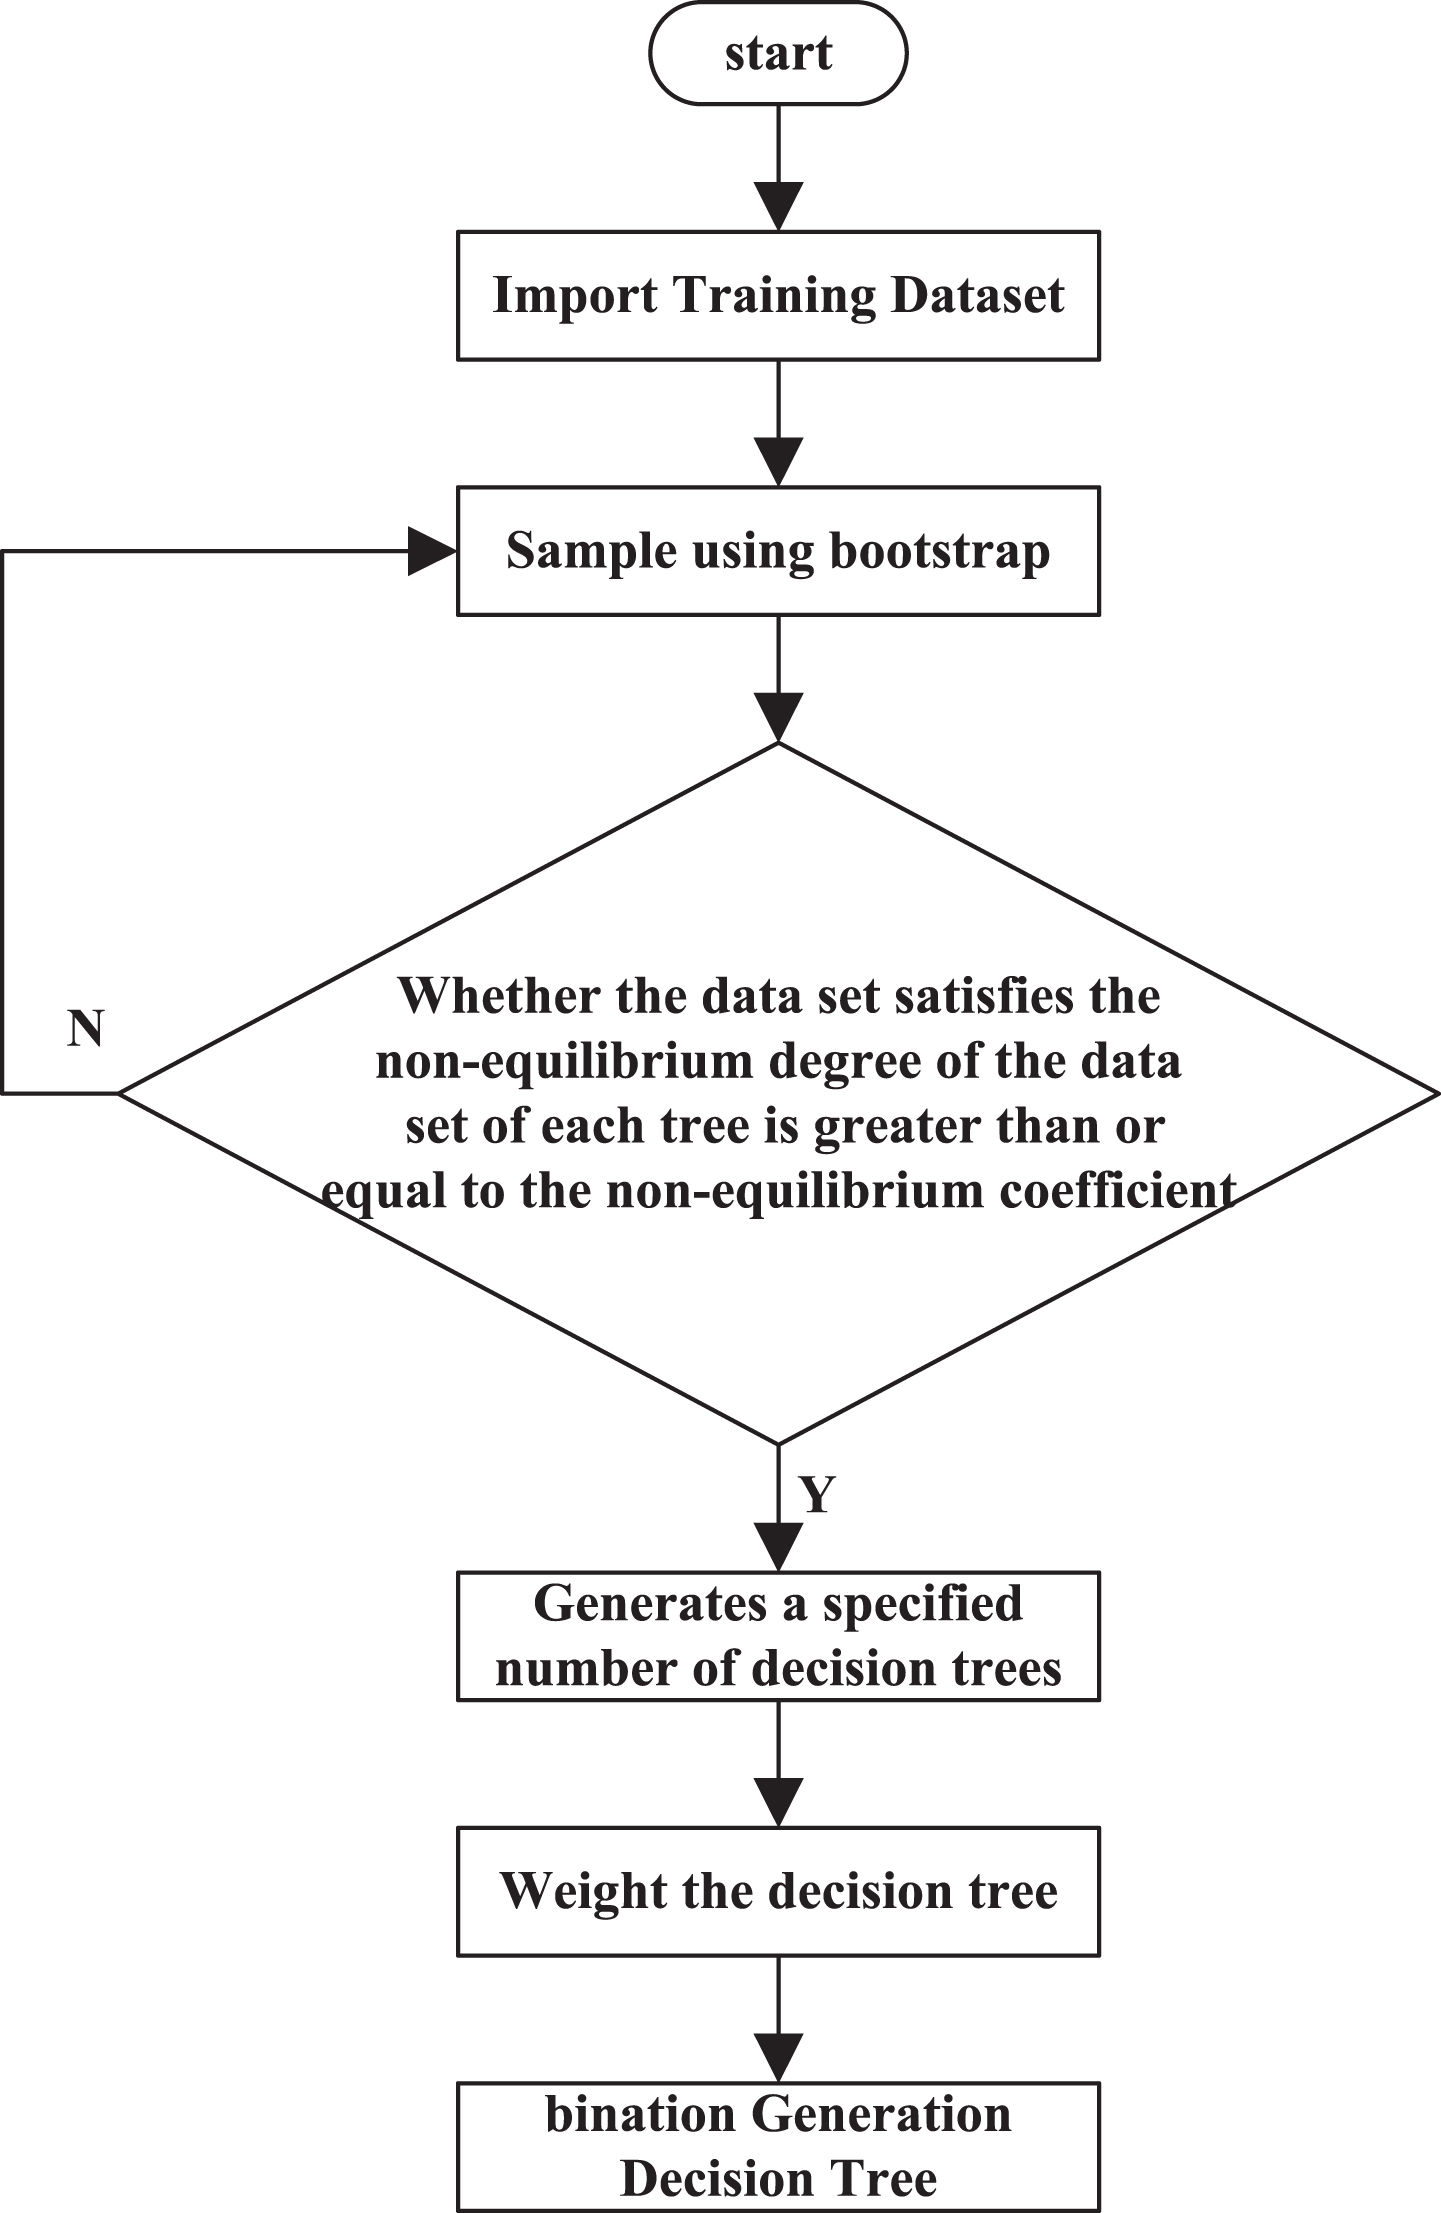
Decision tree classification based on non-equilibrium data set of random forests.
According to Fig. 7, there are:
(1) Resampling under Bootstrap
Using Bootstrap resampling method with certain constraints, the sampling results are screened and the invalid subset is eliminated to ensure that the internal non-equilibrium coefficient R* of the obtained training subset is less than or equal to the original non-equilibrium coefficient.
The resampling process under Bootstrap is as follows:
Step 1: Extract two-thirds of the samples from the sample set S* and replace it after recording the observations.
Step 2: Set a cost in the process of extracting data from sample set S* to ensure that the acquired data set and unbalanced degree are less than or equal to the original data set [15, 16]. Then there are:
Where,
Step 3: Assuming that the sampled data set satisfies the conditions in step 2, then iterate step 1 and calculate the total number of repeated decision trees.
(2) Weighted random forest
In the past, the CART decision tree is usually used as the base classifier in the random forest method [17]. The decision tree is split by randomly selecting attributes. CART decision tree uses the minimum Gini coefficient to segment. Detailed segmentation process is as follows:
Where
According to the above calculation, there are two kinds of non-equilibrium data in which the non-equilibrium coefficient is R*R*:
In the above calculation,
In conclusion, the process of solving the minimum Gini coefficient for non-equilibrium data can be transformed into a problem of solving the non-equilibrium coefficient [18, 19]. Among them, the target node
(3) Bootstrap resampling algorithm for decision tree classification of non-equilibrium data sets based on weighted random forests
In the process of running the random forest algorithm, decision tree will not be treated differently. It is unreasonable that decision tree with poor classification ability of data sets has the same voting rights as decision tree with good classification ability [20]. Assuming that these decision trees can be treated differently to some extent, it can effectively improve the voice power of decision trees, and then improve the voting speed of random forest algorithm.
In view of the above, assuming that the original voting weights of all decision trees are all 1, the method of calculating the weight of each tree is that the non-equilibrium degree Rn of the data set in each decision tree is higher than the average of the data set after all sampling. the weight function expression is as follows:
The voting weight of the decision tree of each non-equilibrium data set is as 1, and it has little effect on the classification of fandom forest algorithm.
In the above, Bootstrap resampling method with certain constraints is used to sample the majority and minority samples in each sample subset to obtain the sample set needed in the training process of decision tree, and to prevent the problem that the unbalanced rate of non-equilibrium data sets is too high and the minority data samples can not participate in the training. CarT is used to train data sets and construct decision tree. Minimum Gini coefficient is introduced to split node attributes. The non-equilibrium coefficients of the generated data are used to realize the weighting of each decision tree, and to enhance the voice of the non-equilibrium data decision tree when voting [21]. The final classification results are obtained by voting on the CART decision tree classification.
In order to verify the overall effectiveness of the decision tree classification algorithm based on random forest, a correlation experiment was conducted. The overall experimental scheme was as follows: the experimental data was obtained from KEEL, and the data set warehouse contained 9 non-equilibrium binary classification sample sets. In order to improve the fairness of the experiment, it was necessary to input the test data into the experimental system, which was the data preprocessing step. Set up the experimental environment, the hardware equipment used in the experiment is 15 PCs, one of which is the host node machine, the remaining 14 are from the slave node machine, and all the nodes have the same configuration. The Linux operating system is used in the experiment. Methods in reference [4], reference [5] and reference [6] are selected as experimental comparison to verify the proposed algorithm in terms of accuracy and complexity of data classification. Accuracy verification indexes of data classification are goodness of fit index (GFI), normed fit index (NFI), comparative fit index (CFI), non- normed fit index (NNFI), and complexity verification index is degree of freedom. Firstly, the classification accuracy of different research methods is compared. The higher the accuracy is, the higher the classification accuracy of the method is. Then the complexity of different research methods is compared. The lower the complexity is, the stronger the feasibility of the method is. The specific experimental process is as follows:
The experimental results are as follows:
Analysis of Fig. 8 shows that the goodness of fit index GFI of the algorithm in reference [4] varies between 0.75–0.80, the standard fit index NFI fluctuates between 0.68–0.75, the comparison fit index CFI varies between 0.80, and the non-standard fit index NNFI varies between 0.72–0.85. The goodness-of-fit index GFI of the literature [5] algorithm varies between 0.78–0.83, the standard fitting index NFI fluctuates between 0.65–0.82, the comparison fitting index CFI is around 0.81, and the non-standard fitting index NNFI is 0.75. –0.81 change. The goodness-of-fit index GFI of the literature [6] algorithm varies between 0.69–0.83, the standard fitting index NFI fluctuates between 0.63–0.79, and the comparison fitting index CFI varies from 0.79–0.82, non-standard fitting. The index NNFI varies between 0.82–0.86. In this paper, the goodness of fit index GFI, standard fit index NFI, comparison fit index CFI and non-standard fit index NNFI are generally greater than or equal to 0.9, which are more reliable than other results in the literature and show good classification accuracy. The reason lies in that this paper firstly carries out denoising and removing redundant data processing on the data set. On the basis of the data processing results, the classification of non-equilibrium data set by random forest method can effectively improve the accuracy of classification of non-equilibrium data set.
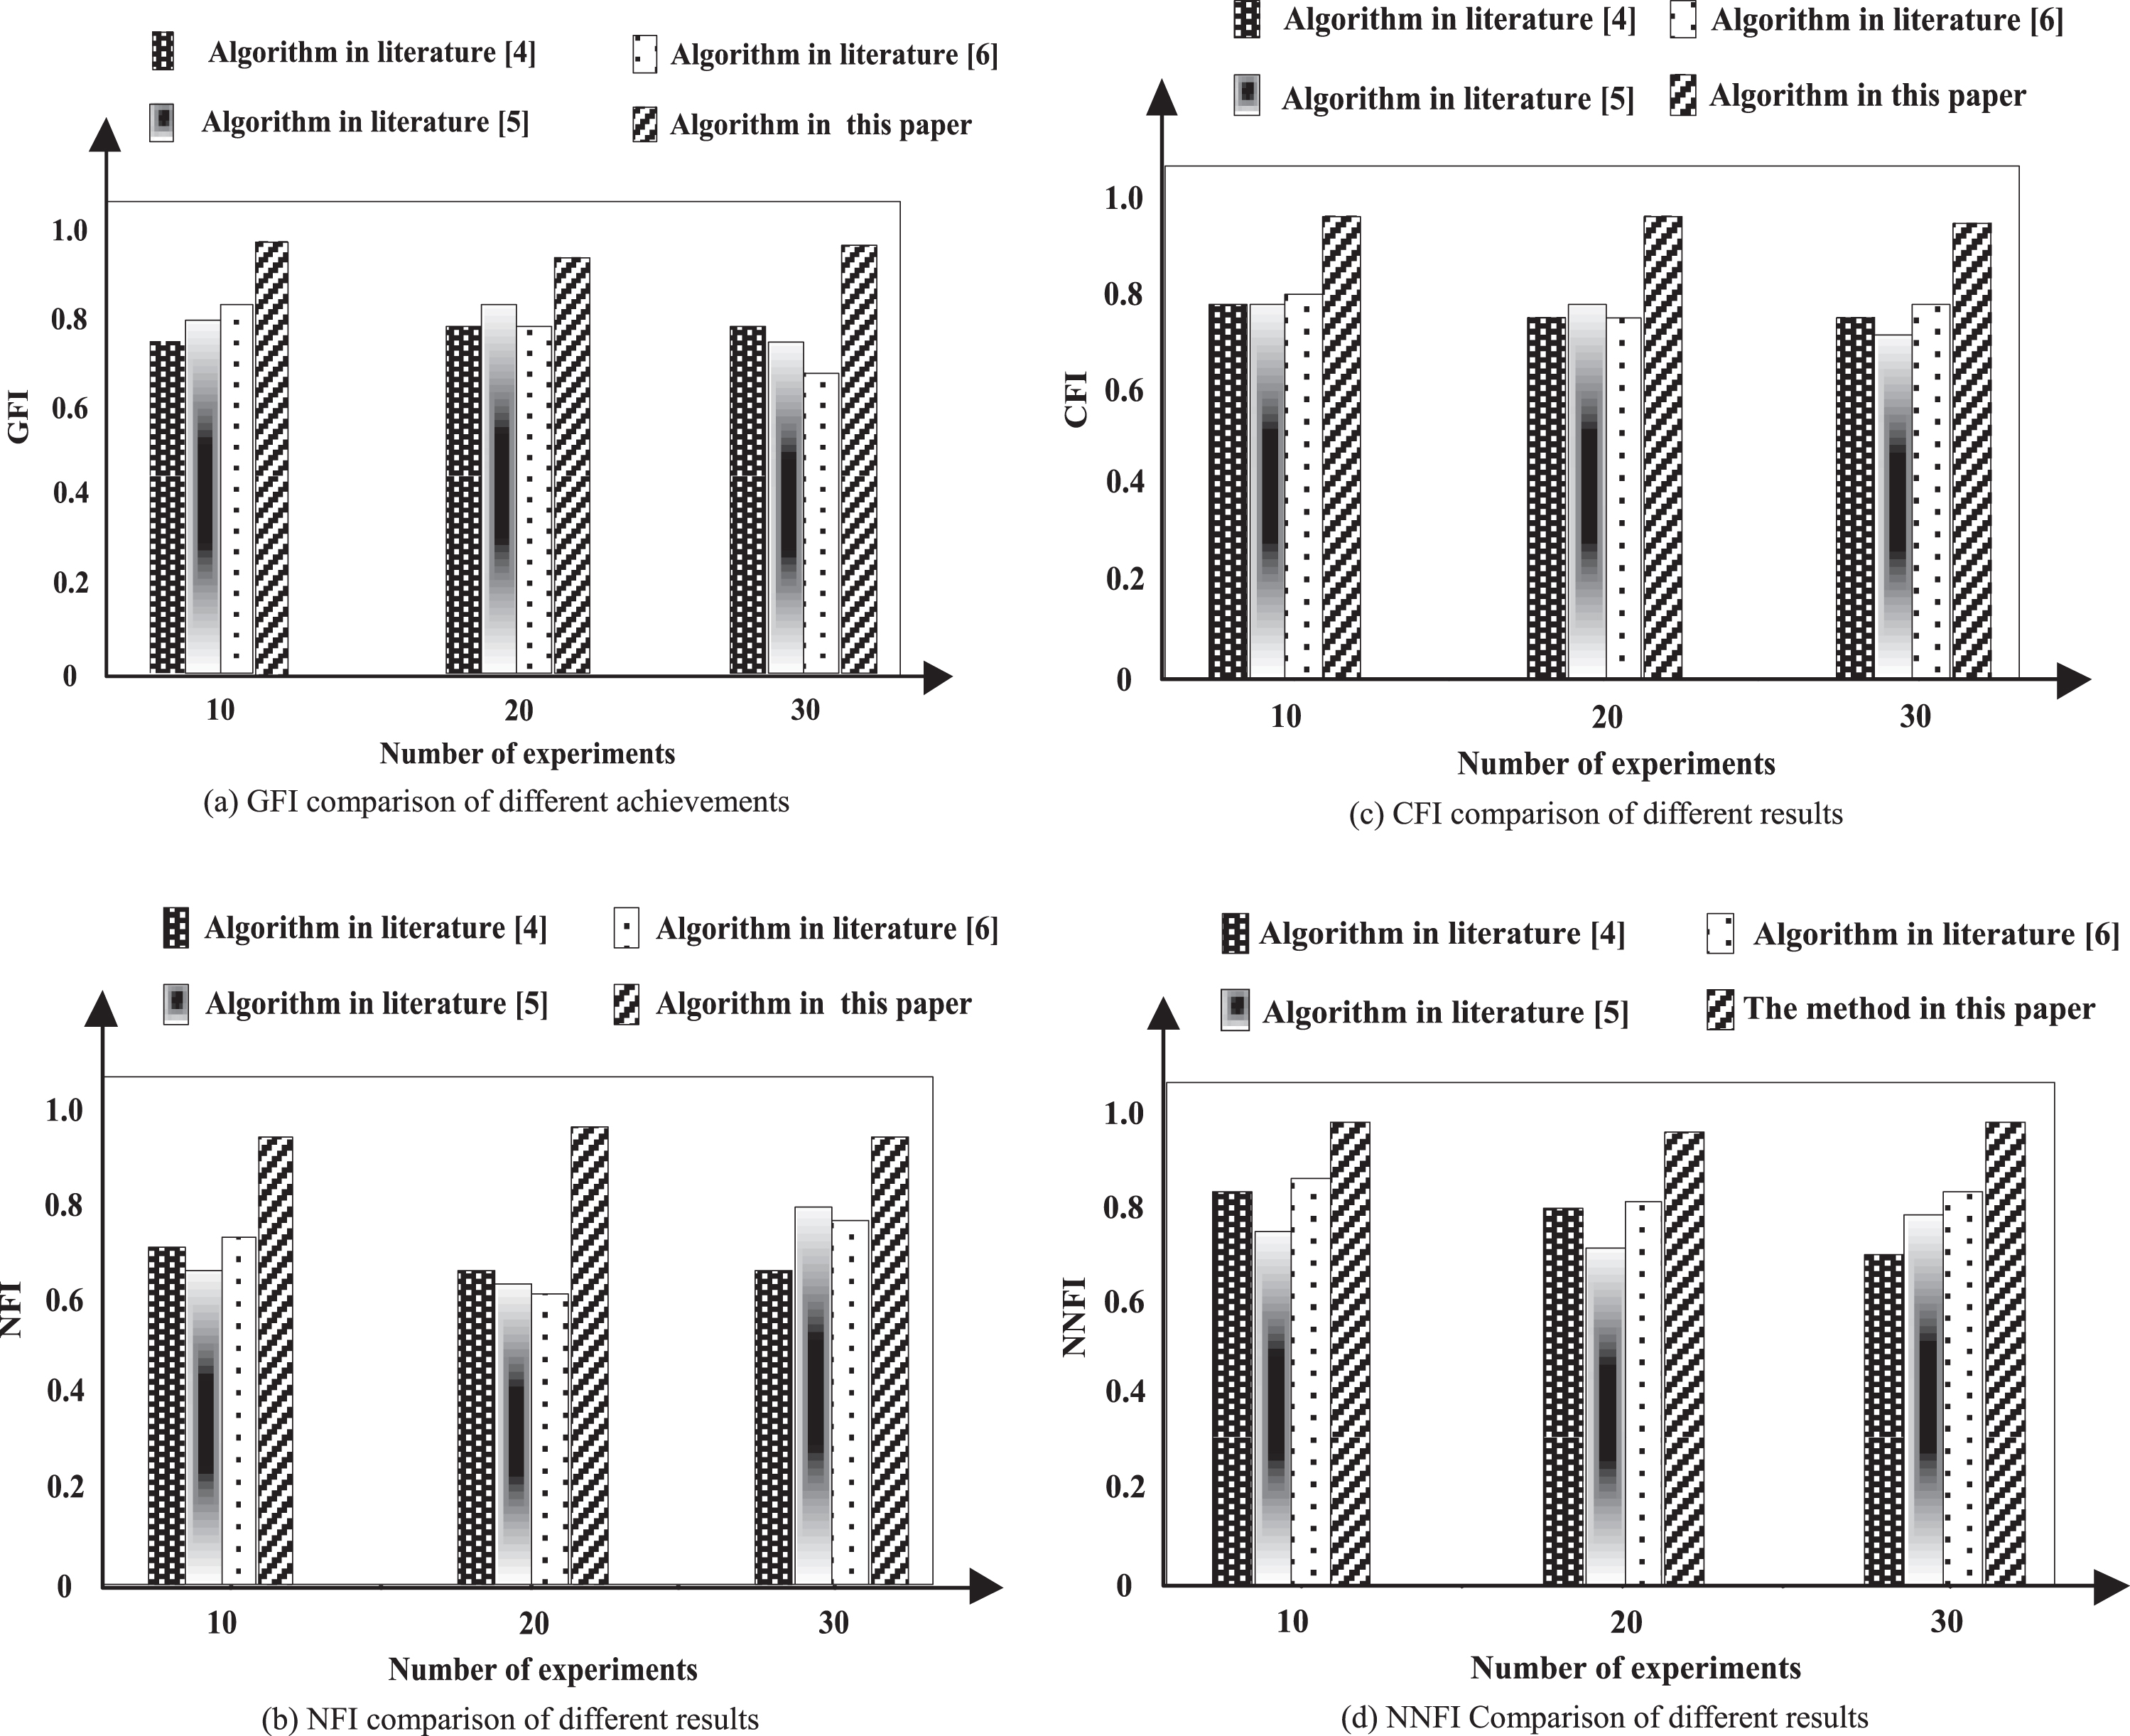
Accuracy comparison of data classification for different results.
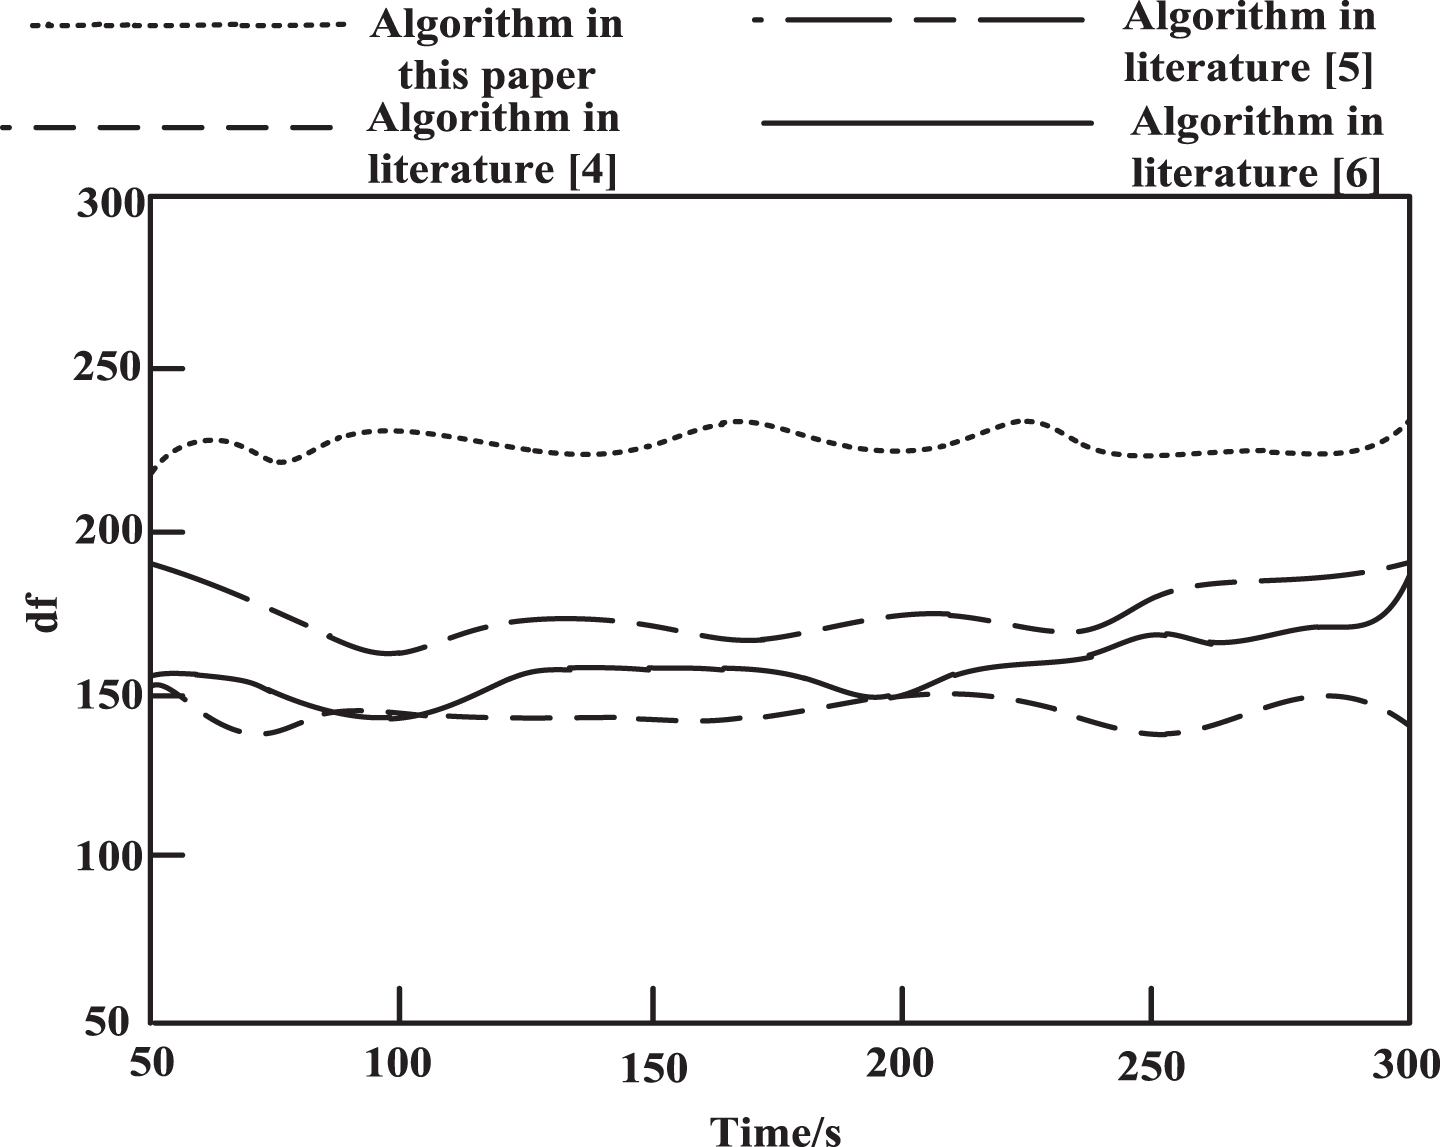
Comparison of degrees of freedom of different research results.
The higher the degree of freedom df indicates the algorithm complexity is lower, it can be seen from the experiment results, the algorithm of literature [4] freedom transformation between 130–155, 170–200 degrees of freedom of literature [5] algorithm between transformation algorithm of literature [6] freedom transformation between 145–185, this paper algorithm freedom always stay above 220, degrees of freedom is higher, so the operation complexity of the algorithm is more low, the reason for this is that we make use of this algorithm has a certain constraint condition of the Bootstrap heavy sampling method for all kinds of book collection in the majority of classes with a few samples for sampling, The problem that the unbalanced rate of the unbalanced data set is too large and a few data samples cannot participate in the training is effectively solved. In this case, data classification is carried out to further enhance the reliability of the algorithm.
In the current field of data processing, manual identification is not only inefficient, but also costly for the processing of complex and numerous information data. Based on the current research results of non-equilibrium data set classification, a decision tree classification algorithm for non-equilibrium data set based on random forest is proposed. In the process, based on data denoising and redundancy analysis, the efficient classification of non-equilibrium data set is realized by improving the resampling method in random forests and the differential treatment of decision trees. Experiments to validate the proposed algorithm, the result shows that this algorithm of goodness of fit index of GFI, standard fitting index NFI, more fitting index CFI, non - standard fitting index NNFI generally greater than or equal to 0.9, the degrees of freedom always stay above 220, has the characteristics of high classification accuracy, low complexity, and can effectively solve the problems existing in the current, strong feasibility. This algorithm lays a foundation for the progress of unbalanced data set classification technology, solves the problem of mass information classification in modern society, and improves the level of information processing. With the progress of information processing technology, the next step of this paper will focus on the classification of balanced data sets to better meet the actual needs.
Footnotes
Acknowledgments
This work was supported by Natural Science Foundation of Shaanxi Science and Technology Department under grant no.2017ZDXM-GY-114,2018GY-044, 2019GY-075.