
Abstract
Online education has become an important way of learning English at present, and English vocabulary teaching can improve the efficiency of English vocabulary teaching through target visual detection. However, from the existing research, it can be seen that there are still some shortcomings in English vocabulary recognition. In order to improve the English vocabulary recognition effect, based on machine learning recognition technology, this study combines English vocabulary recognition needs of online education to construct an English vocabulary detection model based on convolutional neural network. The model takes the word’s overall feature as the feature extraction principle and adopts the analysis and extraction of the joint segment feature. Moreover, it discards the complicated process of first dividing a single letter and then performing feature extraction and recognition. In addition, this study design example tests to perform algorithm performance analysis. The experimental results show that the proposed algorithm model has certain effects, and it can be used as an auxiliary algorithm for online English vocabulary teaching.
Introduction
Pattern Recognition refers to the automatic identification of things through a computer. Based on the research, a machine system that imitates people’s identification is created to automatically classify things and describe things and imitate people to distinguish between objective things and deal with different kinds of information [1]. In the 1920 s, pattern recognition was first proposed. The initial pattern recognition was limited to recognition in terms of words, license plate numbers, images, etc. Its main function was to enable the machine to automatically classify and discriminate. Then, with the deep understanding and research on pattern recognition, it is found that pattern recognition can also be applied to computers, which makes the intelligent system develop at a high speed.
After more than 30 years of research, optical character recognition technology has brought a huge leap in the digitization of troubled documents. Optical Character Recognition converts texts such as newspapers, books, manuscripts and other printed materials into images by scanning devices, and then extracts the corresponding features of the characters to obtain text information that can be edited by the computer application software [2]. After that, the researchers continued to work hard and developed the image recognition technology and intelligent character recognition technology with the same basic principles, which is referred to as ICR (intelligent character recognition) technology. This technical application area includes meteorological forecasting, image interpretation from satellite, product quality inspection, text recognition, voice recognition, image analysis in analytical medical detection, recognition of human fingerprints, etc. [3]. It has broad application prospects in various industries, and many research institutions and industry players have invested a lot of effort to study this technology. Well-known foreign companies such as IBM, Toshiba, etc., as well as domestic manufacturers such as Tsinghua Unisplendour and Wentong have been engaged in research on this technology.
Aiming at the research direction of English vocabulary recognition, through the continuous efforts of experts and scholars in various fields, various solutions have been proposed, and the research results under their specific requirements have been obtained through experiments and practice. In the English vocabulary recognition system. The most common limitation is that the training and test samples are written by the same person. In addition, there are requirements for normalized character writing requirements or character writing positions, selected pens, and selected papers. For example, the identification of the text of the account requires the character to be written with the specified font [4]. At present, the true unrestricted letter recognition needs further research and improvement.
Character recognition technology involves related technologies of multiple discipline theories, such as artificial intelligence, fuzzy mathematics, formal language, digital image processing and automata, combined mathematics, and in theory, it involves statistical theory and information theory. In addition, it is also related to other disciplines, including linguistics, psychology, and biology. This shows that character recognition technology has gathered knowledge in many disciplines.
Related works
Although the overall processing perspective holds that words are processed and stored in the form of whole words, each word has its own independent entry. However, it is not that morphemes and lexical do not work in them, but that lexical structures and morpheme information can be stored in the processing of vocabulary in some way. Hicham E M [5] explores the development of complex word lexical systems through cross-language research and proposes that lexical features and patterns of words appear as “rules” in the process of characterization of mutually related words. Moreover, different lexical derivatives are processed by a common mechanism, and there is no process of decomposing into stems and affixes. Zayene O [6] uses a sister and sender to make a comparison. They believe that if there is a decomposition of lexical in the recognition of words, a fake word like sender is slower than the real word in response. The reason is that if there is a decomposition, it takes a longer time to go back and process the stems and affixes because of the problem of the constituent rules of the fake words. However, under these two conditions, there was no difference in the reaction. Although the error rate (6.4%) obtained from the judgment of the false word is almost twice the error rate (3.6%) of the true word, the statistical difference is not significant. Based on the results, Manelis and Tharp concluded that all lexical complex words in the mental dictionary are stored and processed in the form of whole words. Shadiev R [7] compares the surface frequency effects and cumulative frequency effects of the root by identifying two types of words with prefixes and suffixes. By comparing the reaction times of these two types of frequencies in judging lexical complex words, we explore whether the lexical structure plays a role in vocabulary recognition. It is concluded that the suffix is affected by the cumulative frequency of the root, but the prefix word is not affected by this frequency. Moreover, when the lexical word associated with the suffix word is a complex word, the response time of the word is significantly faster than the reaction time when the root is presented before the suffix word. Kumar P [8] et al. believe that words with pre-affixes and post-affixes are stored in the mind in the form of whole words, but the lexical structure is affected by the family of words. The root of the word first constitutes the head of the word family, and the recognition of the vocabulary needs to be reached through such a “head”, and then the members of the word family take a search according to the word frequency. There are some differences in the processing of the suffixes. Since the suffixes are in front of the roots and the order of processing is from left to right, the roots are processed first. However, the root of the prefix word does not precede the processing of the whole word, so it will not be affected by the cumulative frequency of the root.
Li S [9] et al. proposed a parallel racing model. They think that when the subject sees each letter string, it will simultaneously decompose the string of letters and search for the whole word. That channel of the vocabulary entry is reached first is successful. They think that words with no lexical relationship, such as kangaroo, are stored and processed by whole words. However, lexical complex words like government need to be broken down into morphemes to process separately. Ch"Ng C K [10] also proposed a two-channel model of “words and rules”. It is believed that there are two models of language processing, one is the associated memory system, and the other is the internal rule system. Pinker believes that the associated memory system dominates the processes that require rote learning, while the internal rules system is more related to rules. Under such a two-channel system, irregular lexical complex words and simple words mainly rely on the associated memory system, while words with lexical rules rely mainly on the processing of the rule system. The lexical structure plays an important role in this process. The two-channel model proposed by Verikas A [11] uses two memory systems, declarative memory and procedural memory, to illustrate the process of word processing. The declarative memory system plays a role in the acquisition, characterization and use of related semantics in the recognition of words and has a relationship with the psychological dictionary. Verikas A believes that the part of the linguistic memory system is mainly in the left hemisphere temporal lobe of the brain. Moreover, the rules of syntax, lexical, etc. in the language of the procedural memory system are mainly located in the frontal ganglion of the left hemisphere. The same is true for irregular words that rely on declarative memory systems, while words with lexical relationships are decomposed using procedural memory. The difference between Verikas A and Pinker’s model is that Ullman’s procedural memory is learned, while Pinker considers its rule system to be innate, and Pinker’s model does not allow interaction between the two systems. Although Noris, Pinker, and Ullman’s two-channel theory have their own characteristics, their interpretation of lexical complex words is based on a theory that lexical complex words with rule changes are based on “blocks”, that is, processed and stored in split morphemes. When the word that needs to be processed or produced is a regularly changing word, such as walked, the mind will analyze the walk and -ed in a timely manner, and then combine to determine whether the word is a real word. The detection idea of the R-CNN model as show in Fig. 1.

The detection idea of the R-CNN model.
Khasnobish A [12] also proposed a two-channel model, but he opposed the theory proposed by these scholars to decompose and process regular words based on “blocks”. He believes that words are different from sentences and phrases, and parts of lexical complex words cannot be stored independently. He believes that the processing of complex words only captures the relevance of the rules in the word, just as walked and walk have a relationship only because walk is the only argument.
The original application of CNN in the field of image detection is the R-CNN (Regions with CNN) model proposed by Yindi D et al. [13] in 2014. The improved model proposed later also basically follows its detection idea.
(1) R-CNN training phase
The training data is based on the internationally published PASCAL VOC2007 dataset. The dataset contains a total of 9,963 natural images, which are divided into 2501 training images, 4952 test images, and 2510 validation set images. The data set includes 20 categories: humans, animals (birds, cats, cattle, dogs, horses, sheep), vehicles (aircraft, bicycles, boats, buses, cars, motorcycles, trains), and indoors (bottles, chairs, dining tables, potted plants, sofas, televisions). The data set information includes an image, a ground-truth (target real area), and its corresponding target category. The R-CNN training phase consists mainly of the following components.
(a) Classification structure in the R-CNN model
The CNN feature extraction network uses the VGG-16 structure.
In Fig. 2, the number of output neurons in the last layer of the VGG-16 is 21, that is, 20 types of targets and a type of background.
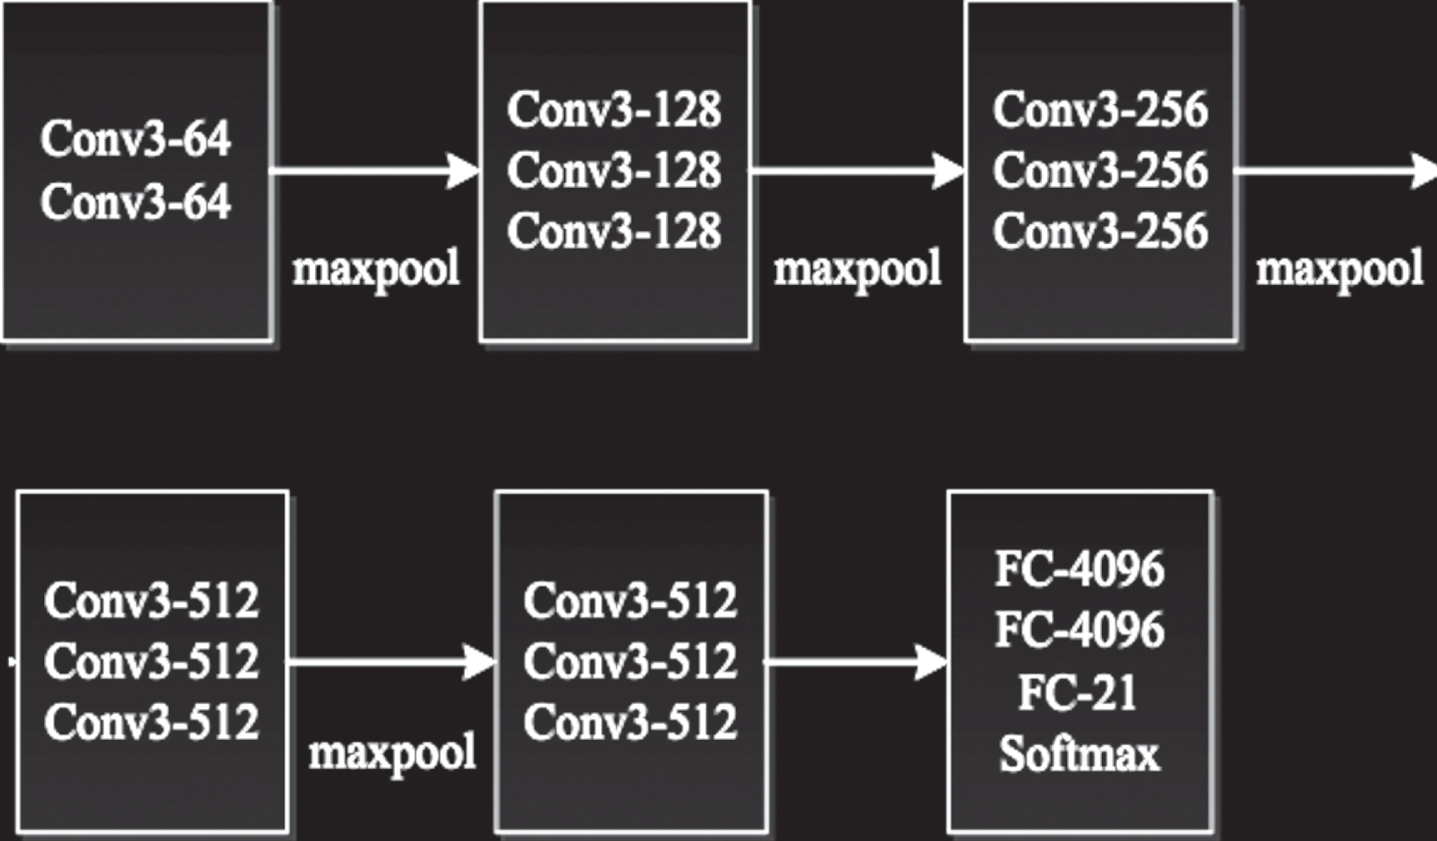
VGG-16 model structure.
(b) Model pre-training
The VGG-16 model is pre-trained with the ILSVRC 2012 dataset, and the basic characteristics of the massive and diverse optical image dataset of ILSVRC 2012 can be learned through pre-training. When the learned parameters are used as the initialization parameters of the fine-tuning network, the problem of insufficient data for specific tasks in deep learning can be solved to some extent.
(c) Fine-tuning the target task
Extracting region proposals for each input image using an image segmentation algorithm (here using the selective-search algorithm), and the overlap rate of each candidate region with the corresponding target real region is calculated (intersection divided by the union). If the overlap ratio is greater than 0.5, the category label corresponding to the target real area of the candidate region is given (that is, a positive sample), otherwise the candidate region is determined as a background (i.e., a negative sample). All candidate areas are scaled or cropped to a fixed size [14]. The network training method still uses the batch random gradient descent algorithm to train the network only with the fixed size region proposals. A batch of samples (minibatch) consists of 32 positive sample region proposals and 96 negative sample region proposals and their corresponding category labels.
(d) Training SVM
The region proposals are input into the trained CNN network for feature extraction, and each candidate region extracts the output features of the first layer of the CNN network, that is, the 4096-dimensional features. The feature is entered into the SVM with the corresponding tag for training [15].
(e) Bounding-box regression
After obtaining the network trained in step c, all the parameters except the fully connected layer of the last layer are fixed. Then, the number of output neurons in the output layer of the last layer is changed to 84.
Only the parameters of the fully connected layer of the last layer need to be learned, and the parameter learning still uses the batch random gradient descent algorithm. The cost function of the bounding-box regression of the R-CNN stage is as follows:
In the formula, m is the number of samples, w is the parameter to be learned, and
In the formula, (G x , G y , G w , G h ) denotes the center of the target’s true position border, x coordinate, center y coordinate and length and width, (P x , P y , P w , P h ) denotes the center x coordinate, center y coordinate and length and width of the candidate area.
(2) R-CNN test phase
The R-CNN model test process is divided into three parts: 1) First, the image segmentation algorithm (generally using the selective-search algorithm) is used to extract region proposals from the input image, and the extracted region proposals are clipped or scaled to the same scale. 2) Each candidate area is input into the CNN network for feature extraction, and the extracted features are input into the trained SVM for classification. If the prediction is a target, it is marked in the original position, that is, the target is detected. 3) The target position is corrected by the bounding-box [16].
Because R-CNN convolves all region proposals of a graph to extract features, the computational redundancy is too large, and the computation is large. Moreover, R-CNN’s training procedures are cumbersome, including: network pre-training, fine-tuning CNN networks, training SVMs, and training frame regression [17]. Based on these two issues, FastR-CNN and Faster R-CNN are proposed on the basis of R-CNN.
(1) Fast R-CNN training phase
The training data still uses the internationally published PASCAL VOC2007 data set. The Fast R-CNN training phase consists of the following components.
(a) Classification structure in the Fast R-CNN model
The VGG-16 structure is used as the feature extraction part of the Fast R-CNN model.
(b) Model pre-training
The VGG-16 model was pre-trained with the ILSVRC 2012 data set.
(c) Fine-tuning the target task
An image segmentation algorithm (here using the selective-search algorithm) is used to extract region proposals for each input image and calculate the overlap ratio of each candidate region to the corresponding target real region (intersection divided by theP union). If the overlap ratio is greater than 0.5, the category label corresponding to the target real area of the candidate region is given (i.e., a positive sample), otherwise the candidate region is determined as a background (i.e., a negative sample). Unlike the R-CNN model, the algorithm does not need to scale or scale all region proposals to a fixed size. The network training method still uses the batch random gradient descent algorithm. The training sample information of the input network includes the input image, the target real region in the image, and the position information (RoIs) of the candidate region. A batch of samples (minibatch) consists of an image, the target real position in the image, the target category label, and the RoIs of the 32 positive sample region proposals and 96 negative sample region proposals generated by the graph.
(2) Fast R-CNN test phase
The Fast R-CNN model test process is divided into two parts: 1) Firstly, the image segmentation algorithm (generally using the selective-search algorithm) extracts region proposals from the input image to obtain RoIs. 2) The image and RoIs are input to the Fast-RCNN model, and the corrected target position information and category information are output [18].
In summary, the improvements of Fast R-CNN (Fig. 3) versus R-CNN are as follows:

Fast-RCNN network.
Reduce redundant operations. Compared with R-CNN, which convolves for each candidate region, Fast R-CNN only convolves each picture once, and then maps the position information corresponding to each candidate area to the feature map of the last layer of convolution output. This change greatly reduces the amount of computation and reduces redundant operations without affecting accuracy.
RoI-pooling RoI-pooling. For the a * a feature map of the last layer of convolutional layer output, the feature map size after RoI-pooling output is given. For the feature map of the last layer of convolutional layer output, the feature size of the RoI-pooling output is n * n, the RoI-pooling window size is ceil (a/n), and the span of the RoI-pooling window is floor (a/n). Then, after an input feature map of any size is given, RoI-pooling can output a fixed-size feature map.
Multitasking loss function [18]. The Fast R-CNN model uses the multitasking loss function to synchronize the classification network with Bounding-box regression. The multitasking loss function simplifies the learning process and improves the detection accuracy.
In the formula, P k * is the probability of correct classification, λ is the artificial setting parameter, and when training Fast R-CNN network, its value is 1. k* is the label of the known sample, and k* ⩾ 1 indicates that the algorithm only performs border regression on the target. t is the target location information predicted by the network, and t* is the location information of the original candidate region.
The improvement of Faster R-CNN compared to Fast R-CNN is that it directly extracts region proposals instead of previous selective-search using a Full Convolution Network RPN (Region Proposal Network) and uses the process of alternating training to make the network more fit to the training samples [19]. Faster R-CNN integrates the two-stage extraction region proposals and CNN detection recognition model into one and implements an end-to-end model for target detection. Therefore, it has greatly improved both in speed and accuracy. The network of Faster R-CNN is mainly divided into two parts: RPN network and Fast R-CNN network. The following describes the training process and testing process of Faster R-CNN.
(1) Faster R-CNN training phase
The training data is based on the internationally published PASCAL VOC2007 data set. The training data information includes images, ground-truth, and its corresponding target category.
The CNN feature extraction network uses the VGG-16 structure. The VGG-16 model is still pre-trained with the ILSVRC 2012 data set and is used as an initialization parameter for the network. The training phase of Faster R-CNN is the alternating training of the RPN network and the Fast R-CNN network.
(a) Training RPN network
Get the anchor boxes. According to the network structure, each pixel point of the feature map of the last output of the feature extraction layer is mapped back to the original image and is mapped back to the original image according to three sizes 128, 256, 512 and three aspect ratios. That is, each pixel in the feature map of the last output of feature extraction obtains 9 regions corresponding to the original image, and all regions mapped back to the original image are anchor boxes.
The obtained anchor boxes are divided into categories. The criteria for dividing anchor boxes into positive samples are: If the overlap ratio of the anchor box to a target real position is greater than 0.7, the anchor box is assigned a category corresponding to the true position of the target. If the overlap ratio between the anchor box and the target real position is greater than 0.7, the real position of the target with the highest overlap rate is taken and the corresponding category of the anchor box is assigned. In the remaining cases, the anchor box is judged as the background [20].
A total of 256 anchor boxes are randomly selected from all the anchor boxes of a picture to form a minibatch, and the number of positive and negative samples is 1:1.
The minibatch is entered into the RPN network training. The RPN network structure is shown in Fig. 4.

RPN network.
The cost function of the RPN network is as follows:
In the formula, g represents the probability that the anchor box i is predicted to be the target. If
The training network method uses a back-propagation algorithm, and the update weight uses a batch random gradient descent algorithm [21]. The network output information is the corrected candidate area location information and category.
(b) Training Fast R-CNN network
The input image and the candidate region location information corrected by the RPN network are input into the Fast R-CNN network for training.
The cost function of the Fast R-CNN network is the same as (3). When training the Fast R-CNN network, the value of λ is 1.
(c) Alternate training
Faster R-CNN uses an alternating training process to make the network more fit to the training samples. The above description is only a process of independently training the RPN network and the Fast R-CNN network. The following is a detailed discussion of the Faster R-CNN alternate training process:
Network weights are initialized with a pre-trained ImageNet model. The input image and the target real area location information are trained on the RPN network. After the RPN network is trained, the RPN network outputs the corrected candidate area location information.
Similarly, the network weights are initialized with a pre-trained ImageNet model. The input image, the target real area location information, and the candidate region location information output by the Step 1 RPN network are input to the Fast R-CNN network for training.
The network layer shared by the RPN network and the Fast R-CNN network is initialized with the model trained in Step 2. The image and target real area location information is entered, and the RPN network is trained, but only the layers that are unique to the RPN network are updated.
The network layer shared by the RPN network and the Fast R-CNN network is also initialized with the model trained in the second step. The input image, the target real area location information, and the candidate region location information output by the Step 3 RPN network are input to the Fast R-CNN network for training, but only the layers unique to the Fast R-CNN network are updated.
(2) Faster R-CNN test phase
The Faster-RCNN network integrates the extraction candidate region portion (RPN network) and identification and position correction (Faster-CNN network) into a network and implements an end-to-end model: An image is input, and the detected target position and category probability information are output, which makes the training and testing of the network very simple.
In the experiment, the detection model adopts Faster R-CNN, and the feature extraction part in the network adopts VGG-16 structure. The training results of the trained model for the two selected scene graphs in the test sample are shown in Figs. 5 and 6 below:

Test result image 1 of Faster R-CNN.

Test result image 1 of Faster R-CNN.
It can be seen from the above figure that Faster R-CNN not only has higher detection accuracy, but also locates the target very accurately.
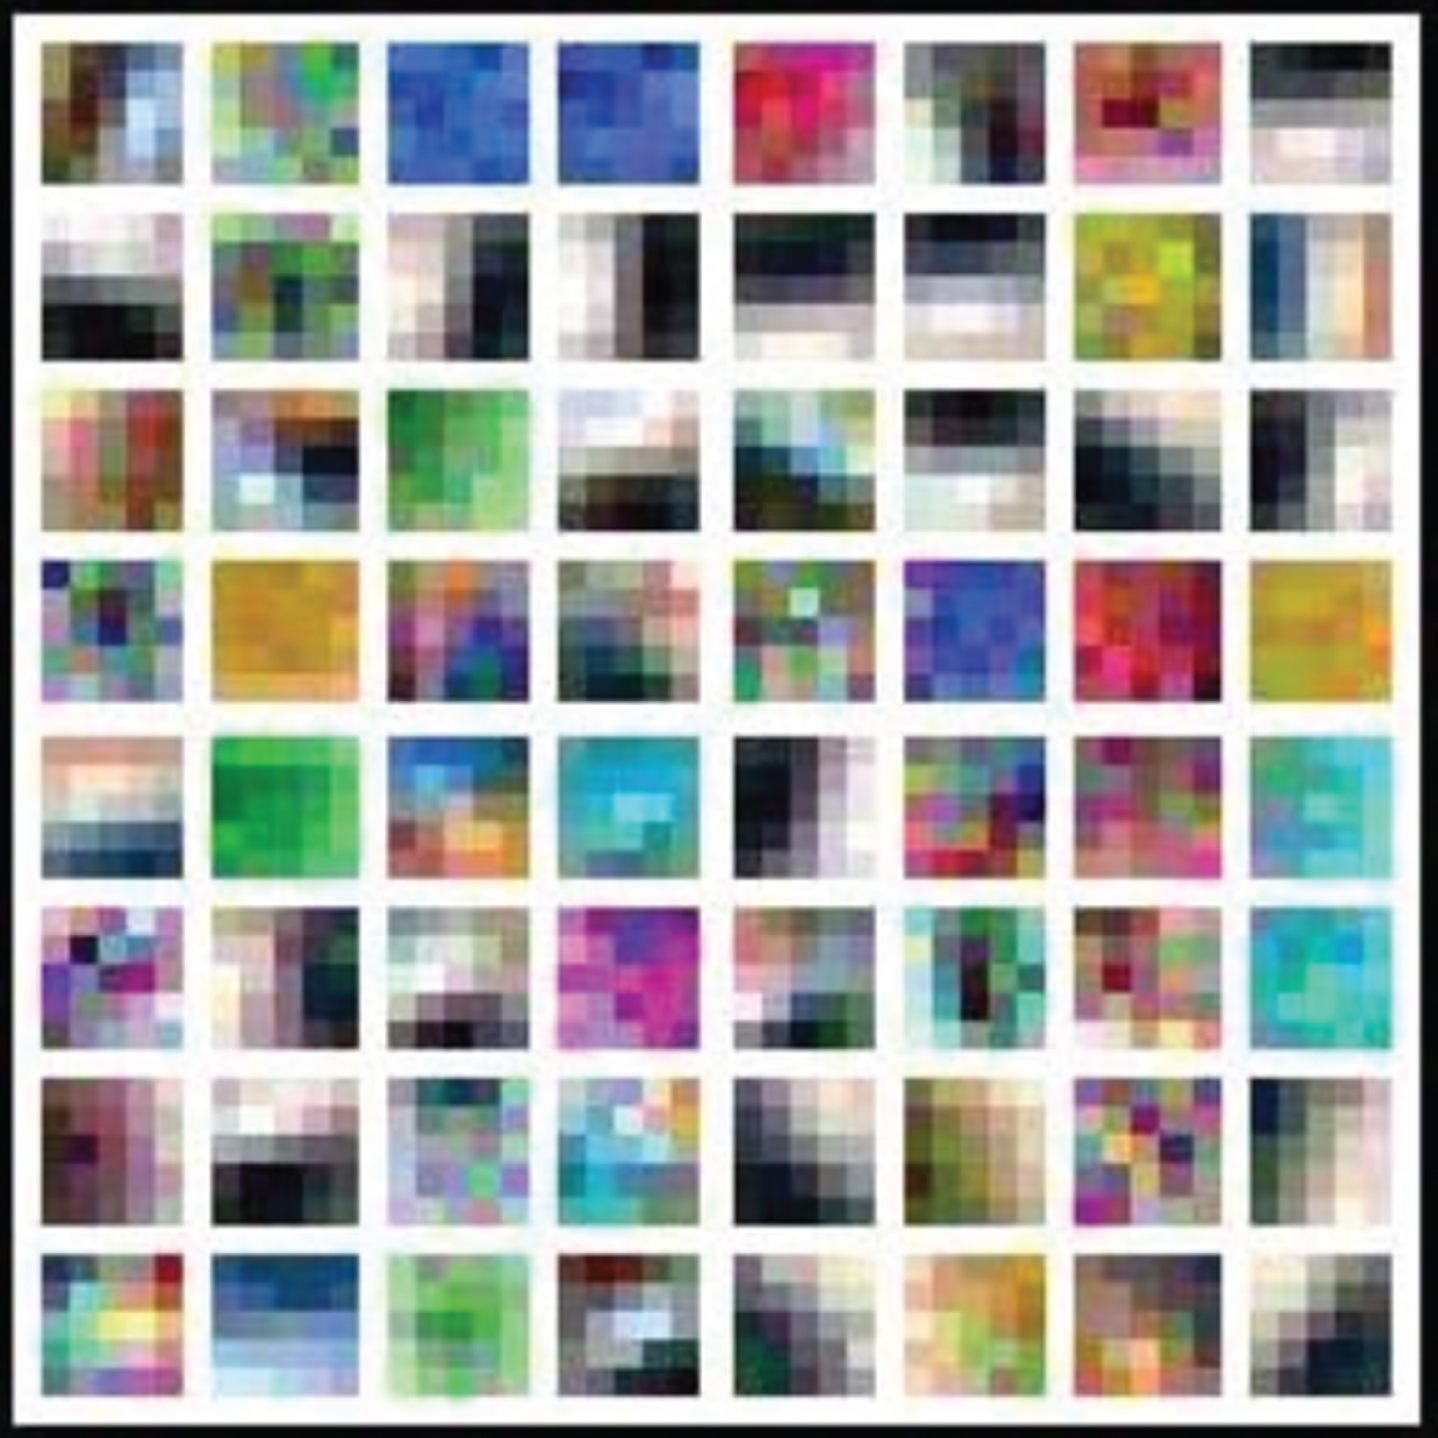
A custom CNN network structure was adopted to train and test the open international data sets STL10(10 types of optical images, 5000 training samples, 8000 test samples), CIFAR10(10 types of optical images, 50000 training samples, 10,000 test samples) and CALTECH101(102 optical images, one type of background, 3060 training samples, 6084 test samples), respectively. The CNN network structure and network parameters used in the experiment are shown in Fig. 7 and Table 1, respectively. The recognition rate obtained by testing the test samples of each data set using the model trained in the experiment is compared with the current state-of-the-art recognition result. Moreover, the first layer of convolution kernels learned by each CNN model in the experiment is shown.

CNN structure used in the experiment.
CNN network parameters used in the experiment
As shown in Table 2, the recognition results of the model trained on the STL10 data is slightly close to the highest international level. The recognition results on the other two data sets CIFAR10 and CAL-TECH101 are quite different from the highest international standards. It shows that a CNN network is not optimal for each type of data, and different network parameter combinations have a great influence on the learning process of the model. Moreover, a CNN structure is often not optimal for different data sets or differently distributed data. The convolution kernel display shown in the CNN model is shown in Figs. 8–10.
Recognition results of CNN model

STL10 convolution kernel display.

CIFAR10 convolution kernel display.
CALTECH101 convolution kernel display.
Through the analysis of the current smart mobile device market, smart mobile devices based on the Android operating system account for more than half of the market share. As more mobile phone and mobile device manufacturers choose to join the base of the Android operating system, Android’s market share is getting higher and higher. For project developers based on Android system development, the good open source of Android operating system provides technical support for R&D, and the application of Android SDK is more and more convenient. The Android SDK is developed mainly by using the development toolkit provided by Google to develop the application. All the components needed in the Android development process are covered in the Android SDK toolkit, which mainly includes four components: Activity component, Service component, Broad Cast Receiver component and Content Provider component. At the same time, Android also provides developers with a comprehensive and comprehensive API reference document. Developers can easily learn Android SDK development by querying API reference documents.
In the research of English word recognition, the purpose of feature extraction experiment is to extract the sample word features to generate sample word feature vectors. The sample word feature vector is trained in the subsequent training and recognition stages, and the word feature vector is stored in the word feature library for word recognition.
The English alphabet recognition is performed according to each combination path of the sub-sequence combination tree, and a plurality of letter strings are obtained as the candidate word recognition results. In addition to searching the dictionary, the combination tree is pruned while the letter recognition is performed, and some illegal word recognition results are eliminated. In order to select the optimal candidate result among the candidate word recognition result sets, a candidate word scoring operation is required.
In the process of feature extraction experiments, there are differences between different handwritten handwritings and similar word features extracted from the same word. Therefore, it is necessary to further analyze the experimental data in the handwritten word sample feature vector and summarize the feature extraction. Taking the different handwritten handwritings of the same word as an example, we select the feature vector data extracted from the feature for reverse analysis, and classify the words after the feature extraction, that is, classify the handwritten sample data that may be the same word.
In English vocabulary teaching, the same word written by different people or the same person will have different writing strokes, and the length, width and deformation degree of the written words will be different, and the features at the same position of the same stroke will be different. However, the main features and directions of the same word have not changed much in general and are generally kept within a certain range. The analysis is mainly performed by the frequency of the eight-way code chain table and the direction value in the direction feature. As shown in Fig. 11, there are four handwritings of different words.

Four different handwriting of the same word.
The direction of the stroke direction and the frequency of the direction value are analyzed, and the frequency bar graph of each word through the direction of the stroke direction and the direction value is summarized and analyzed: 1) The stroke direction curve is used to visually indicate the direction of the same stroke in the four words, and to determine whether the same stroke direction is consistent. 2) The direction value frequency map is used to indicate the frequency at which the direction values in the direction sequence of the same stroke in the four words appear, and is used to describe the distribution of the direction values. As shown in Figs. 12 and 13:
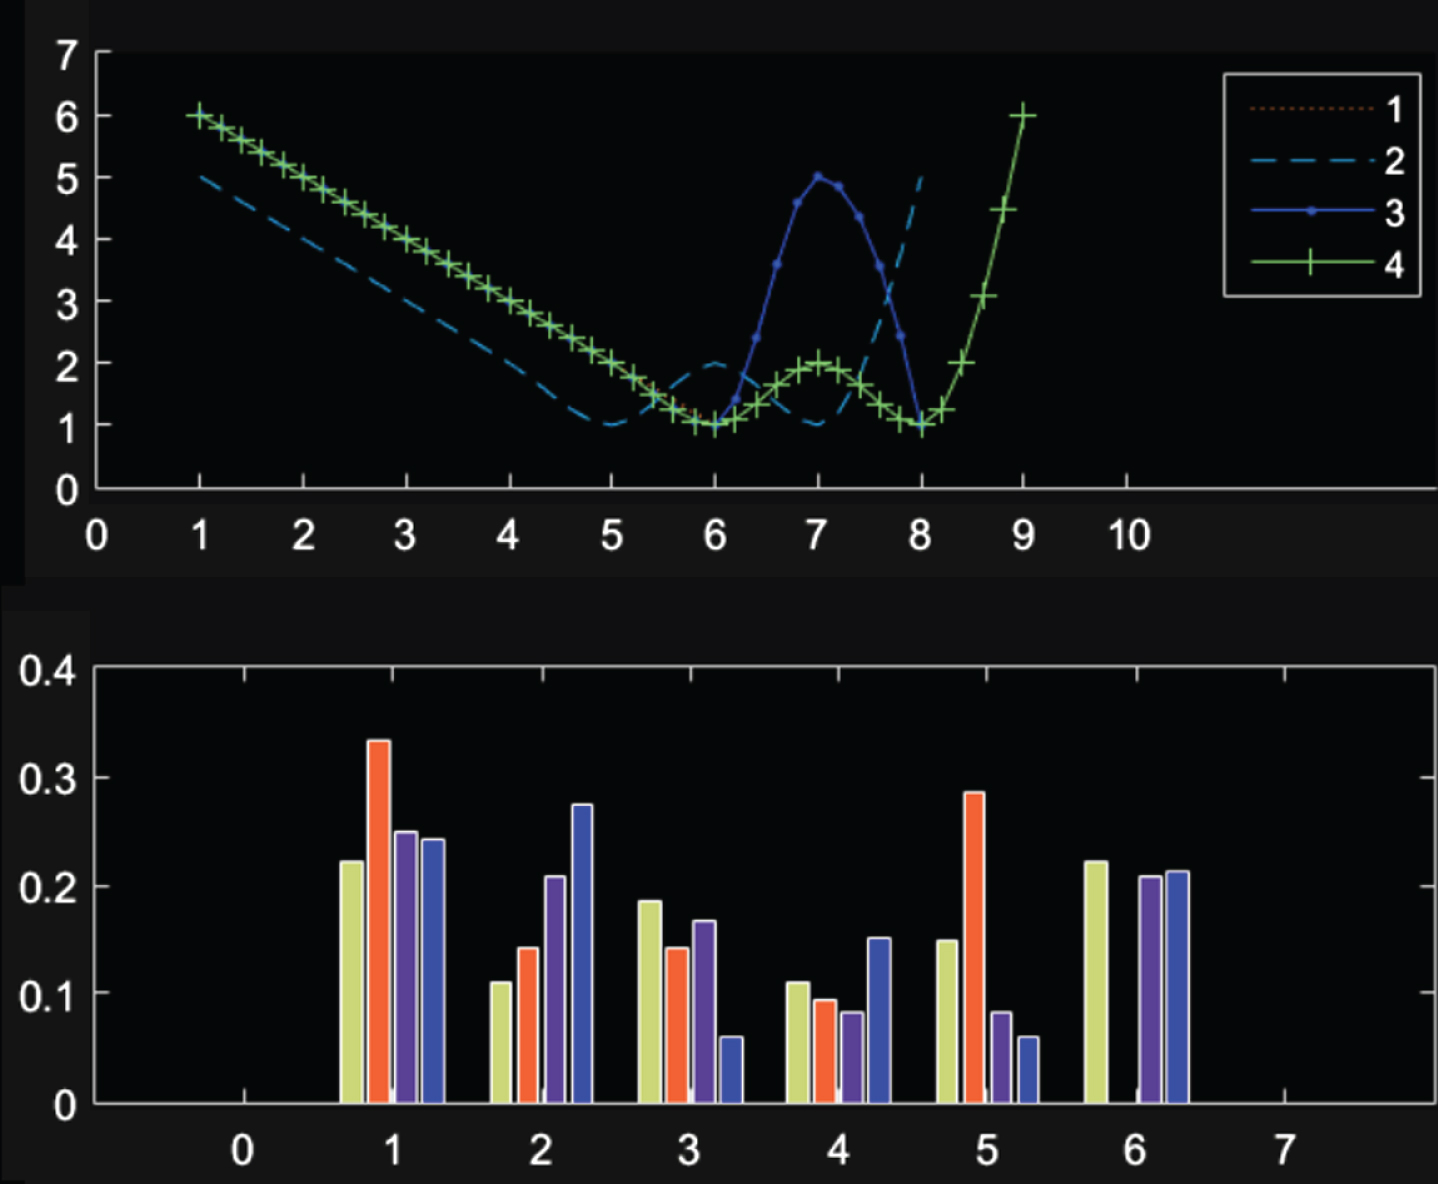
The trend of the direction and the frequency of the direction value of the main stroke.
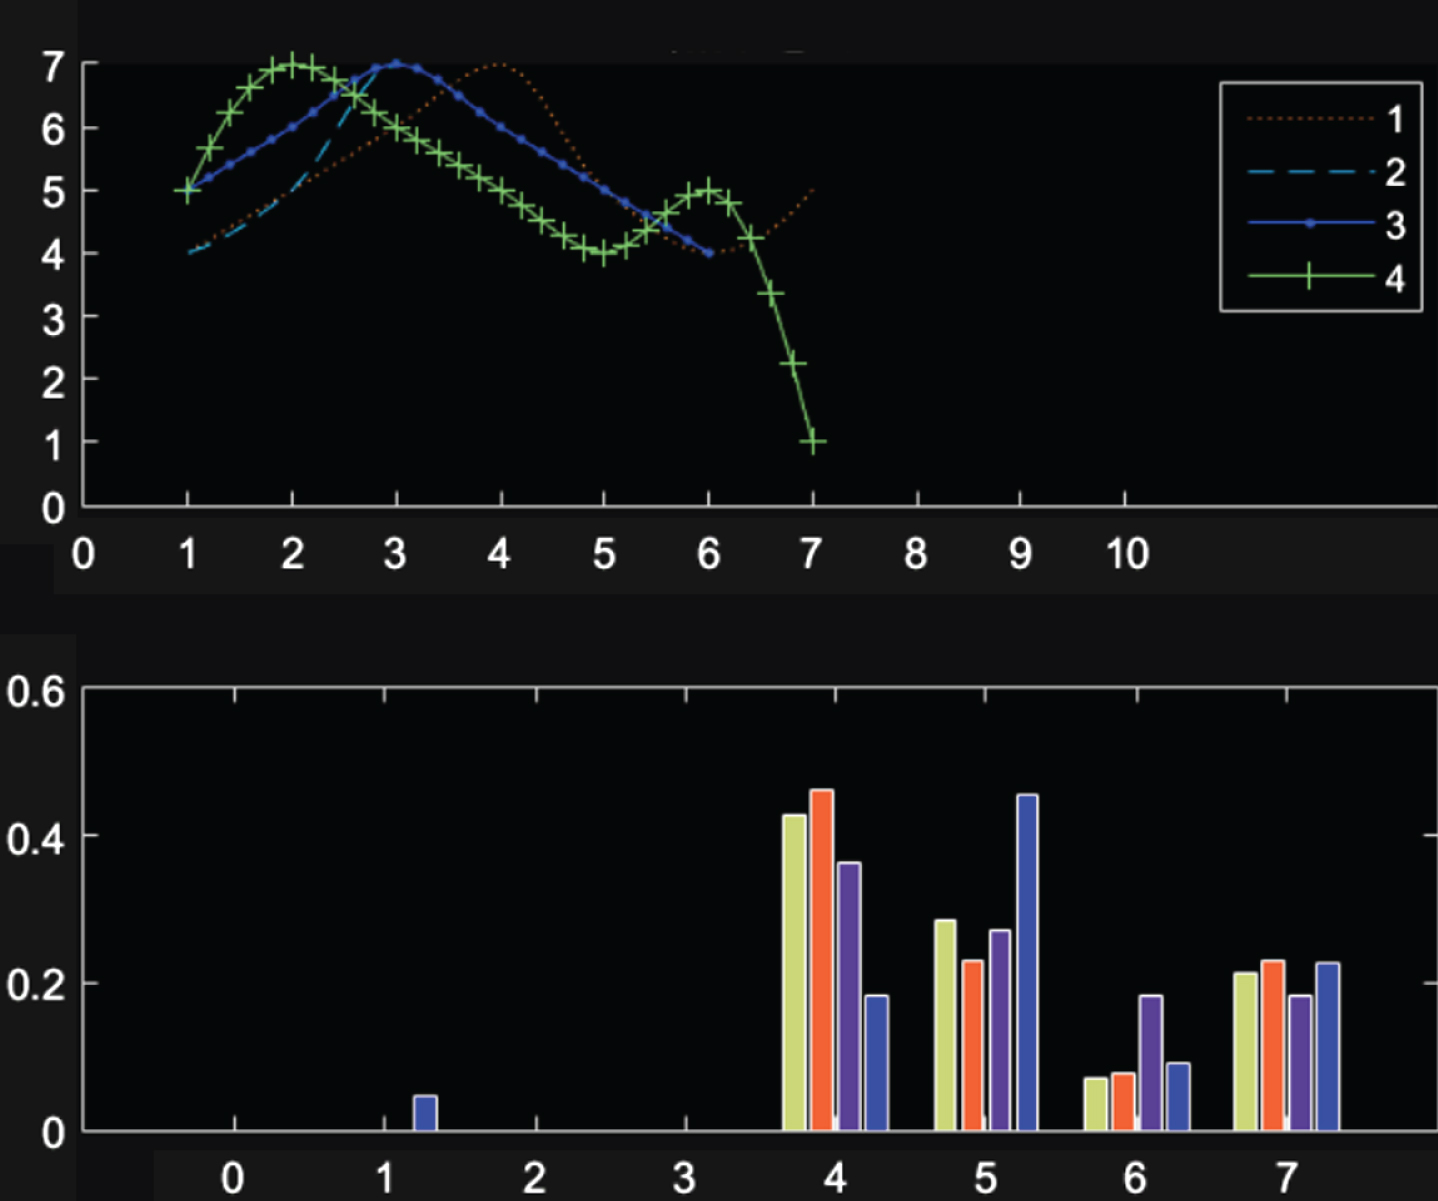
The trend of the direction and the frequency of the direction value of the additional stroke.
It can be seen from Figs. 12 and 13 that the curves of the writing strokes of the same strokes of each of the four words are substantially identical, and the frequency and direction value distribution of the direction values in each stroke are also relatively close. Although the feature vector data differs greatly, but it is kept within a range, it is roughly determined to be the same word. Through this principle, the rough classification of words and feature extraction can be carried out to realize the intelligent recognition of English vocabulary.
In the online teaching of English vocabulary, the core of handwritten word recognition is the extraction of word features. In this paper, the conjoined segment is used as the basic unit of feature selection, and the selection of word features is mainly based on the features of conjoined segments. This study introduces the theoretical basis of feature selection, the summary of conjoined segments and word features, and the implementation of feature extraction for handwritten words. In the study of handwritten word recognition, we use the principle of feature extraction as the feature extraction and is based on the analysis and extraction of connected features. Moreover, we abandon the complex process of single-letter splitting and then feature extraction and recognition, and carry out the feature extraction innovation, focus on the selection and extraction methods of conjoined segments and word features to improve the efficiency of word recognition research. Combining the characteristics of the connected segments, we extract the four aspects of the directional, angular, loop, and additional stroke features of the word. Among them, the angle feature is an auxiliary feature of the directional feature, and the combination of the loop feature and the additional stroke feature constitutes a feature vector. In order to improve the accuracy of recognition, in the subsequent research, it is necessary to continue to select new features for extraction, and to select feature extraction methods that can improve the recognition rate of similar words.
Footnotes
Acknowledgments
This paper was Supported by “the Fundamental Research Funds for the Central Universities” (2019MS151).