
Abstract
With the continuous development of science and technology, computer-aided teaching has become a common mode of school teaching. From the current situation, it can be seen that the current computer-aided teaching mostly replaces the traditional teaching mode with multimedia, and does not play the role of functional teaching, and teachers cannot effectively grasp the students’ psychological thoughts in teaching. Based on this, this study combines machine learning prediction and artificial intelligence KNN algorithm to actual teaching. Moreover, this study collects video and instructional images for student feature behavior recognition, and distinguishes individual features from group feature recognition, and can detect student expression recognition in detail. In addition, this study designed a case study to analyze the performance of the algorithm. From the experimental results, it can be seen that the proposed algorithm has certain effects and can be used as an algorithm to assist the teaching process and can provide theoretical reference for subsequent related research.
Keywords
Introduction
In recent years, the rapid development of information technology and mobile communication technology has caused many changes in people’s lives and learning. In particular, the collision of science and technology and education has injected fresh blood into the reform and development of future education. The theme of the 18th China Education Information Innovation and Development Forum is “Integration Innovation. Intelligent Leading” [1], and it explores the new educational ecology of the Internet 2.0 era. Under the Internet-based education network environment, a personalized teaching model based on online learning came into being. This model not only allows students to personalize their learning, but also is not limited by geography, time and space. At the same time, it liberated the teachers, and made the education and teaching work no longer constrained by the traditional classroom teaching, fully respected the students’ personality development, and fully responded to the call for education reform. Internet + education [2] has changed the traditional education model, and the way students learn has shifted from traditional offline learning to online learning supported by the Internet. According to data provided by CNNIC (China Internet Network Information Center), as of December 2018, the number of online Internet education users in China reached 201 million, and compared with the end of 2017, the number of users increased by 46.05 million, and the annual growth rate was 29.7%. At the same time, the government also attaches great importance to Internet education. In his 2019 government work report, Premier Li Keqiang pointed out that the government should develop fairer and more quality education, while emphasizing the development of “Internet+education” and promoting the sharing of quality resources. In the “New Generation Artificial Intelligence Development Plan” issued by the State Council, smart education was also proposed. It is planned to develop a smart campus and develop a three-dimensional comprehensive teaching field and an online learning education platform. Therefore, the development of online education systems has a strong practical significance.
In the current era of informatization, technologies such as big data, Internet of Things, and artificial intelligence have penetrated into every aspect of people’s lives, and the future will help us solve many practical problems. The era of artificial intelligence is not an era in which only a simple workforce can survive in society. The foundation and core of these high-tech is programming, which will become a must-have skill for people. Therefore, the importance of learning programming is self-evident [3]. Apple CEO Cook once said that learning programming is more important than learning English. Nowadays, programming education has gradually become popular. There are many contents in programming, not only the grammar of language, but also the way of logical thinking, which is of great help to people’s thinking.
In the context of “Internet+education”, new teaching modes such as micro-curriculum, MOOC, and flip-up classrooms have developed rapidly, which has brought about great changes in the teaching methods and organizational forms of teachers. In contrast, the drawbacks of the traditional teaching model are also increasingly revealed. The traditional classroom teaching has the drawbacks of pattern and singularity. It is easy to neglect the autonomy of students’ learning. It is basically a teacher-speaking, student-listening, full-filled teaching method, and the teaching resources are scattered and cannot be fully shared [4]. Moreover, the classroom lacks a feedback mechanism, and students and teachers cannot communicate in time. Teachers only teach the curriculum knowledge stipulated in the teaching tasks, and there is not enough time and energy to expand the relevant knowledge. In addition, using only classroom time may result in students not being able to accurately grasp the knowledge of the professor. Therefore, the various deficiencies in classroom teaching have seriously affected the presentation of teaching effects [5].
It can be seen that in order to meet the individualized learning needs of students, it is a general trend to build a school network personalized teaching system as a supplement and extension of classroom teaching.
Related work
In recent years, information technology has developed rapidly, and online learning systems have developed rapidly. As a pioneer in online learning systems, the United States has proposed the Open Course Ware program represented by the Massachusetts Institute of Technology [6]. By the end of 2006, thousands of courses had been uploaded to the Internet for network sharing. It integrates the development characteristics of new and old education, provides more and better learning resources for students all over the world, and brings a good start for the new teaching mode combining network technology and education and teaching [7]. So far, the UK has been the first country to apply computers to education and teaching. More than 2,000 computer-based teaching aids have been developed [8]. Among them, the most widely used is the Web Course Tools platform with the curriculum management function and resource management function developed by the Department of Computer Science of the University of British Columbia. It can carry out real-time online live broadcast of teachers and students, and the interaction between teachers and students is extremely strong, which makes up for the maximum status of non-interaction between teachers and students [9].
Sakai is a curriculum management system (CMS) development program initiated by the Indiana University, the University of Michigan, Stanford University, the Massachusetts Institute of Technology, and the University of Berkeley in the spirit of free use, free development, and freedom of education [10]. The Sakai program aims to develop an open network collaboration and learning system based on online learning and combines the teaching aids and components of major schools to finally establish a new network teaching platform suitable for school teaching [11]. Moodle [12] is an open source course management system (CMS) developed on the basis of constructivist theory. As a learning management system, Moodle is the most widely used in various countries and schools and is the most widely used online open source learning platform in the world [13]. In addition to the common functions similar to other systems, it also has special features, and the platform is still being improved [14]. Blackboard [15] is a digital teaching platform created by the United States under the development of modern pedagogy, using modern technology and traditional educational technology. Compared with all major platforms, the platform provides teachers and students with a more powerful curriculum management module. Each course is designed with different functions to meet the various learning needs of different students, which promotes the enthusiasm and initiative of students to learn online to the greatest extent [16]. The “Blackboard” platform provides a more effective and convenient way for teacher teaching, student learning, and teacher-student interaction through a variety of functional modules.
Relatively speaking, although domestic online teaching started late, it has developed rapidly and spread rapidly. The earliest researched online teaching platform in China is the “4A Network Teaching Platform”, which has become popular in China. Its emergence has also opened a new chapter for the development of education and teaching in China [17]. For the first time, the “4A Network Teaching Platform” organically integrates educational teaching resources with online platforms and creates a new environment for teaching and learning for teachers and students and strengthens the interaction between teachers and students. The 4A platform is mainly divided into four subsystems: teaching support system, educational management system, curriculum collaborative development tool system, and teaching resource management system. At that time, the design concept of the system was more advanced, the module was clear, and the function was complete [18]. So far, China’s most mature online teaching platform is Tsinghua Education Online (THEOL) established by Tsinghua University. From the perspective of respecting the individual needs of students, THEOL platform breaks through the shackles of traditional education and teaching, integrates the characteristics of teachers’ teaching and students’ learning characteristics, combines informatized teaching mode and modern educational concept to establish a network platform that meets their own needs, and cultivates students’ lifelong learning [19]. However, on the other hand, the THEOL platform lacks a corresponding curriculum evaluation system. At the same time, because it only pursues efficient teaching, there are still some drawbacks. The “Vclass” network education platform [20] developed by the Institute of Modern Educational Technology of Beijing Normal University is an interactive platform for teacher-student distance learning based on multimedia communication. Based on Beijing University’s own rich disciplinary resources, teachers use the Internet technology to conduct two-way remote lectures for curriculum standards, and simultaneously realize the sharing of curriculum resources, and solve various problems such as lack of interaction in traditional classroom teaching [21].
Probability density estimation
If we assume that an m-dimensional space R m is given arbitrarily, and the n sample points existing in the space are respectively x i , i = 1, 2, ⋯ , n, we can define the basic form of the mean offset vector of these sample points as:
In the formula, s h can be regarded as a high-dimensional sphere area, and the radius of the high-dimensional sphere is h. Moreover, in this area, there is the following formula.
When the point x is the reference point, the offset vector of the sample points x i relative to the reference point is(x i - x). The meaning of the vector M h (x) is: the average of the sample point offset vector sum, and the offset vector is the distance between the k number of sample points and the distance x.
As shown in Fig. 1, we assume that the largest circle lock coverage in the figure is s h , and the small open circle in the big circle represents the sample point x i ∈ s h falling in the region of the high position, and the solid circle at the center is the reference point x of the mean offset vector, and the arrow pointing from the reference point to the sample point indicates the mean shift of the sample point with reference point x as the reference point. The average of the offset vector M h (x) is the gradient direction of the probability density function.
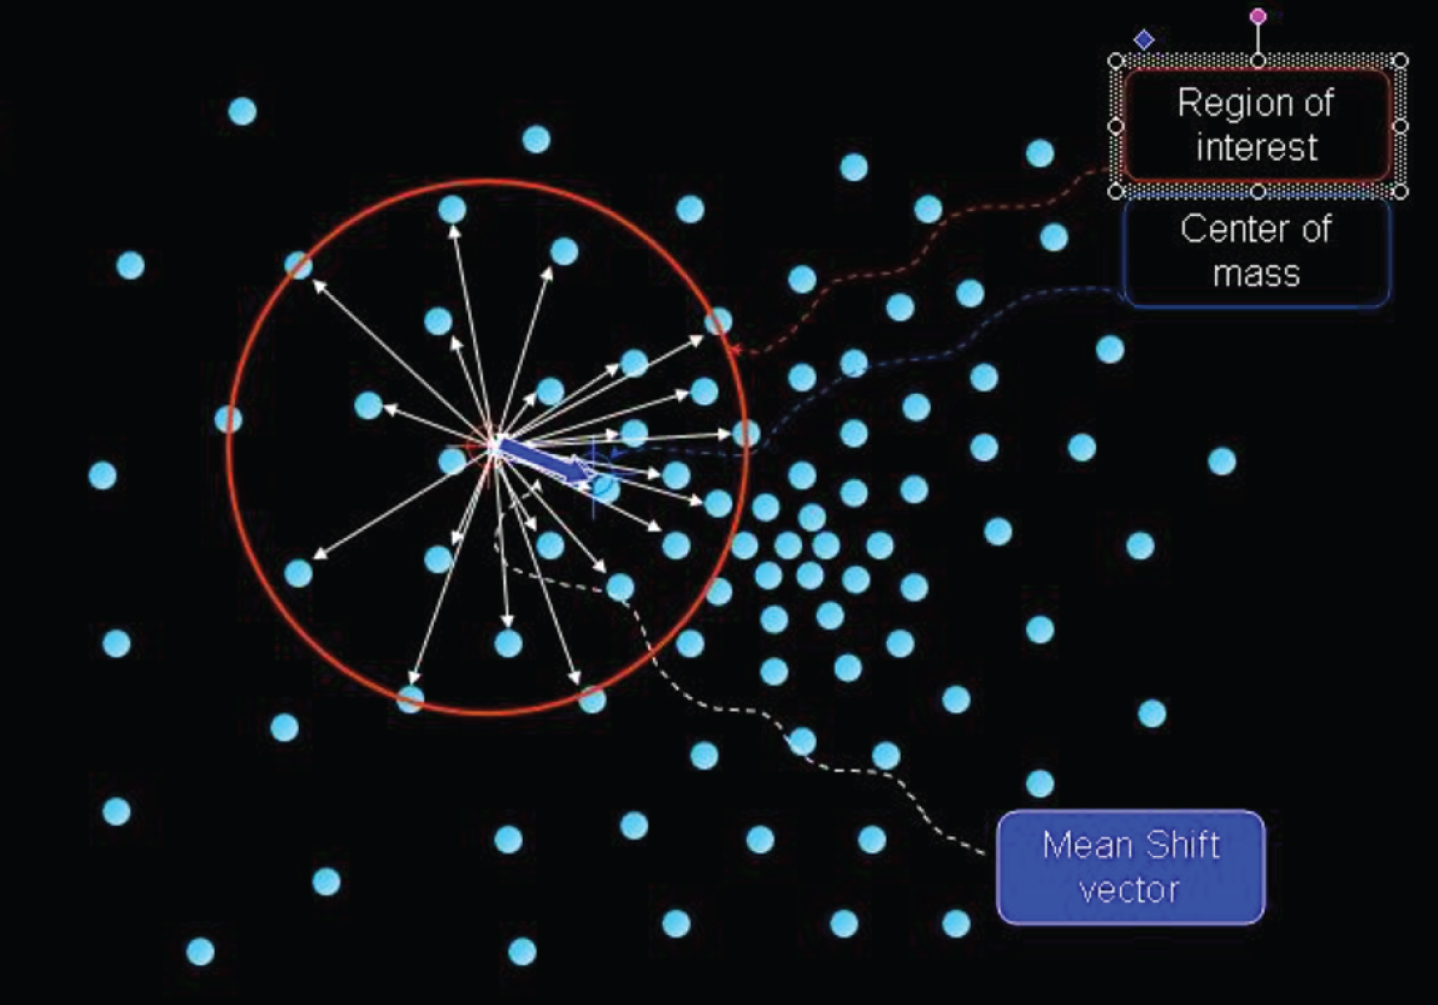
Schematic diagram of MeanShift.
First, a kernel function definition, X represents a d-dimensional Euclidean space, and x is a point in the space. This point can be represented by a column vector, ∥x ∥ 2 = x T x, and the meaning of R is a real number field. We assume that if there is a function, when K : X → R, a section function can be found, the range is K : [0, ∞] → R, that is,
Moreover, in this function, the following relationship is satisfied: K is non-negative K is non-increasing, that is, if a < b, k (a) ⩾ k (b). K is segmentally continuous, and. Then, we can think the function K (x) as a kernel function.
Target tracking
Next, we will use the graphical method to visually explain the basic idea of the mean shift tracking algorithm to achieve tracking, as shown in Fig. 2:

Schematic diagram of the tracking algorithm.
In this picture, we define the first data point of the target tracking to be
(1) Target tracking description
When tracking the target, we first manually mark the initial frame and determine the tracking area. We assume that there are a total of n pixels in the tracked area, and {Z i } , i = 1, ⋯ , n is used to represent the position of each pixel. The selected area can then be evenly divided to obtain a corresponding grayscale color space and obtain m number grayscale histograms.
We assume that the probability density(u = 1, ⋯ , m) corresponding to q u of the target model can be expressed as:
In the above formula, the meaning of each parameter is shown in Table 1:
Parameter Meaning
(2) Candidate model description
If it is now at the time of the t-th frame, in order to determine the center position of the search window, we first determine the center position of the target image at the time of the t - 1-th frame, and determine this center position as the center position of the window when we search, so that we get the coordinates of the center position corresponding to the candidate target. Through the center position corresponding to the candidate target, we can calculate the region histogram corresponding to the candidate target in the frame image at the current t time. In this region, if the included pixels are represented by {Z i } , i = 1, ⋯ , n, the probability density corresponding to our candidate model can be expressed as:
The meaning of H is the window size of the kernel function that determines the distribution of weights.
(3) Similarity measure
In this method, the function of the similarity function is to characterize the degree of similarity between the candidate target and the objective function. In the experimental process of this paper, the Bhattacharyya coefficient is used as a function to calculate the similarity between the candidate target and the objective function:
It can be seen from this function that the higher the similarity between the candidate target and the objective function, the larger the function value. To obtain the position coordinates of the target in the current frame, the center position corresponding to the tracking target in the previous frame may be used as the center position of the window to be searched, and then the candidate target region that maximizes the similarity function value may be searched for in the current frame. The target area searched for is the target coordinates we are looking for.
(4) MeanShift iterative process
The central idea of the mean shift algorithm: the iterative process of mean shift (MeanShift) is also the process of finding the target position by the above similarity function. The process of finding the target position is to find the coordinate that makes the above similarity function obtain the maximum value. We will perform the Taylor series expansion on the above formula. Then, the approximate expression of the Bhattacharyya coefficient is as follows:
The first term in the above equation is unchanged, and only the second term changes with f. Observing the above formula, we can find that the maximization process of obtaining the similarity function can be realized directly by means of the iterative manner of the central coordinate of the candidate region to the central coordinate corresponding to the real region:
In the formula, g (x) = - k (x). In other words, the MeanShift method starts with the f k center coordinate and then continually compares the two models and then selects the direction in which the color change is most apparent. When a certain moving distance is less than a preset threshold, the center position is considered to be the real coordinate of the current frame. In order to find the position of the next frame, we start the search window center with the position coordinates found in this frame, and iteratively find the target coordinates of each frame.
In the tracking results (as shown in Figs. 3 and 4), we can get the weight of each pixel in the square graph.
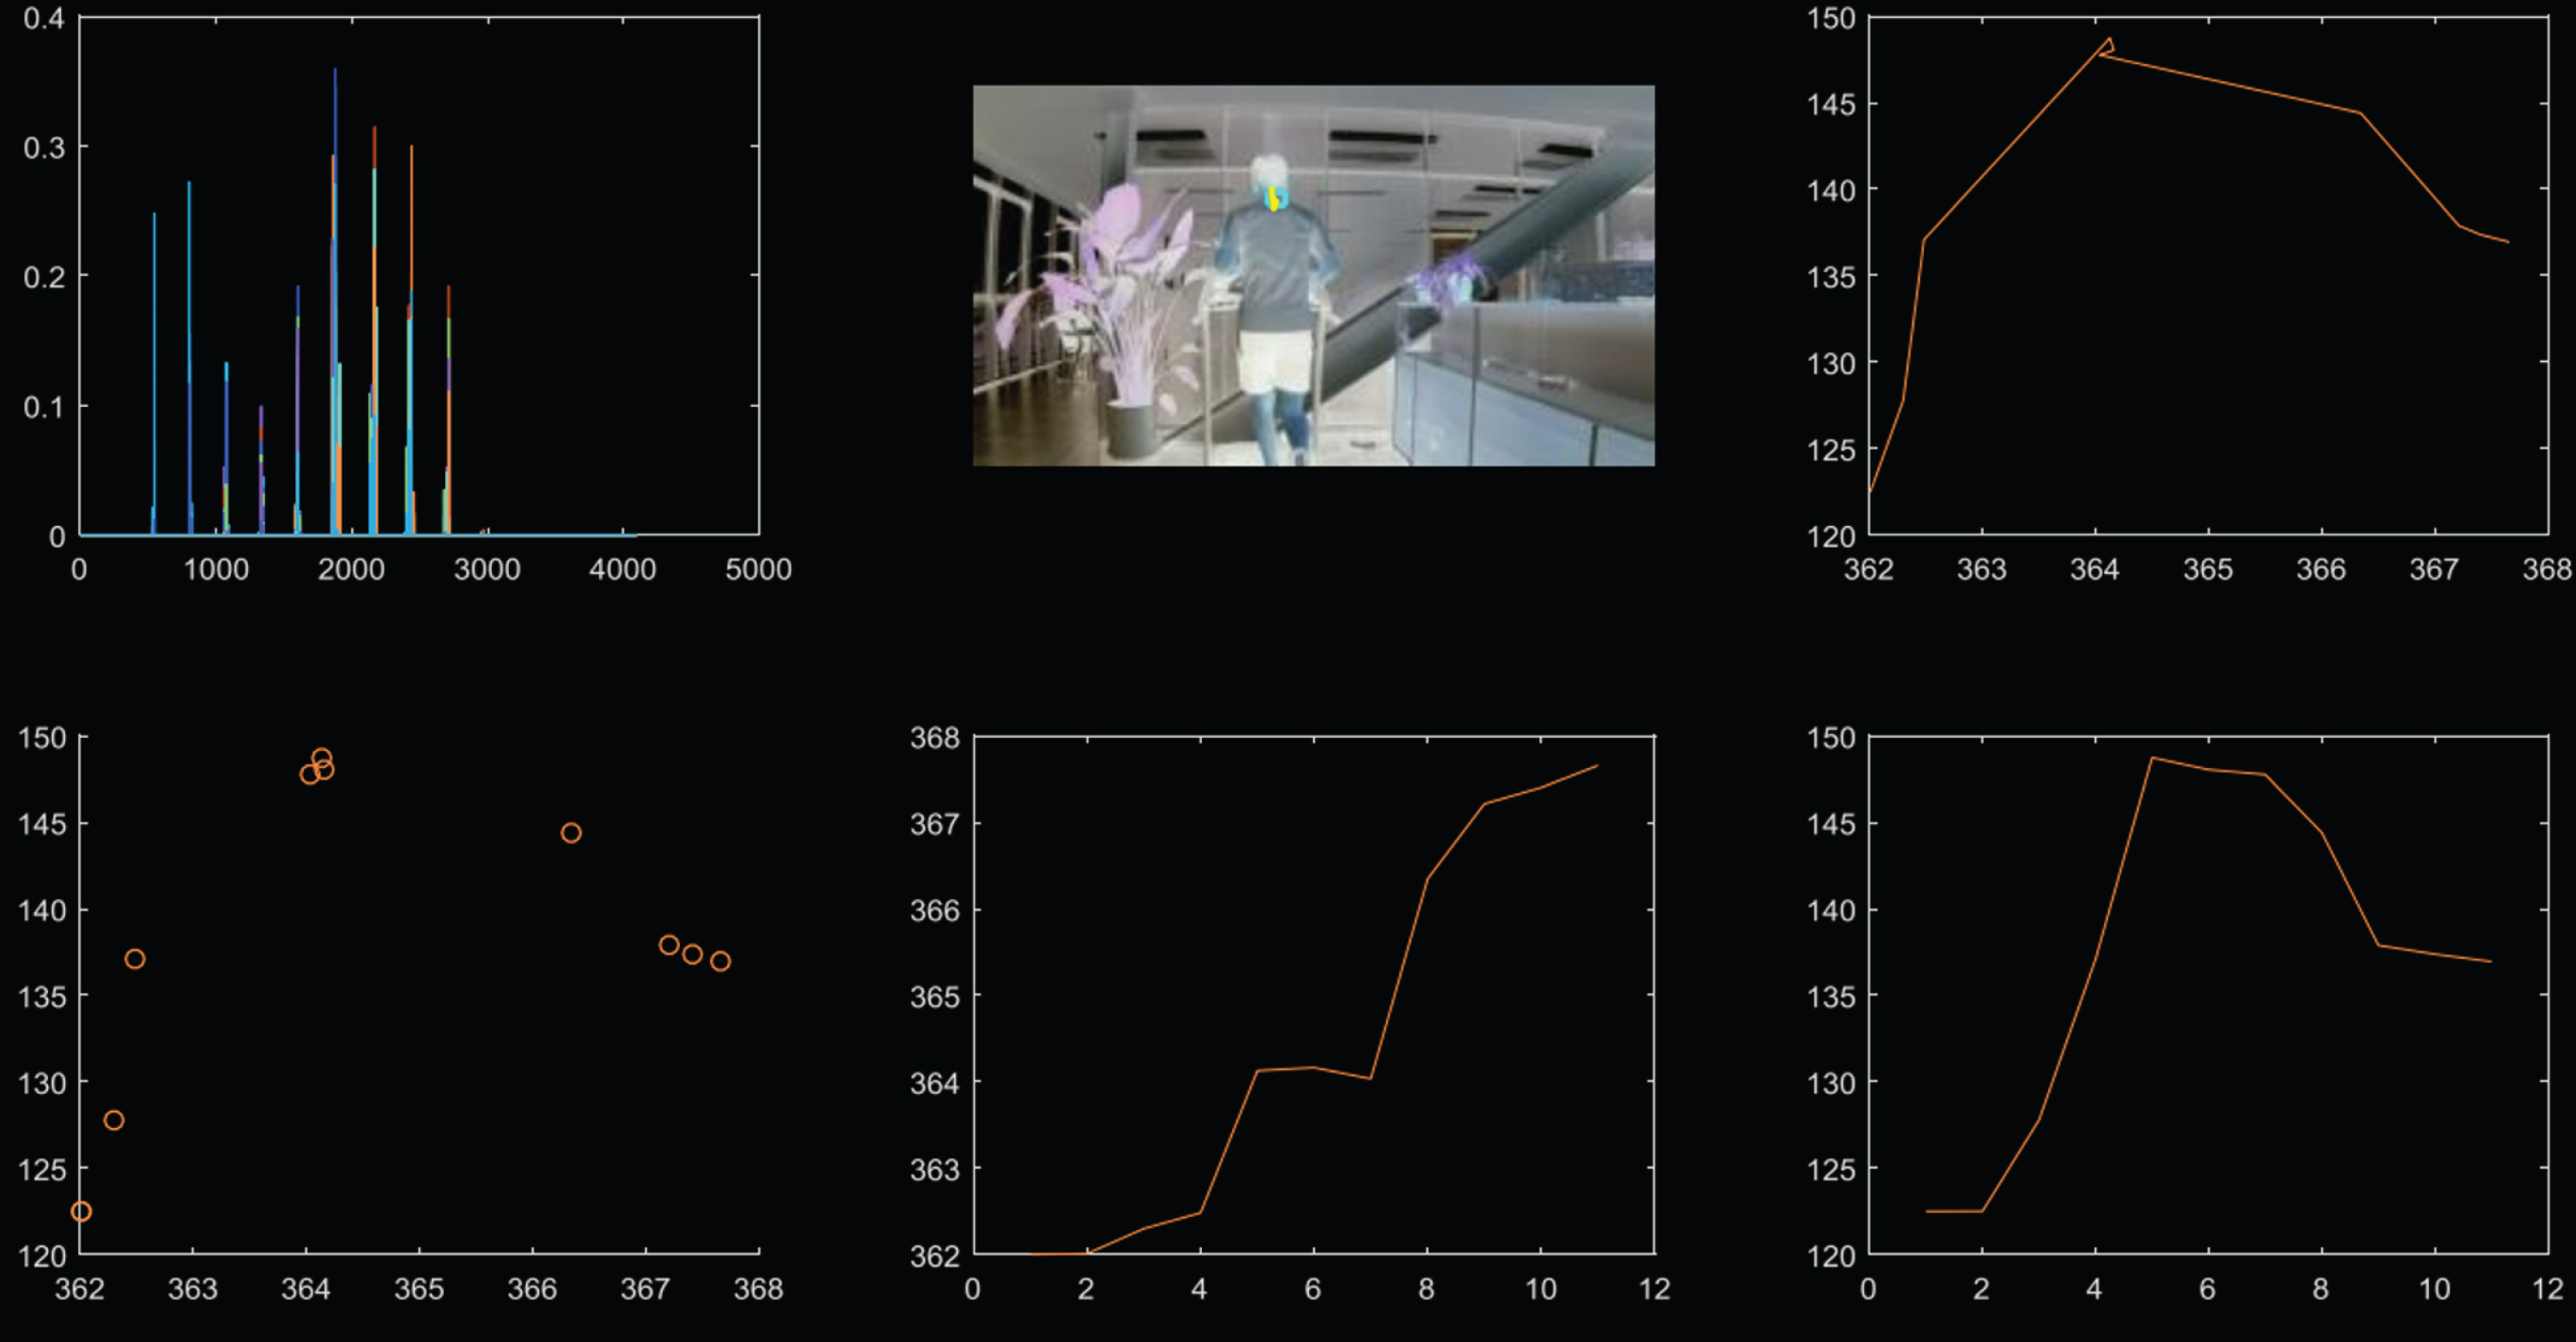
Neck position tracking.
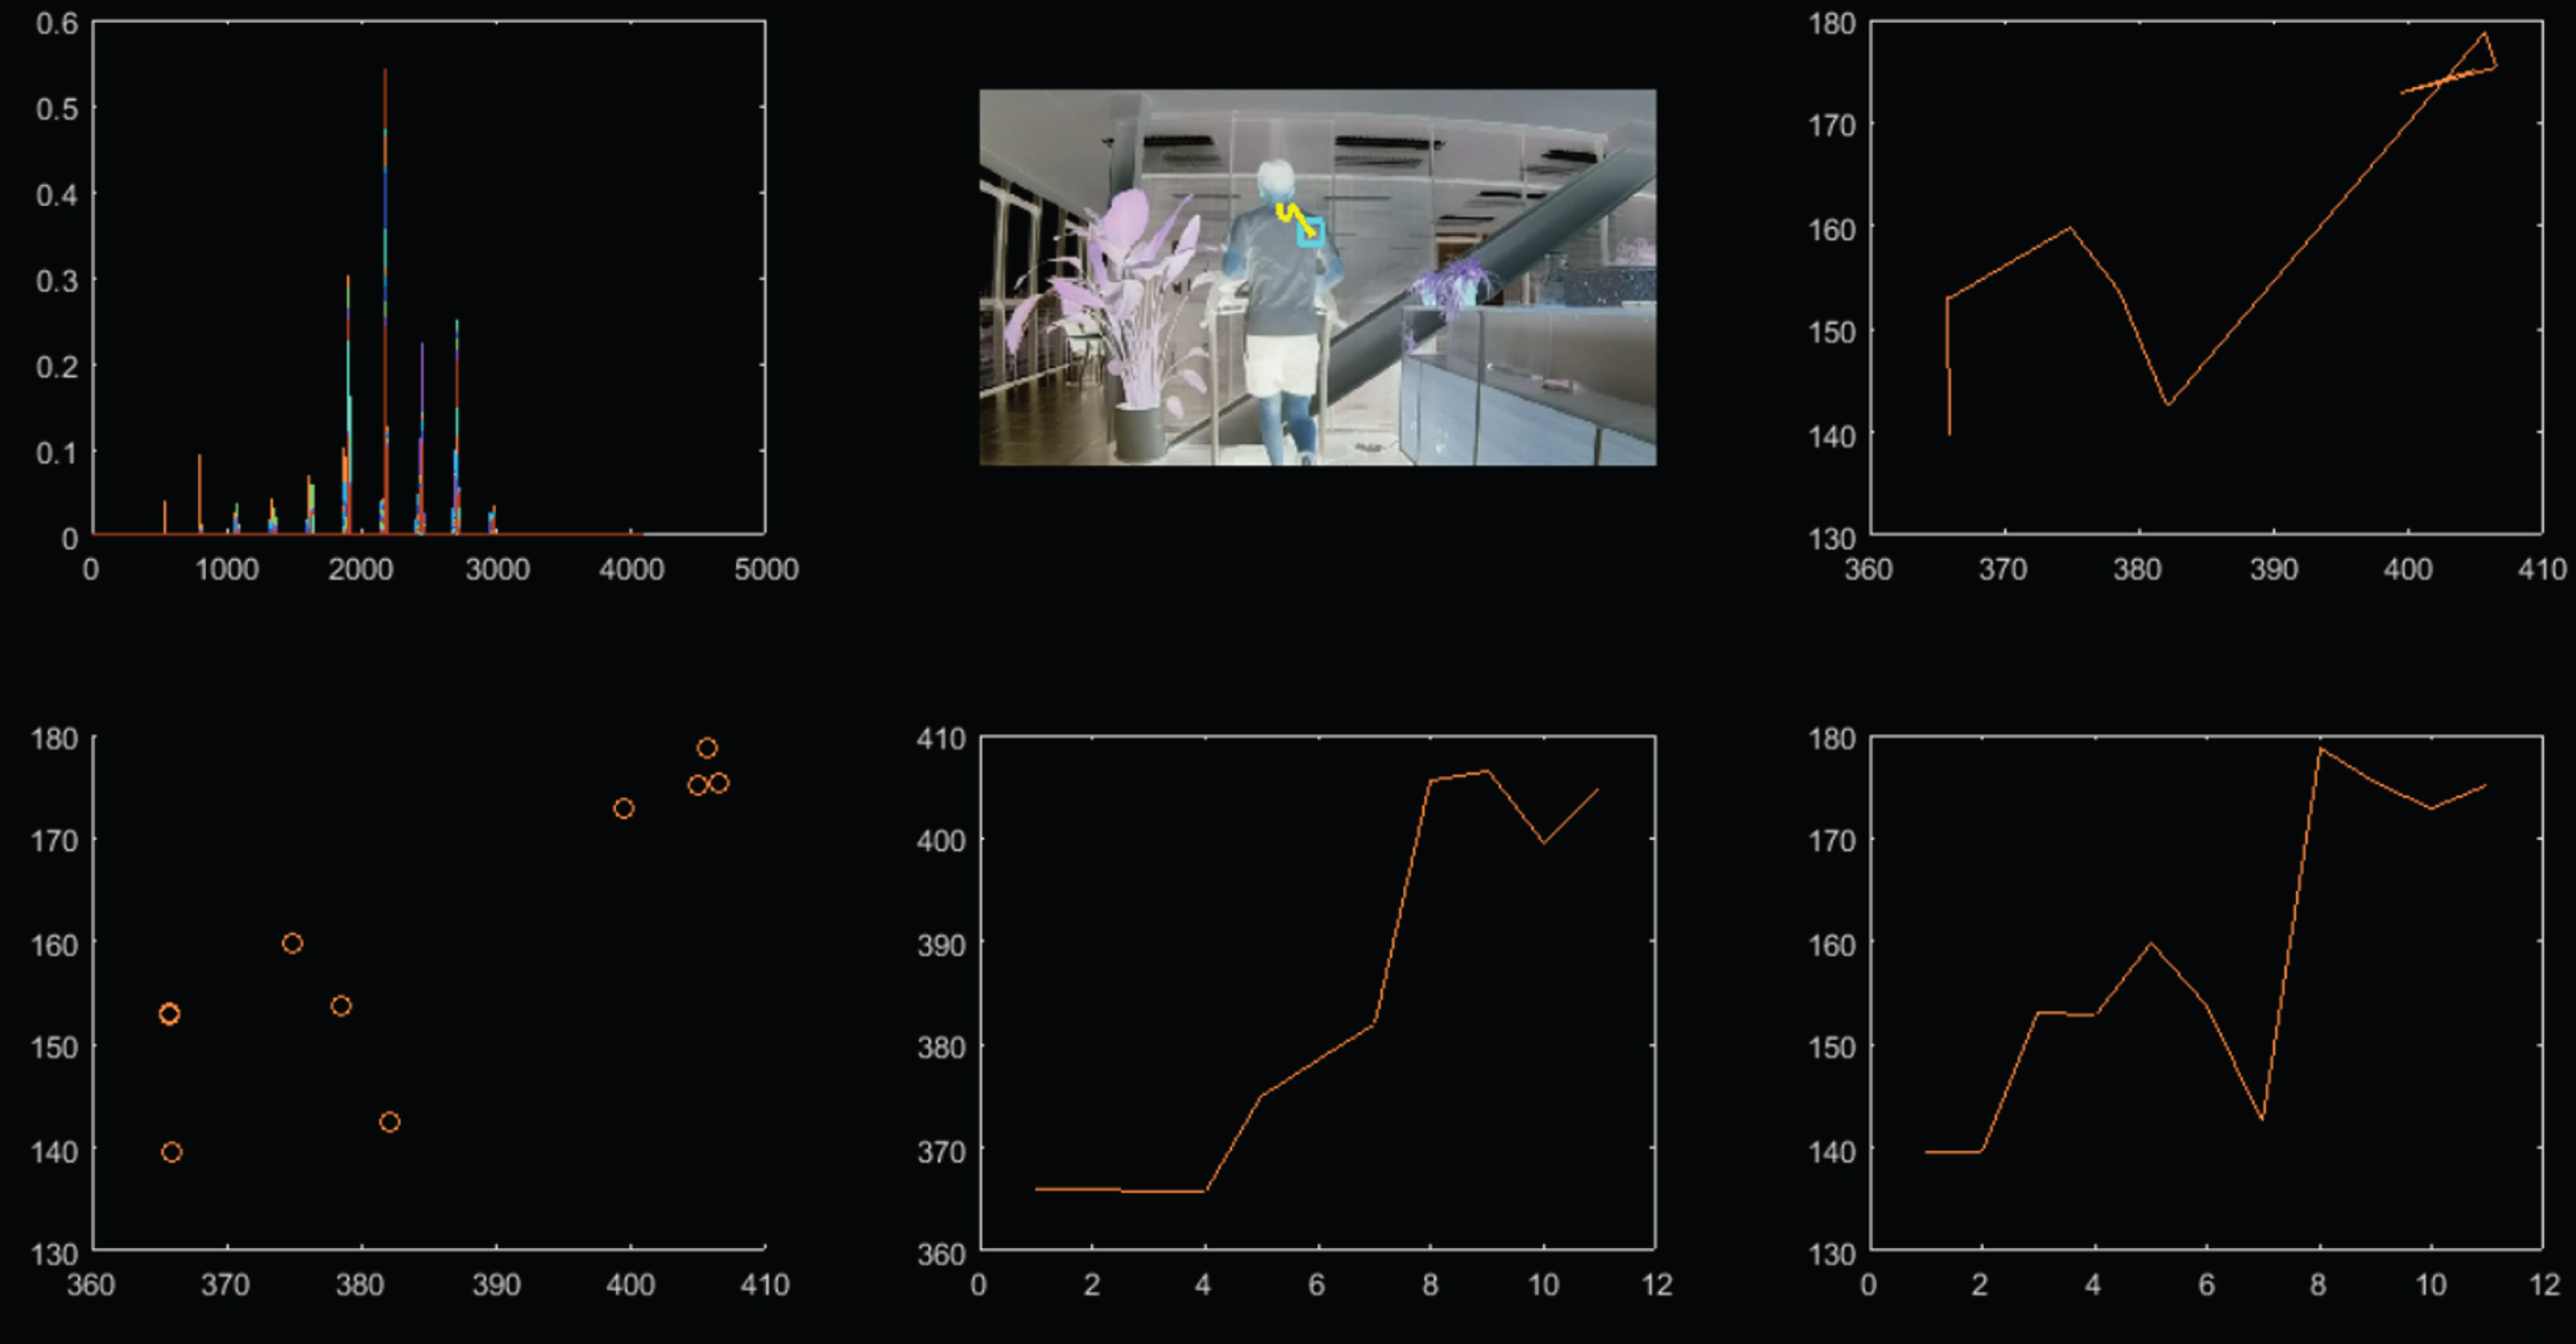
Back position tracking.
In a movement cycle, the process is included: the left foot heel is lifted → the left foot is off the ground → the left foot is on the back side of the body → the left foot is in the middle position → the left foot is on the front side of the body → left foot heel on the ground → left foot toe on the ground According to the law of change, the image sequence is filtered, and 10 frames are selected to fully represent the position change in a motion cycle.
The position analysis of the 10 frames was performed using the MeanShift algorithm, and the back side was taken to shoot the video for testing. The results are as follows:
Selecting the neck as the tracking point: Selecting the back as the tracking point:
We tracked two different areas separately. The above two figures show that the tracking effect of the MeanShift algorithm is not very good, and the tracking point jump occurs during the tracking process. Since the running behavior on the treadmill is limited by space and the running behavior change during running is performed within a certain spatial range, there is a deviation in the motion trajectory of the object acquired when the MeanShift algorithm is used for behavior tracking.
The currently used recognition algorithms include three types: Method based on template matching; Method based on statistical probability; Method based on grammar
(1) Template matching method
The implementation process of the template matching method is as follows:
Before identifying the sample to be tested, the image sequence is converted into a shape model that can be compared to a known sample template. When identifying the sample to be tested, the shape model converted by the above step is compared with the behavior sample template of the known category, and the similarity between the behavior sample template of each category and the sample to be tested is calculated, and the similarity is compared. The category of the sample template with the highest similarity is taken as the final recognition result of the sample to be tested. The computational complexity of the template matching method is relatively low and easy to implement, but the shortcoming of this method is that the static shape template cannot reflect the speed factor of the motion behavior.
The dynamic programming algorithm first decomposes the overall process into multiple stages, and then optimizes the stages. In the process of implementation, the eigenvalues of the test samples at each moment can match all the eigenvalues in the template. The purpose of matching is to find the template with the smallest matching distance. The dynamic programming algorithm needs to be calculated in a certain order in the calculation, that is, the path optimization and matching problem of searching the sample to be tested and the known template. In general, during the dynamic programming algorithm experiment, a test sample needs to be matched with several known templates, and then the template with the smallest matching distance is selected. It is difficult to combine the characteristics of multiple known templates to obtain the most typical template. In addition, dynamic programming is less robust and is susceptible to noise, and when the sample data is large, the amount of computation is large.
(2) Statement-based approach
The statement-based approach is primarily applied to finite state machines. This method has been used in many ways, such as modeling the ordered sequence of gesture spaces. However, the algorithm has some shortcomings. 1. The states of the statement-based method are artificially defined. This state is not as scientifically reliable as the state learned from the training samples, and the sample distribution law cannot be accurately presented. Therefore, this method is not accurate when encountering a dynamic system. 2. The stability of the statement-based method is relatively low. The implementation of the state transition of the method depends on the state transition model, and the system variables of the model are the observed values of the dynamic system at various moments. As long as an error occurs, the recognition result will be wrong, so the method is applied less.
(3) Probability and statistics method
Probability statistics also have a number of state space methods. The core of the method is to calculate the probability, and the specific steps are: 1. Each static gesture is seen as a state. 2. The behavior sequence is regarded as a traversal process. The content of the traversal is a different state, that is, different static gestures. These states are connected together by a certain probability to form a sequence of behaviors. 3. The joint probability between states in the traversal process is calculated, and the result of the classification is determined by the maximum value of the joint probability.
HMM is a commonly used model in behavior analysis. The most widely used and most successful field is the field of speech recognition. Hidden Markov models can effectively process time-varying signals, which can correct time and provide recognition and learning mechanisms.
The dynamic Bayesian network is a statistical model that has developed rapidly in recent years. This model is based on the probability map model, which combines time information and static Bayesian networks to form a unique stochastic model with time series. The stochastic model has obvious advantages when processing time series. The dynamic Bayesian model consists of two parts, (1) the initial network; (2) the transfer network.
KNN based recognition
Time series features
The design of the classifier needs to be designed according to the eigenvalues required in the experimental process combined with the parameters of the motion model. The relevant motion data extracted in this paper is a time series of observation point positions, that is, a set of one-dimensional and time-varying signals. Then, our design goals can be transformed into specific classification decision problems for time-varying feature data.
The following selects the moving object to analyze the video taken at the back angle. From the back angle, the left and right swing of the object during the movement process is mainly observed. In the standard running posture, the left and right swing amplitude deviation of the moving object is small. If the left side is larger or the right side is larger, it means that the moving object is biased to one side during running. In the long run, it is easy to cause damage to the knee joint of one leg and bring sports injury. In the one-dimensional time-varying signal, we can find that the different motion cycles (This article defines the period from the first landing of the left foot to the second landing as a motion cycle) of the same moving object and the motion of different objects have different motion curves through the motion curve. The following is a comparison of the curves of the three cycles of the same moving object and the curves of the same posture of three different moving objects (Figs. 5 and 6).

Three cycle trajectories of the same object.

The same motion track of three objects.
Through a lot of experimental test analysis, we can get the following rules: The curve and amplitude of an experimental object during different periods of motion are close. During the exercise, the running posture of each moving object is free and random, so the curve will not be completely consistent. Therefore, there are deviations and the difference in amplitude is unavoidable, but the waveforms of the curves are all close. The amplitude deviation of the waveform between different moving objects is large, and the waveform difference is also large. However, due to the randomness of the exercise posture, the same waveform will occur. By analyzing the above two cases, we can conclude that the comparison similarity between the test object curve waveform and the sample curve waveform in the graph can be used as a reference method for the classifier design. If the curve result graph of the test object coincides with the curve of the sample or the coincident portion accounts for most of the phenomenon, we can think that the two waveforms are similar, that is, the test sample belongs to the class.
The K Nearest Neighbor (KNN) algorithm, in a more mature classification algorithm, is more and more widely used in machine learning. The central idea of the K-nearest neighbor algorithm is: firstly, a certain number of correctly classified samples are used as standard reference samples, and the distance between the sample to be tested and all standard reference samples in the feature space is calculated, and then a k value is determined. This k value is the number of standard reference samples selected that are closest to the test sample in a particular feature space. Finally, it is judged which of the k standard reference samples has the largest number of samples, and then this category is used as the classification category of the sample to be tested through the KNN algorithm. This classification method only needs to obtain the nearest neighbor sample category to determine the category to which the sample to be tested belongs.
The K-nearest neighbor algorithm is relatively simple to implement and can be classified without training. In the process of implementing the algorithm, it is very important to establish an effective feature vector. Adding a feature vector to N-dimensional means that the feature vector is composed of N eigenvalues.
Eleven samples were selected for the design of the classifier. The 11 samples consisted of two types, which were represented by triangles and squares, of which 5 were triangular samples and 6 were square samples. The 11 samples are distributed as shown below:
If we want to determine which type of green circle in the figure belongs to, K = 3 is chosen. Since the proportion of the red triangle is 2/3, the green circle belongs to the red triangle. If g is selected, the green circle belongs to the square because the proportion of the blue square is 3/5.
In Matlab’s pattern recognition toolbox, various classification and recognition algorithms are included, such as KNN, BP, SVM, etc. The function for KNN algorithm is knnclassify, and its function call form is as follows:
In the function, the distance matrix form, such as the Euclidean distance, the sum of absolute differences, the angular distance, the correlation distance, the Hamming distance, etc., are allowed to be set. At the same time, in this function, selecting the method of the sample classification is allowed, including the most recent K maximum number principle, the random maximum number principle, and the voting. The KNN function in the toolbox provides more convenience for the experiment.
Test analysis
The system framework of the system is shown in Fig. 9. The basic parameters configuration and control of the classroom behavior intelligent image recognition and analysis system can be completed through the human-computer interaction interface, such as configuration of the host network, audio, video, subtitle, display mode, switching effects, camera control and other parameters.

Sample distribution map.

Classification principle.
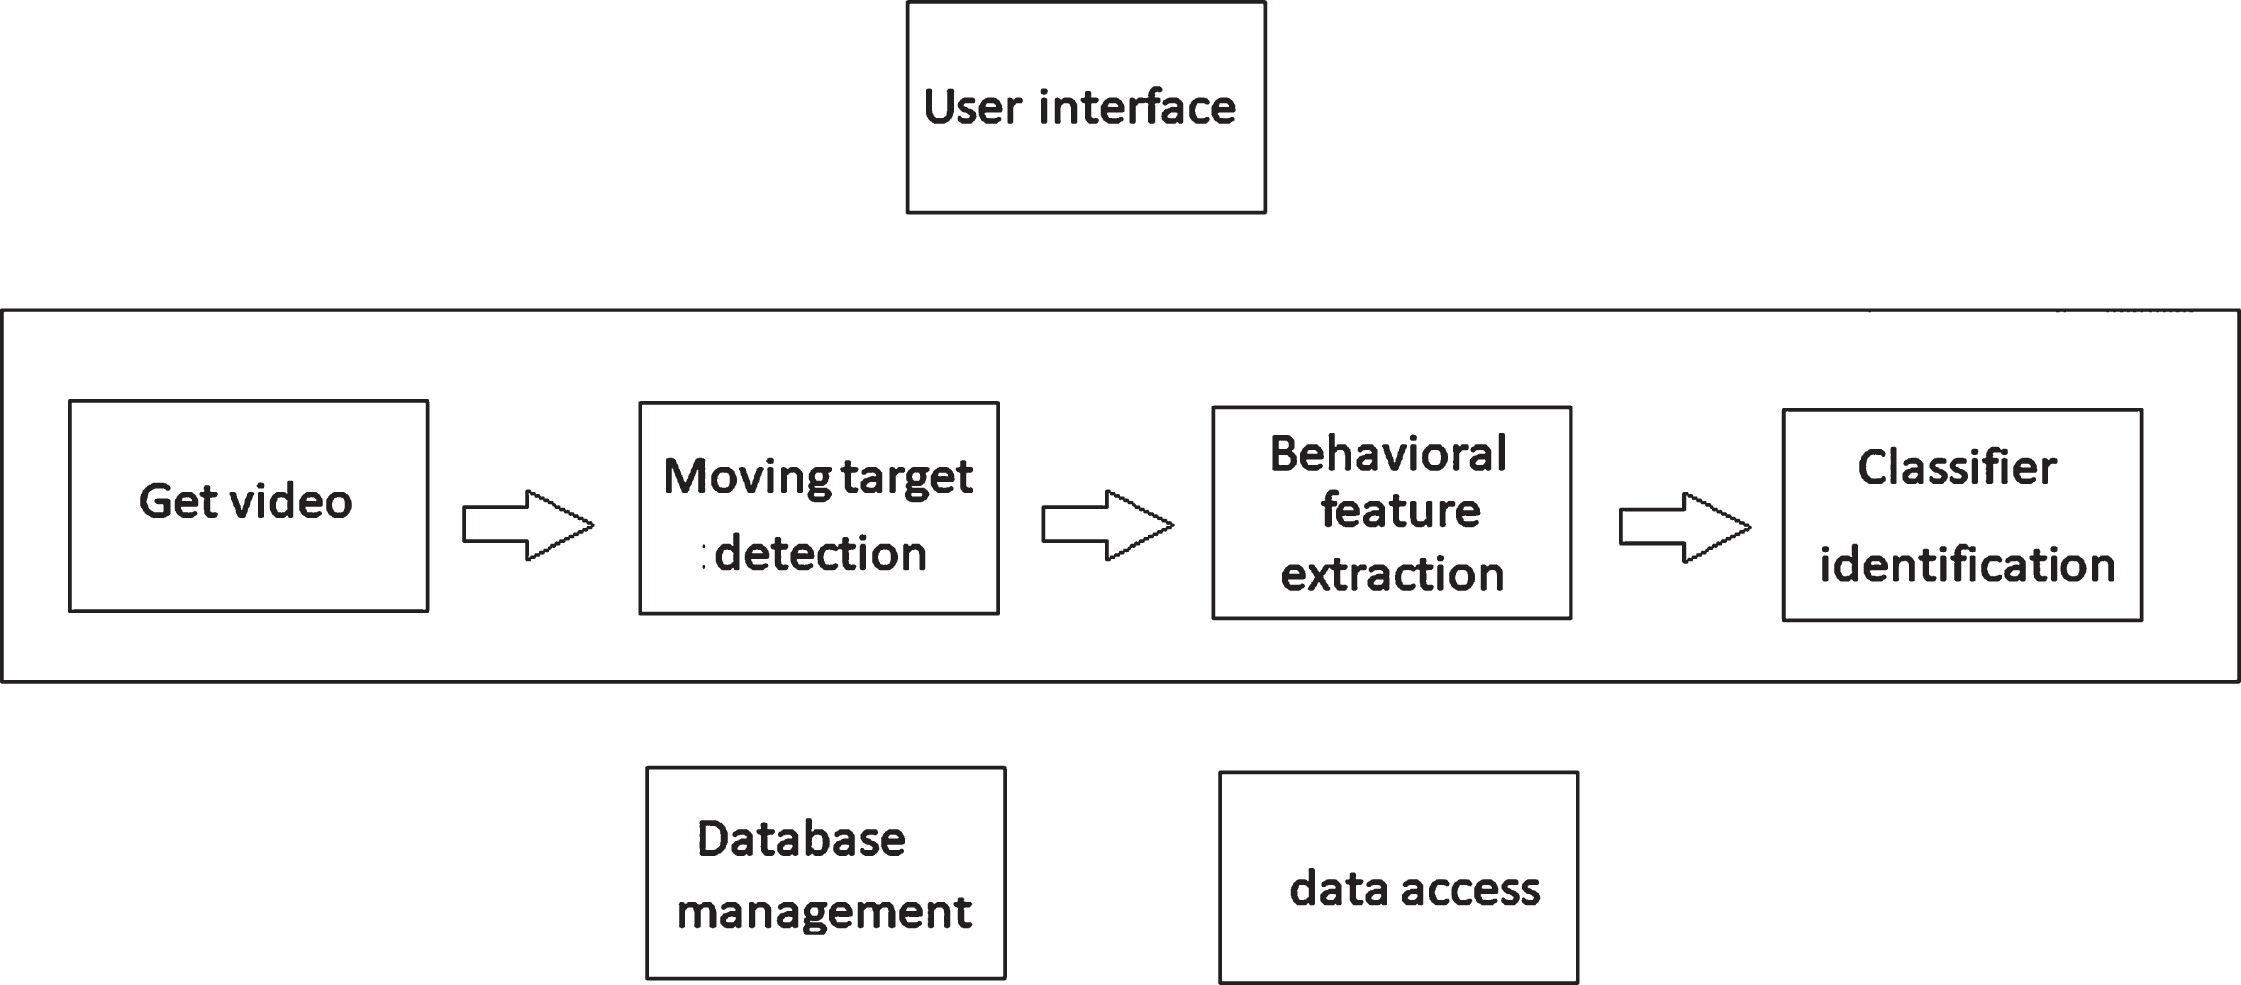
Flow chart of classroom behavior intelligent image recognition and analysis system framework.
When the video scene is switched, the special effects of the switching are added, so that the live or recorded video is smoother, and the observability is greatly enhanced. Figure 10 shows the typical effects of the classroom behavioral intelligent image recognition and analysis system.

Group feature recognition results.
The system can identify and analyze some basic actions of classroom teachers. For the recognition of student behavior, it can identify the student’s gestures of raising, lowering, standing up, sitting down, etc. Moreover, it can identify actions such as teacher walking, board reading, and the like. The system adopts the intelligent tracking camera developed by the research group to track the teachers, keep the teacher’s close-up picture at all times, and ensure the details of the teachers in the classroom. The number of interactions between teachers and students is counted by detecting the number of times the questions are answered in the classroom. By giving a close-up of the classmates who are standing to answer questions, the student’s status can be more deeply understood. Figure 11 is a view showing a pattern of a feature recognition screen display of a single individual.
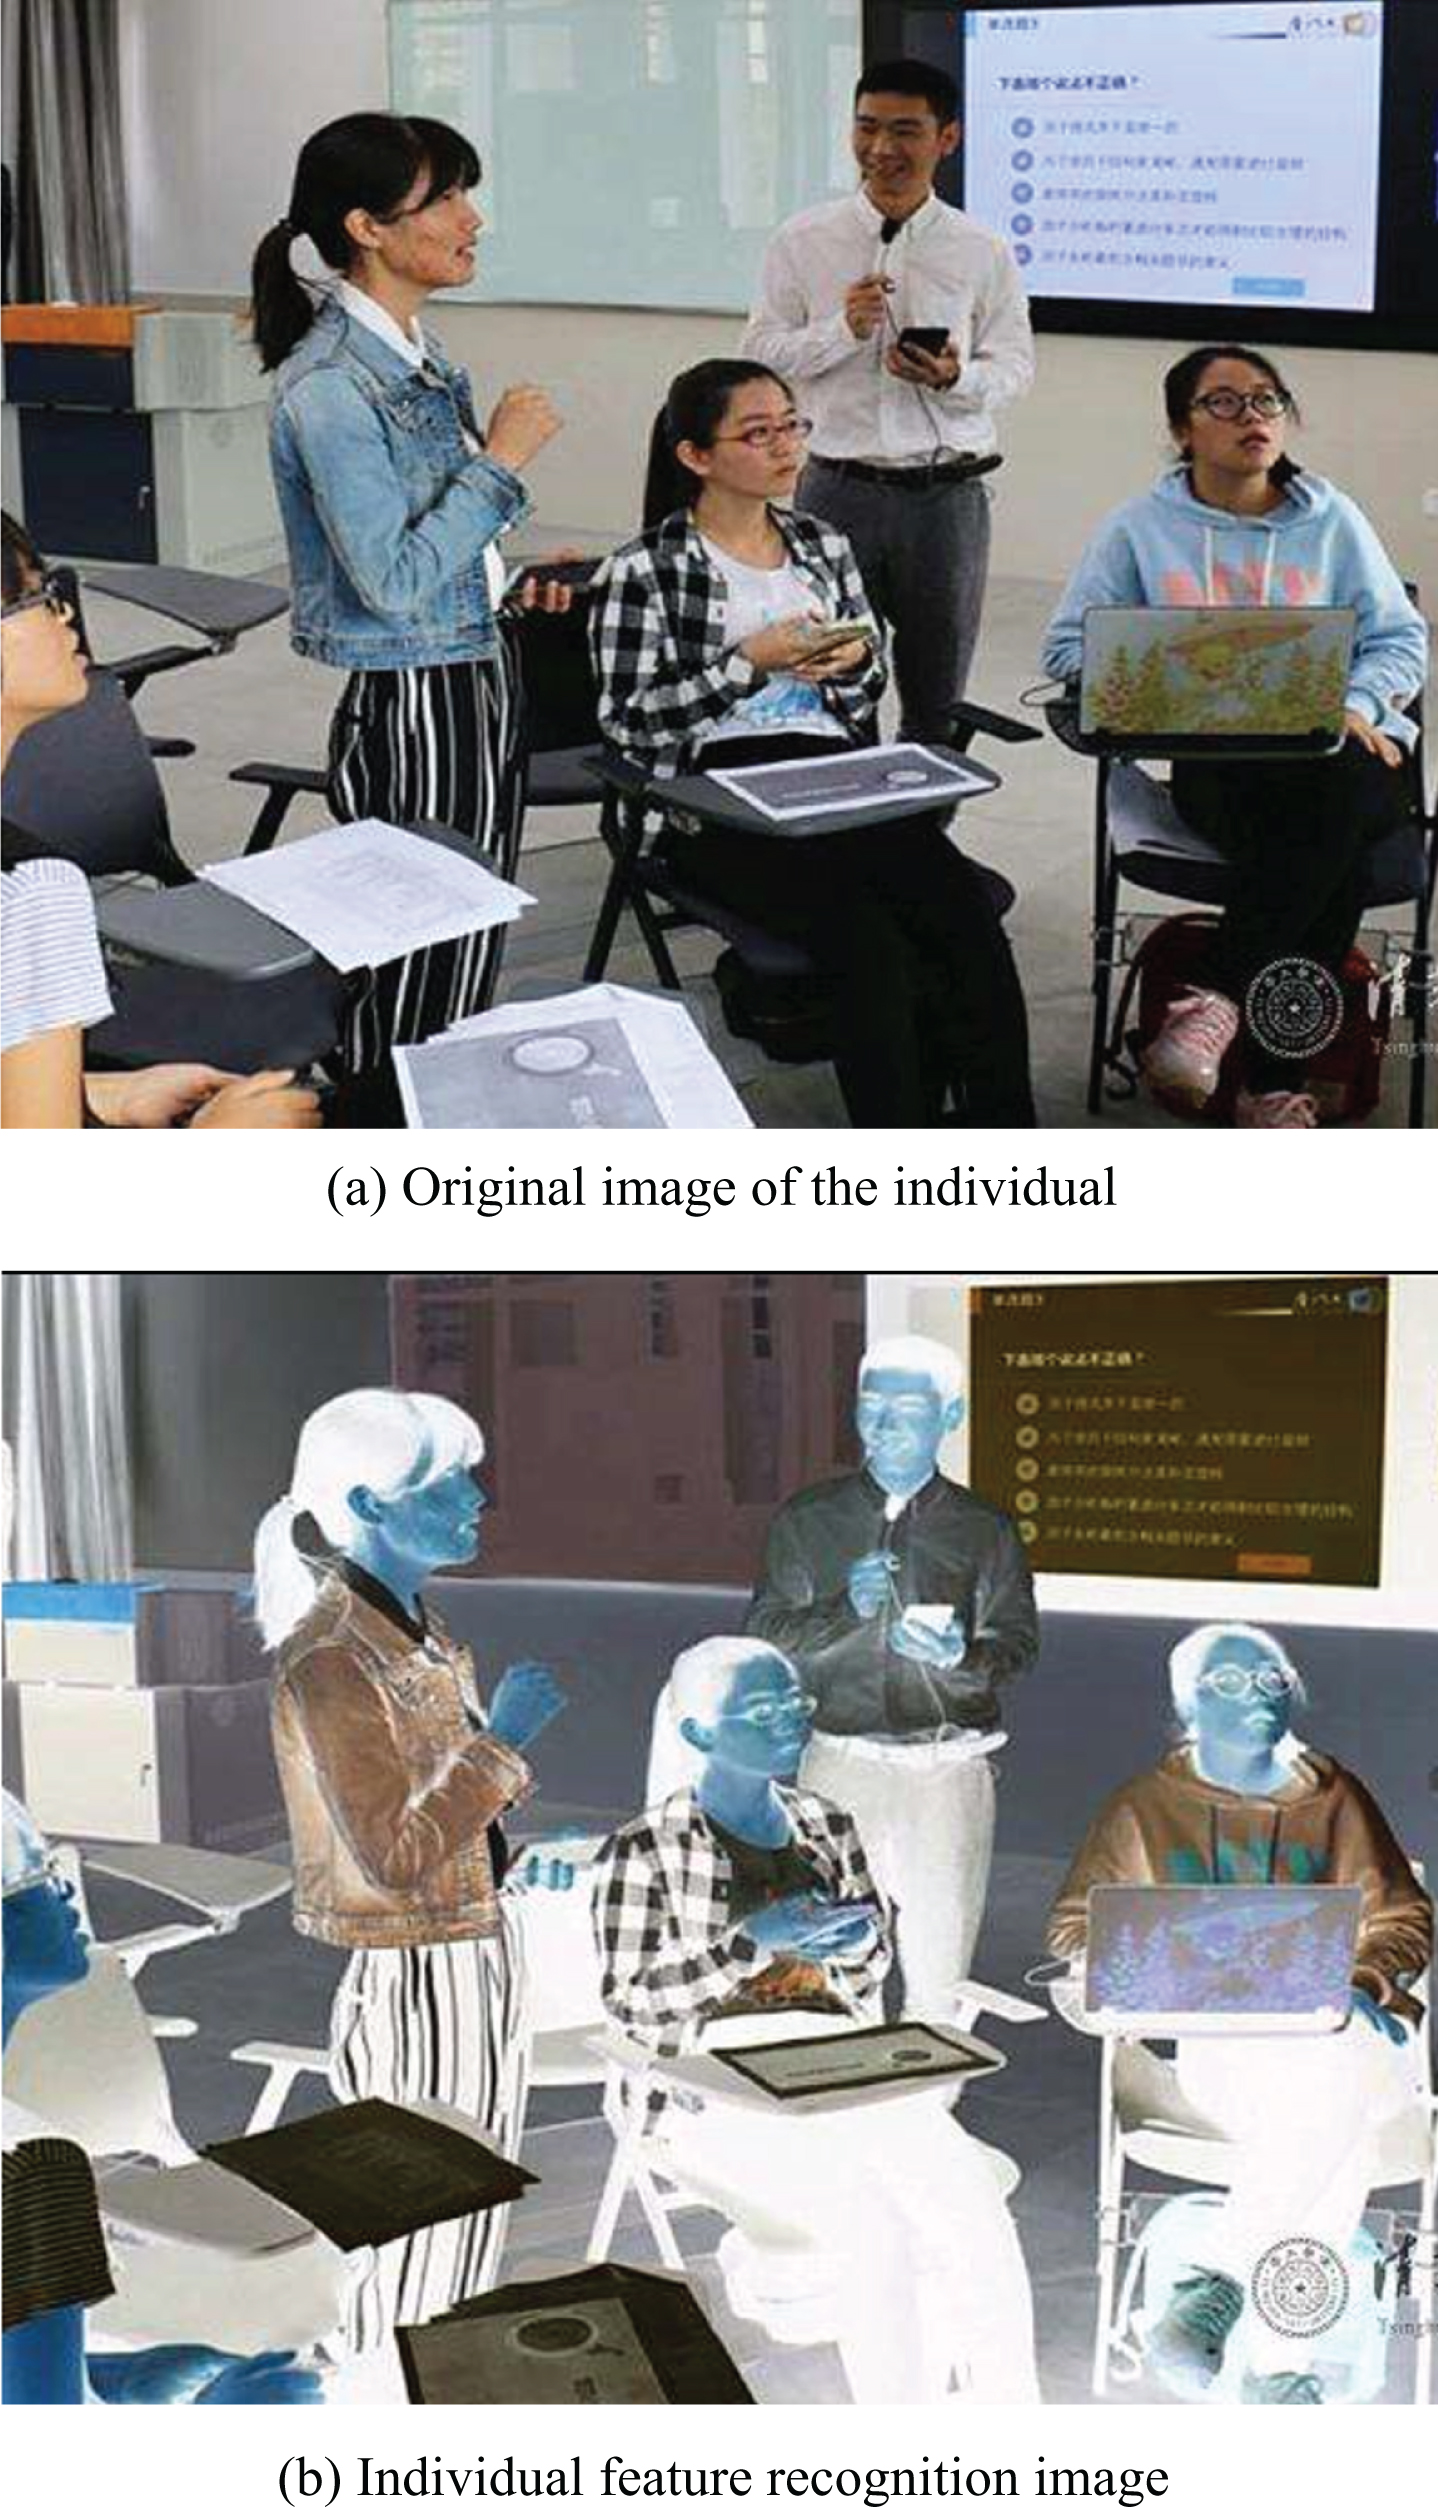
Individual feature recognition results.
In order to test the performance and efficiency of the evaluation model, 10 volunteers were selected, and 10 groups of 10 minutes of video were selected to conduct student online learning behavior perception, and the learner’s learning effect was analyzed and evaluated. During the learning process, a random screenshot of the student’s current learning state is taken. Each video captures 3 images, and then the screenshot is taken as the experimental material. The test results of this experiment are shown in Table 2.
Experimental test results
For ease of understanding, X is used for pleasant and open eye, pleasant and semi-closed eyes, and pleasant and closed eyes, Y means calm and open eye, calm and semi-closed eyes, and calm and closed eyes, and Z means tired and open eye, tired and semi-closed eye, and tired and closed eye. It is stipulated that in the experiment of the whole learning process, the learning state detection has the following representation: When 3x, 2x+y, and 2x+z are tested, it indicates that the learning state is good. When 3y, 2X, 2y+Z, and X + y + z are tested, it indicates the learning state is general. When 3z, 2z+x and 2z+y are tested, it indicates the learning state is poor. The above experimental results show that the learner’s eye state and emotional characteristics can detect changes in the learner’s learning behavior during the learning process, thereby intuitively reflecting the learner’s learning state. This makes it easier for the professor to evaluate the learner’s learning behavior during the online learning process.
According to the actual application, classroom behavior intelligent image recognition system can be divided into three parts: human-computer interaction, software system and data-driven. The human-computer interaction part mainly performs the instruction input of the user and the display of the current state of the system and can transmit the command requirements of the user to the software system. The software system is the core of the whole behavioral motion recognition algorithm. According to the relevant key factors mentioned earlier in this paper, it can be divided into four steps: video stream acquisition, foreground motion target detection, behavioral motion feature extraction, and behavioral action classifier recognition. The data-driven part is mainly responsible for recording, accessing, and managing classroom behavior information and video information. The research system cannot only realize group feature recognition, but also perform single feature recognition, and it can also perform student emotion recognition. Experimental research shows that this paper has certain effects in classroom teaching, which can provide theoretical reference for subsequent related research.
Footnotes
Acknowledgments
This paper was supported by Science Research Project 2018 Lingnan Normal University (LP1855).