
Abstract
If there are more external interference factors in the process of intelligent recognition in English, the recognition accuracy will be greatly reduced. It is of great academic value and application significance to deeply study feature recognition of English part-of-speech and realize automatic image processing of English recognition. Based on unsupervised machine learning and image recognition technology, this study combines the actual factors of English recognition to set the corresponding influencing factors and proposes a reliable method to identify multi-body rotating characters. This method utilizes the principle of the periodic characteristics of the trajectory rotation on the feature space. Moreover, this study conducts a comparative analysis of recognition accuracy by comparative experiments. In addition, this paper analyzes the recognition principles of 4 fonts in detail. The research results show that the proposed method has certain effects and can provide theoretical reference for subsequent related research.
Keywords
Introduction
Since the beginning of the 21st century, with the continuous improvement and improvement of hardware devices such as mobile phones and tablet PCs, major IT companies have also launched operating systems for their handheld devices in order to seize the huge market of terminal devices [1]. Although these operating systems are implemented in different ways, they all have one thing in common: they allow users to install software on the terminal device according to their personal preferences and have a friendly user interface. This feature makes the use of terminal devices more extensive, and its popularity among users is getting higher and higher. At present, the application of smart terminal devices has almost involved all aspects of people’s lives. It is well known that the device that people are used to when entering information on a conventional electronic computer is a keyboard. In contrast, when using smart terminal devices, people prefer to use handwriting to input because of occasions and environmental constraints. For example, in crowded places such as stations and subways, handwriting input is significantly more convenient than keyboard input. Secondly, for example, in the cold winter, when people wear gloves, the advantage of handwriting input relative to keyboard input is more obvious [2].
According to the difference of user input content, we divide handwriting recognition into two types: single word recognition and string recognition. In English, a word refers to an English letter that is independent of each other, and a string refers to a word or sentence. Up to now, the English handwriting input method widely used on smart terminal devices is basically based on single word recognition, that is, the user writes a letter and the device performs one recognition. At present, there are few handwriting input methods that can recognize English character strings. The main reason for this phenomenon is that the word recognition technology has been very mature until now. Some single-word recognition models, such as the Convolutional Neural Network (CNN), have achieved more than 95% recognition rate in English and Chinese handwriting recognition [3] However, string recognition is essentially a time series-based classification problem. Compared with single-word recognition, string recognition needs to consider more problems in the classification process, such as context utilization, gradient attenuation and explosion problems, alignment of input sequences and output sequences, etc. [4]. These additional problems make training a string recognition model much more difficult than training a single word recognition model, so handwriting input methods based on string recognition are not widely used in smart terminal devices.
The recognition of English characters is only the first step of research. In the intelligent age, the recognition of English part of speech is more practical. Therefore, this study conducts English part-of-speech analysis based on the intelligent recognition of English characters. Therefore, this study conducts English part of speech analysis based on the intelligent recognition of English characters.
Related work
Sardar V M [5] took the lead in proposing relevant theories of text recognition technology and obtained related patents. Later, Prasad S [6] realized the automatic processing of text recognition by means of related technologies such as machine equipment. In order to realize the automatic input of a large number of newspapers, magazines, books and other text materials into the computer for processing, some countries in Europe and the United States began to study Western text recognition technology. In the early stage of research on text recognition, most countries in the world mainly studied text recognition methods, and the main objects of processing only included Arabic numerals 0 to 9. Later, the research object was gradually extended to English and Chinese characters [7]. According to the relevant literature [8], the recognition of printed Chinese characters can be traced back to the 1960s. In the 1970s, two IBM researchers published an article on Chinese character recognition. For the first time, the paper proposes a scheme for identifying printed Chinese characters by means of template matching, and the number of recognized Chinese characters reaches 1,000. Since the 1970s, Japan has made many remarkable achievements in the field of Chinese character recognition. Many companies have developed more efficient identification products and have been well applied in many fields. For example, the Japanese kanji recognition system developed by Toshiba has a good performance both in speed and accuracy. Similar to this, there are systems developed by companies such as Fuji, Matsushita, and Sanyo in Japan. However, these systems are basically the same in terms of identification methods and rely heavily on dedicated hardware that is extremely expensive, making it difficult to implement large-scale applications [9].
Compared with foreign countries, China started research work on text recognition technology very late. The initial research focused on simple object recognition such as English, numbers, and punctuation. After that, the research gradually focused on the recognition technology of Chinese characters. In the 1980s, with the continuous development of China’s high-tech research and development work, many domestic units began to cooperate in the research and development of Chinese recognition software. In the early 1990s, Tsinghua University took the lead in launching the first Chinese recognition software. At this point, the Chinese recognition software was transferred from the laboratory to the market and began to be invested and applied. In the following ten years, the top universities and research institutes in China began to develop Chinese recognition technology, and made many excellent Chinese recognition products, which represent China’s most advanced technology in this field [10].
The traditional text recognition technology uses artificial neural network Because it has very good nonlinear fitting characteristics, it can achieve mapping of various complex nonlinear relationships. Moreover, its learning rules are simple and easy to implement by computer. However, the artificial neural network itself has certain limitations, and there are problems such as high training cost and easy over-fitting. Moreover, with the deepening of the network level, the effect has become less and less ideal [11]. The hottest deep learning and convolutional neural networks in the past two years have also originated from the study of traditional neural networks. The concept of deep learning was first proposed by Pogrebnyakov N [12]. Once it was born, it has won the favor of scientists from all over the world with its advantages of easy training, deep enough level and high accuracy. Moreover, many classic deep neural network structures have been born, such as AlexNet [13] who won the ImageNet image classification challenge and GoogLeNet [14] who won the ILSVRC Challenge. Compared with traditional artificial neural networks, deep convolutional neural networks have many advantages and broader application prospects. Moreover, applying it to text recognition technology is also an inevitable development trend, which is worthy of our in-depth exploration and research.
Algorithm principle
In MMDA, multi-manifold features are extracted by minimizing intraclass Laplacian plots and maximizing interclass Laplacian plots. However, singular matrix problems often occur when minimizing intraclass Laplacian graphs, affecting subsequent classification effects. In order to eliminate the singular matrix problem in the process of minimizing intra-class Laplacian, only the inter-class Laplacian graph is explicitly maximized, and the minimized intra-class Laplacian graph is hidden in the process of maximizing the inter-class Laplacian graph. In order to maximize the inter-class Laplacian graph, the following first defines the inter-class Laplacian scatter matrix [15].
The data set is X = [x1, x2, ⋯⋯ x
N
] , x
i
∈ R
D
and it contains a total of N samples and is divided into c classes, and each class has n
i
samples. If we assume that the low-dimensional representation of the sample obtained by linear projection P is Y = P
T
X, the low-dimensional sample set is
We assume that all sample classes in the high-dimensional space have a mean value of M = [m1, m2, ⋯⋯ m
c
] and construct an inter-class Laplacian graph. B
ij
represents the weight between class i and class j, which is defined as follows:
After derivation, the following formula is obtained.
In the formula, L
b
= D
b
- B is a Laplacian operator matrix, and D
b
is a diagonal matrix
Since
By further derivation, the following formula is obtained.
By substituting the formula (6) into the formula (3), the following formula is obtained.
Therefore, the interclass diagram criteria can be translated into:
The above maximization problem can be obtained by solving the following generalized eigenvalue problem.
The projection matrix P contains a generalized eigenvector corresponding to the largest eigenvalue of the first d numbers of ML
b
M
T
. From Equation (5), it can be seen that the mean of the i-th class in the high-dimensional space can be obtained by the following formula.
w
ik
is the weight of the sample x
ik
in the i-th class,.First, the intraclass Laplacian graph is constructed, and the similarity between x
i
and x
j
is defined as:
The farther x
i
is from x
j
, the smaller the weight between the two points. The weight function is a strictly decreasing function with respect to the distance between nodes, and 0 ⩽ C
ij
⩽ 1 is always established. The preservation criterion of the intraclass is to find the projection matrix P so that the manifold of the intra-class matrix is more compact, as defined below:
L
w
= D
w
- C is a Laplacian matrix. The value of the upper element gives the importance of the corresponding sample. The larger the value, the more important the sample is, and the greater the proportion of the average should be. The smaller the value, the less important the sample is, and the smaller the proportion of the mean should be. Thus, the weight w
ik
is defined as follows:
The basic steps of the algorithm are as follows: The similarity between the samples x
i
and x
j
is expressed by the formula (11), and the relationship weight matrix of each class is constructed. We assume that the number of samples in the training set is N, then the C matrix of each class is N × N-order, and a total of c numbers of C, C1 ⋯ C
c
, matrices are obtained. Each C matrix represents the size of the relationship weight within the class. c-number D
w
, Dw1, Dw2, ⋯⋯ D
wc
, matrix can be derived from c-number C matrices. D
wii
is the sum of the i-th row (or column) in the C matrix, D
wii
= ∑
j
C
ij
. The D
w
matrix is also N × N-order. D
wii
indicates the importance of the ith sample within the class, and the larger the value on the diagonal, the more important the sample is. According to the diagonal matrix Dw1 ⋯ D
wc
, the mean of each class is calculated, where the mean of the i-class is:
Then, the M matrix is found, M = [m1, m2, ⋯⋯ m
c
]. Construct an inter-class Laplacian matrix. The B matrix is obtained according to the formula B
ij
= exp(- ∥ m
i
- m
j
∥ 2/t), the B matrix is c * c order, and the matrix L
b
is obtained by the formula L
b
= D
b
- B. The generalized eigenvector corresponding to the first d largest eigenvalues of ML
b
M
T
is obtained, which is the P projection matrix. According to Y = P
T
X, a low-dimensional representation of the training set is obtained. The test set X′ is processed by P matrix to obtain a low-dimensional representation of the test set: Y′ = P
T
X′. KNN is used to identify the test set
The above algorithm introduces the class label information, uses the inter-class Laplacian graph to extract multi-manifold features between each category, and seeks the projection matrix by maximizing the inter-class Laplacian scatter matrix to separate the different types of samples from each other, thereby achieving the role of classification recognition. Different from the traditional linear discriminant analysis idea, the inter-class Laplacian graph in this algorithm takes into account the structure of the submanifold when calculating the mean of the sample class, highlights the importance of each sample to the mean, increases the intra-class compactness of the submanifold, and maintains the local adjacency between sample mean values [16]. Moreover, the algorithm eliminates the intra-class Laplacian singular matrix problem in MMDA and LPP methods and extracts the most discriminative feature information in high-dimensional space, thus improving the recognition accuracy. The time cost of the algorithm mainly consists of three parts, the calculation matrix C, the calculation matrix B and the solution of the eigenvalue problem. We assume that N is the number of samples, c is the number of classes, and D is the sample dimension. Then the time complexity of the calculation matrix C is O (N2D), the time complexity of the calculation matrix B is O (c2D), and the time complexity of solving the eigenvalues of the matrix ML b M T is O (D3). Usually the number of sample classes c is much smaller than the number N of samples, so the time spent calculating matrix B can be ignored. Therefore, the total time complexity is O (N2D + D3). The algorithm needs to store matrix C and matrix ML b M T in the process of execution, and its space complexity is O (N2 + D2).
The projection matrix P contains a generalized eigenvector corresponding to the first d largest eigenvalues of ML
b
M
T
P = λP. How to choose the appropriate parameter d is crucial for subsequent classification processing. At present, there is no good way to determine d. Most methods determine the parameter within a certain range by means of experiments. In PCA, the parameter d is determined by calculating the cumulative contribution rate of the eigenvalues. In this paper, by referring to the idea of PCA, after all the eigenvalues are obtained, the eigenvalues are sorted from large to small, and the contribution rate of each eigenvalue is calculated in turn. When the cumulative contribution rate of the current d eigenvalues reaches 90% or more, the corresponding eigenvectors can extract important information between most of the regional classifications [17]. The experimental results on the face database show that the recognition accuracy is the highest when the cumulative contribution rate of the current d eigenvalues reaches 95%. The specific steps are as follows: The feature values in ML
b
M
T
P = λP and their corresponding feature vectors are sorted from largest to smallest. The contribution rate of each eigenvalue is obtained. Assuming that there are m eigenvalues, the contribution rate of the i-th eigenvalue is calculated as follows:
In the formula, λ
i
represents the i-th eigenvalue. When the cumulative contribution rate of d eigenvalues is greater than 95%, d is the low dimensional dimension
In order to draw people’s attention, some texts that are tilted, rotated, or stylized are often seen in printed documents and some advertisements. It is easy to identify such characters with the human eye, but it is very difficult for computers [18]. Moreover, many recognition methods are currently limited by the character type and font type of the text, and most methods for rotating text are solved by rotation correction. The character recognition method based on feature space method proposed in this paper can realize multiple recognition of multiple fonts without establishing multiple classifiers. Moreover, the text with the rotation tilt can be correctly recognized without the rotation correction, and the rotation angle of the rotated text can also be estimated. The structure of the character recognition system based on feature space is shown in Fig. 1.
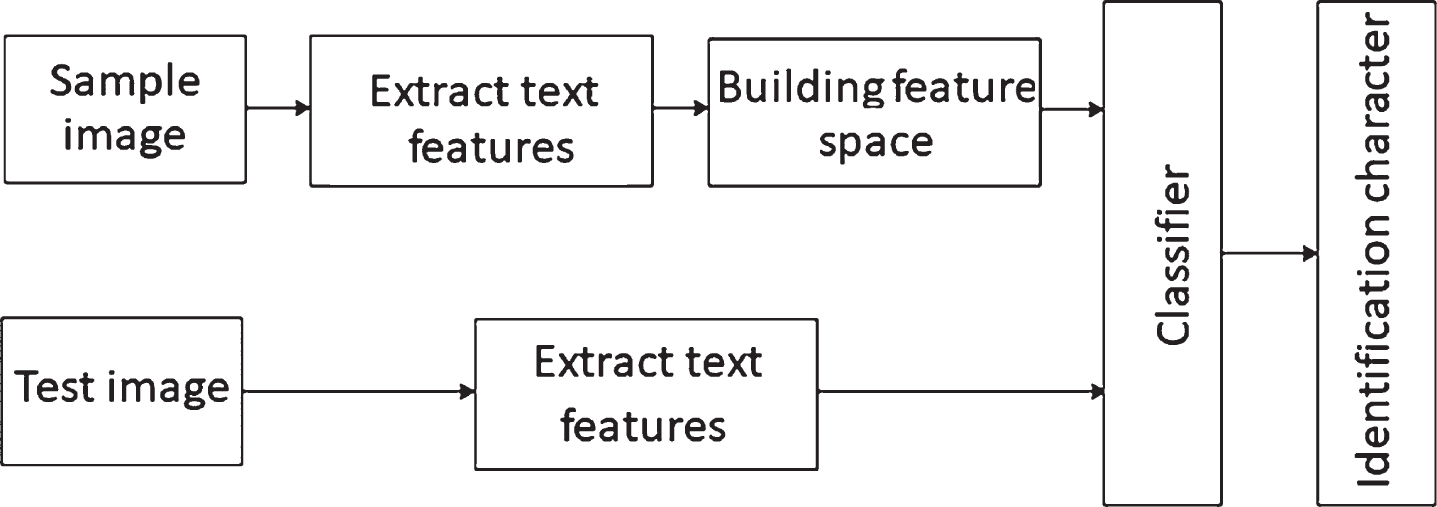
Structure of character recognition system based on feature space.
The feature space-based rotating multi-font text recognition method is improved by the traditional template matching method, which is a method for recognizing a rotating, multi-font text. The method first needs to extract the features of the corresponding characters of the word by using principal component analysis for each character and establish its corresponding feature space. Among them, each character corresponds to a feature set, and the set is composed of character features of a plurality of fonts rotated by a fixed angle. After the feature set is obtained, the character feature is projected into the feature space, and then the input character to be recognized is extracted and its corresponding feature is extracted, and then the improved neighbor classifier is used to classify and recognize the character to obtain the recognition result. The specific identification steps are as follows: In the first step, the feature space is established. The process is mainly to establish a template library to prepare the design of the classifier, and to extract the acquired character features into the feature space through feature extraction, and then obtain the two-dimensional and three-dimensional trajectories of the characters in the feature space. The second step is character classification. The process is the last step of the process of identification, that is, determining which character is the character to be recognized. There are two methods used in this paper, one is a simple method based on distance criteria, and the other is a periodic discriminant method.
Creating a feature space is actually creating a template library for the characters. A specific template library is created for the character so that the character can find its corresponding state in the feature space regardless of the angle to which the character is rotated under certain font type conditions.
In order to effectively explain the recognition principle that the feature space method can recognize more kinds of font characters in the case of the minimum number of templates, this paper introduces the principles of four fonts and character recognition in detail. The characters used here are English letters and numbers, and the fonts used are Century, Courier, Times New Roman, and Arial. When identifying the same character of different font types, in order to avoid increasing the capacity of the feature space, the algorithm complexity is improved while reducing the complexity of the algorithm. The measure taken in this paper is to average the images of the four fonts of the same character to obtain an average image of the characters and use the average image as the sample image. The sample image acquisition method is shown in Fig. 2.
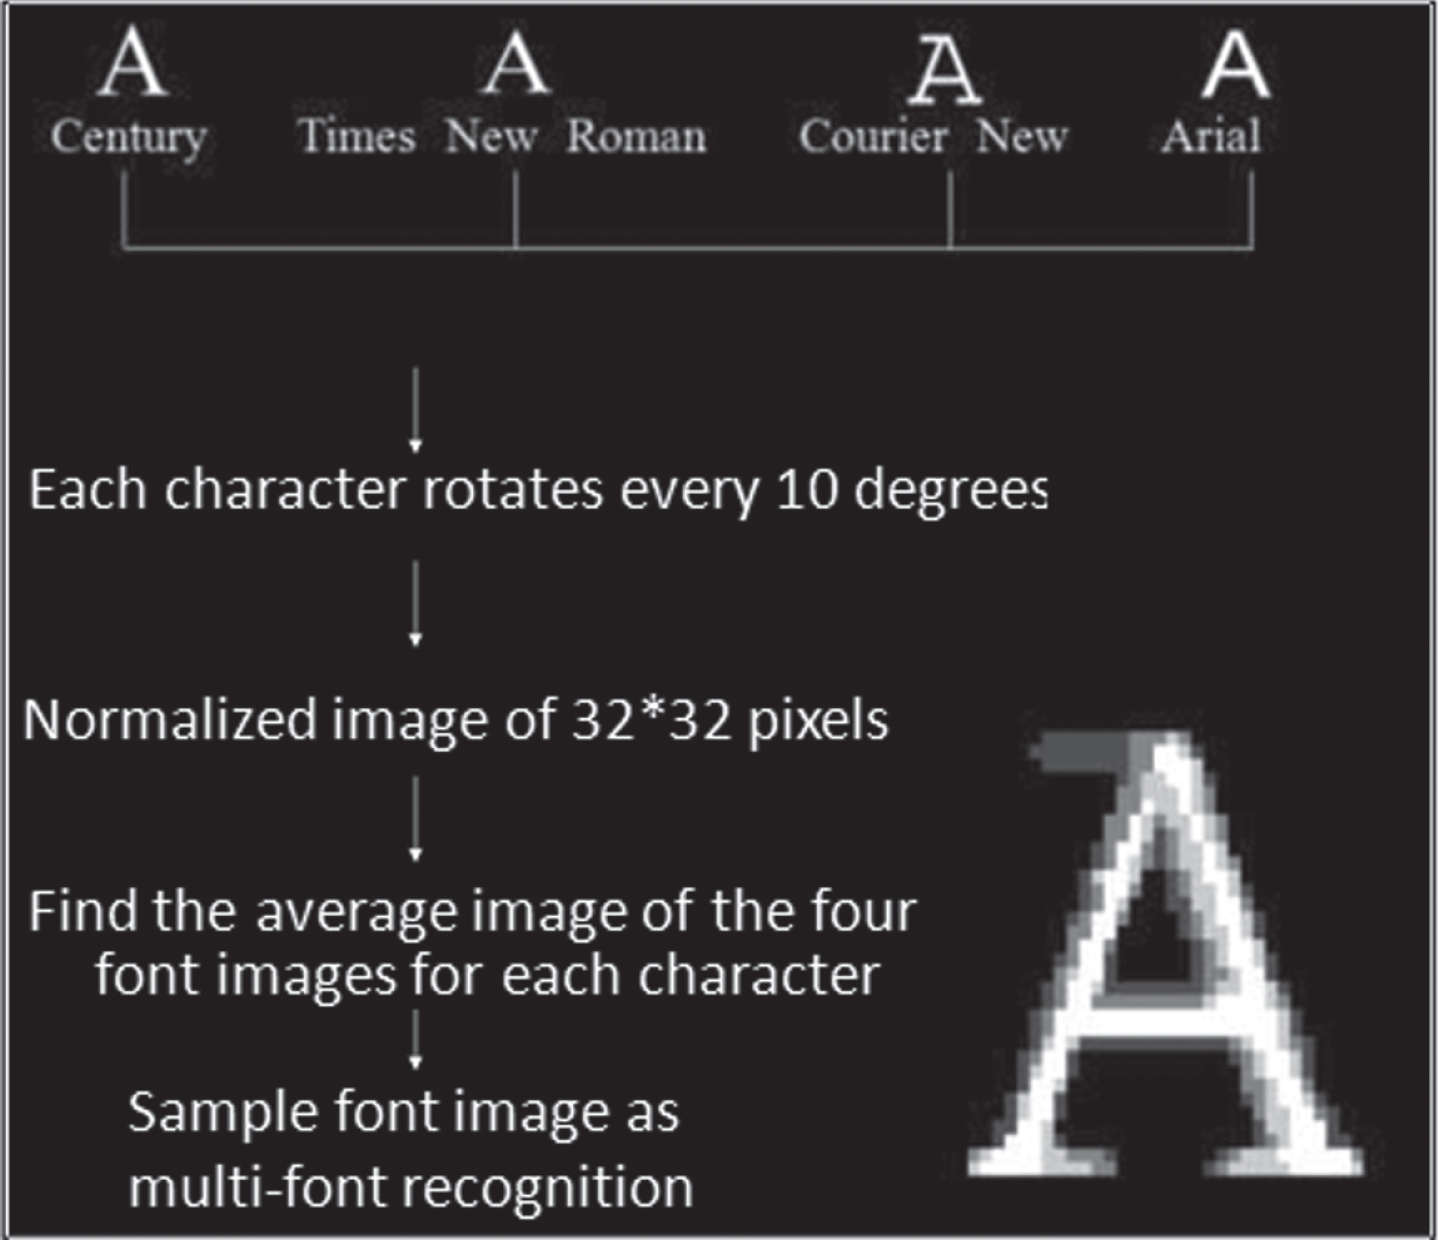
Example of multi-font sample image acquisition.
As can be seen from the above Fig. 2, the image of the character sample needs to be rotated every 10 degrees for each character’s four fonts, so that the characteristics of each character in each direction can be obtained. The rotated image is then normalized to an image having a pixel size of 32×32, and then averaged by the images of the normalized four fonts, and the resulting average image is taken as a sample image. The process is to reduce the four fonts of 36 angles per character and a total of 4×36 samples to a total of 36 images that can represent the original features of each character, greatly reducing the amount of computation for processing the data.
According to the above steps, the characters of the four characters of the single character shown in Fig. 2 can be converted into the image of size 32×32. However, in order to facilitate the subsequent calculation processing without losing the character feature as much as possible, it is necessary to binarize the average image. Since the sample image is a simple background image, the binarization method used in this paper is a fixed threshold binarization method, that is, a fixed value is selected as the threshold of the entire image by the distribution of the gray histogram of the image. Moreover, the threshold chosen in this article is 128 The pixel position in the image that is smaller than the threshold sets the corresponding pixel value to a pixel value 255 representing white. However, the value of 255 is set to 1 for convenience of calculation. The portion of the image larger than the threshold is set to represent a black pixel value of 0, thereby converting the image into a binary image that facilitates data processing. After the binarized sample image, the normalized image is converted to an image of size 32×32 as shown in Fig. 3, which is represented by only 0 and 1.

Example of sample image rotation and normalization results.
A new sample image of size 32×32, represented by 0 and 1 after normalization and binarization processing, is obtained, and the image can be regarded as a 32×32 matrix. The matrix is then converted to a 1024-dimensional vector by reading each row of data in the order shown in Fig. 4. The reason why the matrix is converted into a 1024-dimensional vector is mainly to use the idea of principal component analysis to convert the original high-dimensional vector into a low-dimensional vector by orthogonal transformation with the mutual relationship between the variables in the vector, while maintaining the retained data to maintain the maximum characteristics of the original data set, that is, retaining the most important aspects of the original data. In this paper, when we use the idea of principal component analysis, we need to convert the 32×32 matrix obtained after normalization into a vector of 1024 dimensions. Then, by solving the eigenvalues and eigenvectors of the vector, the data of the 102-dimensional vector of each character is converted into data of up to 36 dimensions, so as to achieve the maximum feature of the original data while reducing the dimension.

Matrix conversion example.
Since the character image is rotated at a fixed angle when rotated, the feature values and the feature vectors are arranged in an angular order, so the values in the obtained projection matrix are also arranged in an angular order. Then, the values in the sequential connection matrix can be obtained. The character image shown in Fig. 5 is a track in a two-dimensional space. The range of the horizontal and vertical coordinates in the figure is the range of the magnitude of the projection value, which merely indicates that the data range has no practical meaning.

Projection trajectory of character A.
In order to increase the character of each character to reduce the accuracy of recognition, the projection trajectory of each character in two-dimensional space can be interpolated from 36 points to 1000 points by spline interpolation. In this way, more feature points can be obtained without increasing the number of sample images, thereby improving the accuracy of recognition and the accuracy of the angle. The trajectory image comparison before and after interpolation is shown in Fig. 6. It can be seen from the comparison before and after the interpolation that the trajectory after the interpolation is consistent with that before the interpolation, and the trajectory becomes smoother. As the number of feature points increases, the recognition accuracy of the correct recognition rate and angle of the characters also increases.

Comparison before and after the track interpolation.
The first method of identification is based on the distance criterion, but this method does not give a good recognition effect in the case of too many dimensions, because the projection point varies with the font. Therefore, this paper proposes a second new method based on the periodicity of the projected points on the feature space. It is observed from the experimental results that when the first method is used to determine the Euclidean distance, even if the value of R is increased, the recognition rate will not increase, but the amount of calculation will increase. Therefore, it is considered to use a statistical method such as mean value and variance to try another method of character discrimination. Since the trajectories of different fonts of the same character in the feature space are very similar, another character classification method is explored from the perspective of the change of the character projection trajectory. The angle of the character sample image and the projection in the feature space are observed in a graph, the abscissa is the angle of the character rotation, the ordinate is the value projected in the feature space, and 360 degrees is a period. As shown in Fig. 7, it is a periodic function obtained by projecting the feature space of 36 angular images rotated by the Arial font image of the character “Q”. Each character can get a periodic function in each dimension because 36 rotated images are obtained by rotating the characters by 10°. The function trends of the three periodic functions corresponding to the angles in the figure are somewhat different, but the number of zero crossings is the same. The smaller the eigenvalues of the variance matrix, the smaller the difference between the corresponding sample to be classified and the original sample. Therefore, the point where the eigenvalue of the periodic function is zero can be used as the basis for character recognition.

The periodic function of the character ‘Q’.
It can be seen from Fig. 7 that the number of zero-crossing points of the character period function is constant when each character is rotated at different angles, so the number of zero-crossing points is considered as a feature of character classification. Moreover, the number of character zero crossings can be obtained by rotating the character image within 360 degrees. When character discrimination is performed, the zero-crossing points of 35 dimensions are calculated. As shown in Fig. 8, the zero-crossing point of the test data of the unknown character “K” and the sample data is 4. Therefore, the angle difference between the two zero crossings in the first periodic function is zero. Similarly, the zero crossings in 35 dimensions can be compared.

The periodic function of the character “K”.
The character recognition process based on the feature space is shown in Fig. 9. The test image is first preprocessed, and the preprocessing of the experimental test image mainly includes grayscale binarization. Second, the characters in the processed image are divided into single characters. Then, the characters are projected into the feature space to get the corresponding projection points. Finally, character classification is performed to obtain the recognition result.

Experiment identification process.
In the preprocessing process, the input image is converted into a grayscale image by the averaging method, and the grayscale image is converted into a binary image by a fixed threshold binarization method. Character segmentation uses the regression word segmentation method described above to split the characters in the test sample into a single character. The method of character space creation and character recognition is in accordance with the method described in Chapter 3. First, the image data is converted into a matrix form and the average vector of the matrix is obtained. Then, the eigenvalues and eigenvectors of the covariance matrix are solved, the feature space is established, and the projection points of the feature points in the feature space are obtained. The projection point is connected to obtain the motion trajectory, and the motion trajectory is interpolated to improve the recognition precision. Finally, the characters are classified according to the distance criterion or the periodic function to obtain the recognition result.
A part of the test image is shown in Fig. 10. The figure shows the type of the character and the angle of its rotation. The experiment was implemented under the Ubuntu system in the VMware Workstation environment. For the environmental reasons, the overall software interface was not made during the experiment, but the steps were followed step by step. In addition to calling the library functions in OpenCV during the experiment, the following subroutines are defined according to the needs of each step.

Test sample example.
pictproc8.c: Image preprocessing correlation function.
covar8.c: The average vector is obtained, the image data is read and converted into a matrix form, and a covariance matrix is generated.
numpac8.f: The eigenvectors and eigenvalues of the covariance matrix are solved.
vec-1024-35.c: 64×35 feature vector is generated.
espace8.c: A projection point and its three-dimensional coordinates are generated, and the projection point is interpolated.
spline8.c: Spline interpolation function.
judge8.c: Character discriminant function.
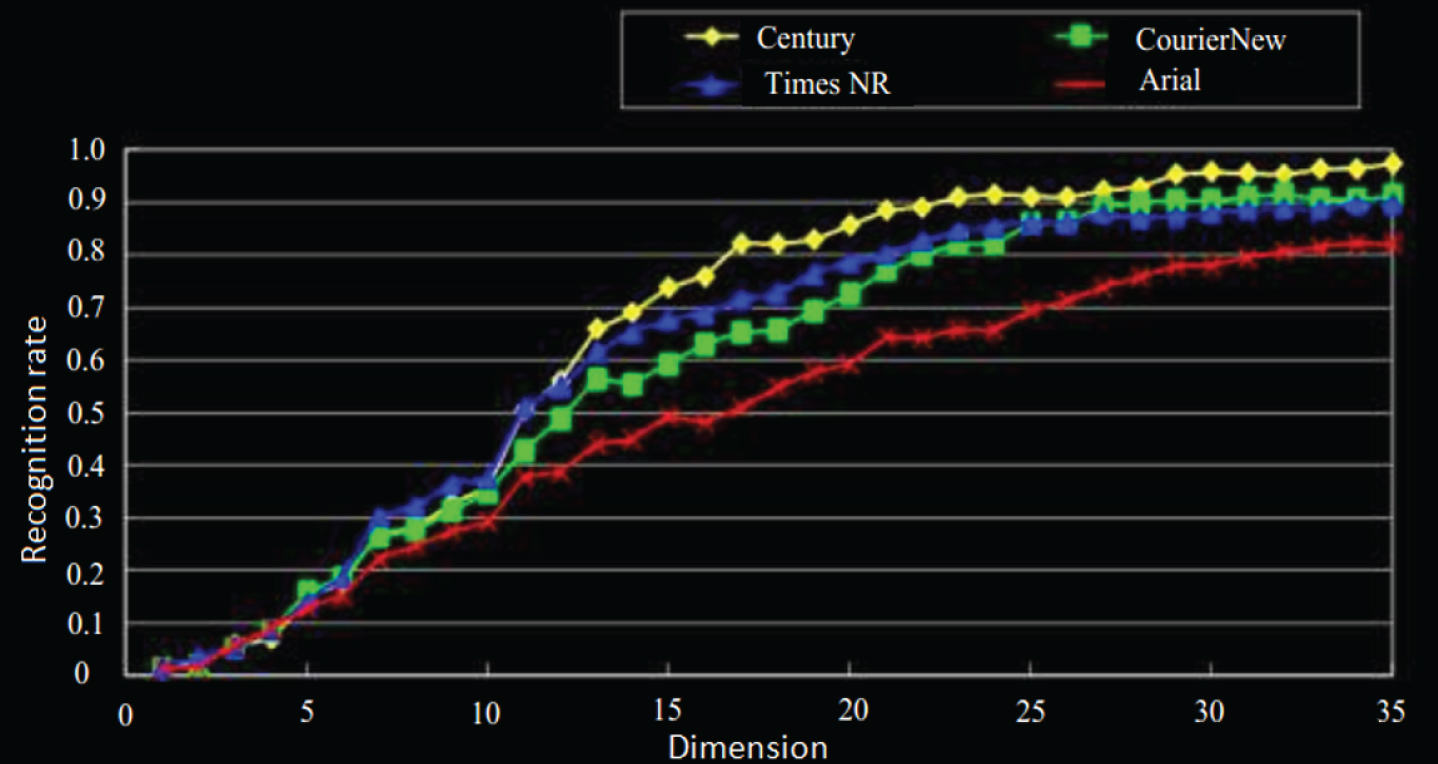
It can be seen from the curves of the recognition rates of the four fonts in Fig. 11 that the recognition rate of each font is relatively low when R = 1, and the recognition rate is relatively high when R = 5. The best recognition rate range when R = 3 is 70∼90%. In the experiment, the accuracy at R = 5 and R = 3 is about 10% higher than the accuracy at R = 4 and R = 2. From this, we can guess that when the projected points on the feature subspace of some characters are around 90°, 180 °, and 270°, they are relatively close. The main reason for the error is that the feature spaces such as the uppercase letter “O”, the lowercase letter “o”, and the number “0” are extremely similar, which makes the character recognition easy to be confused. Although Method 1 can better identify rotating multi-font texts, it does not achieve very good results. Therefore, based on Method 1, this paper attempts Method 2, a recognition method based on periodic functions.

Identification result of method 1.
It can be seen from Fig. 12 that the maximum recognition rate of 62 characters can be over 95% when recognized by the periodic function method.
Identification result of method 2.
Through hard work and experiment, this paper finally proposes an image English character recognition method, which is an English part-of-speech feature recognition method based on unsupervised machine learning and image recognition model. It computes a covariance matrix from the average of a sufficient number of multibody rotation characters and constructs a feature subspace using a covariance matrix. Then, these rotated characters are projected onto the corresponding feature subspace and interpolated between their adjacent projection points to obtain a track. In the recognition process, unknown characters are also projected onto the feature subspace of each character. Finally, the unknown character can be identified by calculating the distance between the projection point of the unknown character and the trajectory. Rotating multi-font text recognition based on feature space has a good effect in identifying 26 English letters of four fonts. However, as the number of characters increases, the recognition accuracy also decreases. Therefore, this paper proposes a new and reliable method for identifying multi-body rotating characters. The principle utilized by this method is the principle of the periodic characteristics of the trajectory rotation on the feature space, that is, the projection point exhibits a periodicity in all dimensions. Experimental results show that the method has good recognition accuracy.