
Abstract
Traffic congestion is a big problem that influences the traffic flow in big cities, so better control of the traffic signals is always searched to solve this type of traffic problems. Fog computing is one of the most efficient paradigms for traffic system control as it enables connecting and analyzing big traffic data to help the control of traffic signals in the appropriate time. There are different optimization methods, which can be used to control traffic signal; one of these is Particle Swarm Optimization (PSO) algorithm, and there is correlation between PSO parameters (particle velocity, position) and traffic parameters (vehicle speed and location). Roundabouts with traffic signals is one of the modern roads infrastructures used to reduce traffic jam. Our objective is to minimize the average delay time in order to decrease the traffic congestion. This paper presents a control strategy called COTSD-PSO for optimizing traffic signaling based on PSO combined with three sub-controllers; this strategy depends on traffic control rules. These sub-controllers are PSO-Jump, PSO-Turn and PSO-Mix depend on two parameters; extension time and urgency degree for the different phases in the traffic cycle. PSO algorithm is applied to optimize the control of the traffic signal network for roundabouts model on fog computing environments using real data from Taif streets in KSA country. The PSO simulation results show that the PSO-Mix has the fastest convergence rate for the optimal solution and the best performance in minimizing the average delay time compared with the other combinations.
Keywords
Introduction
Developing methods and strategies for traffic signal control is very important to reduce congestion, minimize vehicle delays, and improve road safety. For years, intelligent transportation systems (ITS) were concerned with traffic signal control [45]. Traffic signal control, including sensors, communications, and advanced timing algorithms, is a dynamic, continually evolving form of transportation management [27].
The existing systems solving the issue of traffic signal control use fixed-time and real-time control methods. Fixed-time control methods employ preset phase sequences and timings to control the traffic signals. The most famous fixed-time control method is Webster’s equation for the optimal cycle length and phase timing [10]. Some other fixed-time signal controllers have been proposed based on Webster’s equation [29, 34].
There are many attempts to develop real-time traffic signal controllers with the help of inexpensive sensors and communication devices [4]. Uncertainties and human perception can be controlled by fuzzy logic and fuzzy systems, so one of the important research subfields in traffic management is real-time fuzzy traffic control [16]. There are two kinds of traffic signal controllers based on fuzzy control mechanisms: Fuzzy-Turn and Fuzzy-Jump. Fuzzy-Turn is applied for the current green phase with another duration time if its extension time was higher than a known threshold value [8, 17]. Fuzzy-Jump is applied depending on the urgency degree as the current green phase would jump to the most urgent phase in each interval end [14, 42].
In this paper, a control strategy optimization controller called COTSD-PSO (Control strategy for Optimized Traffic Signal Design based on PSO) is proposed to improve the performance of the traffic systems using the idea of the two (Turn, Jump) rules and the mix between them for traffic signal control.
One of the powerful optimization methods is PSO. It can be used for fixed time or for real time control. PSO-based approach was proposed by H. Hu [12] for urban transportation network to solve bi-level programming problems. Enrique Alba et al. used PSO algorithm with aid of SUMO simulator to find successful alternatives from traffic cycle, and PSO minimized the overall trip time and the vehicles count reached their destination [9]. Huang and others applied PSO to establish a bi-level programming model for considering noise pollution control in urban traffic network [22]. Z. Li introduced a PSO intelligent search method to optimize the EGSCS solution by real time traffic scheduling [48]. Xiaobin used PSO for forecasting urban traffic flow to develop an efficient road network and minimize traffic congestion problems [24]. Chen and Xu presented a fuzzy-based PSO methodology for solving optimization problem of traffic signal timing to reduce the average delay time and the total number of stops between neighboring junctions [6]. C-PSO (Chaotic Particle Swarm Optimization) was proposed by Weiwei and Hui for signal timing optimization issue in urban area traffic to prove that optimization design with congestion cost can avoid the excessive congestion phenomenon in the hub nodes [43]. Peng and others discussed PSO algorithm in isolation niches embedded system for traffic lights control to make the average waiting time of vehicles shorter and the interferential phenomenon of cars in sections reduced [30]. Kachroudi and Bhouri employed a multi-objective PSO (MOPSO) algorithm for traffic organization in public and private urban transport to improve traffic responsive strategy [37]. Chien-Ching applied both PSO and GA optimization to a nonlinear optimization problem by antenna patterns; the results show that the PSO algorithm is superior to GA algorithm in reduction of path loss [7]. Cao and others proposed PSO for traffic signal with two-direction green wave control [5]. Shengwen and others proposed IPSO with a method that combines and integrates geographic information to optimize the simultaneously three-dimensional highway alignments [41]. C.Ma and others addressed PSO algorithm to help the government superintendence and administration department in choosing the best route for decision-making of critical materials transportation [3]. For achieving real-time optimization scheduling of urban traffic lights, Wenbin introduced a model that combines between an inner and outer cellular automaton mechanism and particle swarm optimization called (IOCA-PSO) method [44]. Shen Yin and others [38] applied PSO algorithm to improve the prediction accuracy in predicting the freight traffic volume, and carry out comparison studies with statistical methods LSSVM (Least squares support vector machine), SVM, and PSO-LSSVM. It is found that all these methods can be used to forecast the trend of freight traffic volume but LSSVM reduces the computation load in comparison with SVM and PSO-LSSVM improves the prediction accuracy compared with LSSVM.
There are many researches related to traffic systems in cloud computing [13, 20]. Fog Computing is a distributed and hierarchical platform consisting of compute, storage and network resources for service delivery [32]. Cloud computing helps effectively and efficiently in handling the large amount of storage resources and mass transportation of data [33]. Cloud computing provides a scalable computing in low cost but Fog computing supports applications requirements which don’t quite match the QoS guarantees provided by the cloud such as low latency applications, Fast mobile applications, distributed systems, Large-scale, Geo-distributed and decision making applications [32].
PSO algorithm is better than other algorithms like GA, ACO, and SA algorithm as PSO performs better than GA both in terms of both minimum number of iterations needed to reach the optimum and CPU utilization period time [2]. Results in [35] show that the computational efficiency superiority of PSO over the GA is statically proven with a 99% confidence level. PSO achieved the best optimization with low computational cost compared with ACO (Ant Colony Optimization) to solve and find exact resource allocation by choosing shortest and optimal path for a required specific job, minimizing the schedule of length of jobs with minimum make span and execution time [1]. The PSO algorithm achieved a success rate of about 99% compared with 60% for the SA (Simulated annealing) algorithm with substantially improved execution times because of the smaller number of function evaluations needed for convergence [36].
There are some researches concerned with traffic in fog computing and proved the efficiency of fog to reduce traffic overhead [19, 28]. In addition, as presented earlier, many of research papers addressed the use of PSO with traffic, but to our knowledge, no one addressed the integration of PSO with fog computing with traffic rules to control the traffic. The PSO controller is aimed to be integrate with edge nodes (sensors), and fog nodes to help in decision making for traffic systems.
In this paper, the combinations of COTSD-PSO are used to be optimized and analyzed using traffic rules either by turning the current phase another period of time (PSO-Turn) or jumping to the most urgent next phases (PSO-Jump) or by using a hybrid of the two alternatives according to the traffic conditions. As the PSO-Turn controller causes less traffic jams even if the traffic is crowding. However, lower real-timeliness of the controller may occur because of using preset phase sequences. On the other side, PSO-Jump has better real-timeliness because of changing its phase sequences, but may confuse the drivers when changing sequence of phases, which can lead to traffic accidents. To overcome the above shortcomings, a PSO-Mix that is a mix of PSO-Turn and PSO-Jump, is proposed in this paper.
For our experiments, a roundabout with four approaches is simulated and COTSD-PSO with three combinations are tested: PSO Jump, Turn and PSO-Mix.
The remainder of this paper is addressed as follows: Section II presents the roundabout model and different phase sequences. Section III describes the implementations of the COTSD-PSO for the roundabout. In Section IV, the PSO combinations (Jump- Turn- Mix) are developed to optimize the traffic control system. In Section V, performance and comparisons among three traffic combinations of COTSD-PSO in the roundabout model are discussed. In the end, Section VI addressed the conclusions of our work and presented the future work.
Roundabout model
Roundabout is one of the infrastructures commonly used in urban cities traffic. There are many roundabouts with different signal control designs and different geometric drawings depending on the traffic conditions and environment requirements. The design of roundabout with two round lanes and four approaches are commonly applied for both actual and academic issues [25, 46]. In this paper, this kind of roundabout is applied with proposed COTSD-PSO control strategy integrated within a fog computing environment that leads to less processing and more security. The roundabout design is described in Fig. 1.

Illustration of the roundabout paradigm.
As in Fig. 1, the assumed roundabout paradigm consists of four approaches, each approach refers to a specific direction; approach 0 for the south, approach 1 for the east, approach 2 for the north and approach 3 for the west.
Figure 2 shows the six possible phases for the roundabout model. The descriptions of the six phases are listed as follows:
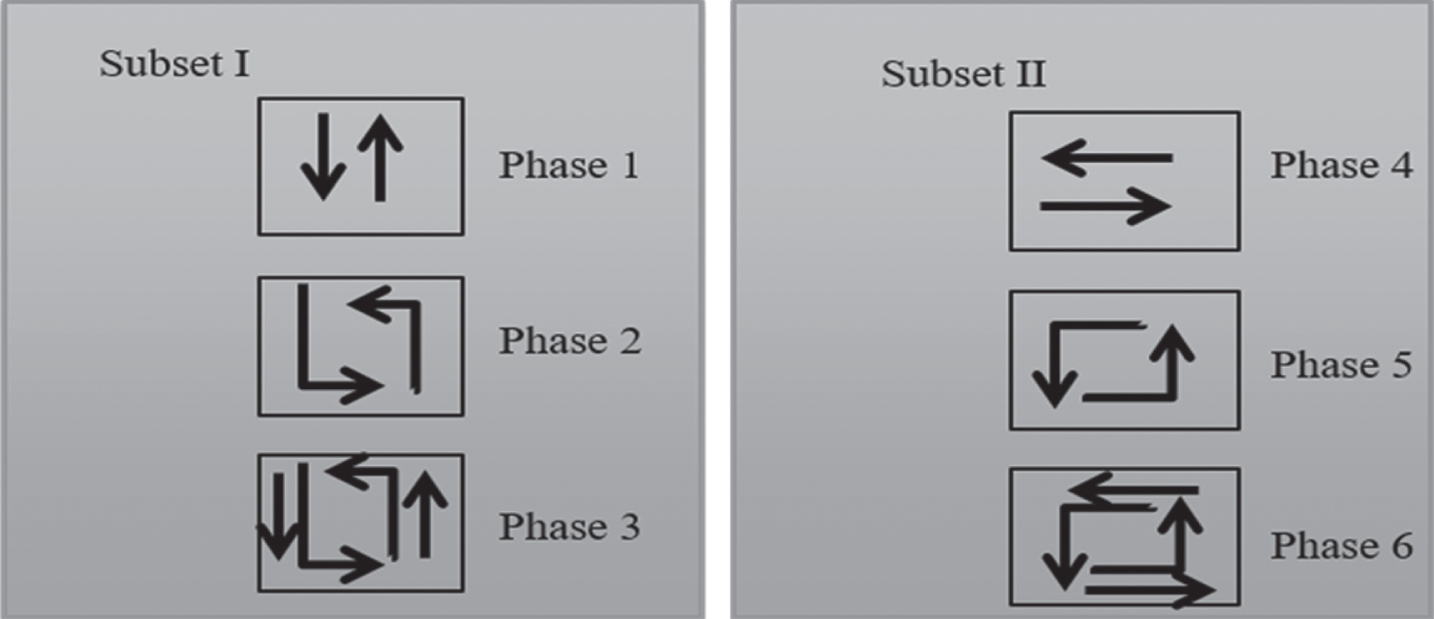
Phase set of four-approach roundabout.
Phase 1: approaches 0 and 2 are activated on only go-through direction.
Phase 2: approaches 0 and 2 are activated on only the left-turn direction.
Phase 3: approaches 0 and 2 are activated on both go-through and left-turn.
Phase 4: approaches 0 and 2 ends, approaches 1 and 3 are activated on go-through.
Phase 5: approaches 1 and 3 are activated on the left-turn direction.
Phase 6: approaches 1 and 3 are activated on both go-through and left-turn.
All right turns do not need signalizing, as this way is always open. In our work, Phases 3, 6 are chosen which means that each signal in the four approaches opens for both go-through and left-turn directions.
Traffic control methods and strategies are divided into fixed-time and real-time control ones. Fixed-time methods use fixed green time for the different phase’s circles, whereas the real-time method uses different variable times for the phases circle according to the traffic conditions. For reducing the risk of traffic jam, all-red time between phases are employed to finish the appearance of vehicles in the roundabout [18, 23].
In the proposed traffic management system, as in Fig. 3, sensors are used to register the speed of vehicles, vehicles enter times and departure times within the approaches, delay time and number of vehicles, passing vehicles and missing vehicles. Fog servers are used to collect data coming from the proposed traffic control strategy; number of passing and not passing vehicles before and after green signal, waiting time of vehicles, etc. These data are analyzed by the fog server to make optimal decisions for minimizing the traffic delay time.

General proposed system.
The proposed system consists of fog clusters; each cluster contains number of vehicles and sensors. The primary function of sensors is to gather data about vehicle such as vehicle position, speed and direction, etc. These data are stored on the distributed fog server, which connect with internet-by-internet connection to interact with these gathered data. Fog server stores, processes data from sensors, and sends them to client output applications as detailed statistics and analysis of work via numerous reports by the help of PSO control strategy to develop an intelligent system to make decisions in real time as decreasing delay time of trips.
PSO algorithm assumes that there is a population, this population has a set of particles in a problem space, and each PSO particle has both velocity and position. Particles are randomly initialized; each particle in PSO has a fitness value, this value is evaluated by a fitness function to be optimized in each generation. Each particle in PSO knows its best position Pbest and the best position so far Gbest. The Pbest of a particle is the best result (fitness value) so far reached by the particle, whereas Gbest is the best particle in terms of fitness in all populations. These steps are repeated for a number of iterations [15]. The sequence of PSO algorithm is described in Fig. 4.

PSO Algorithm.
The particle’s velocity and position are calculated according to Equations (1 and 2).
Where c1 and c2 are specific parameters, which control the relative effect of the personal best particles and global best particles, and ω is the weight of the acceleration terms that pull each particle toward Pbest and Gbest respectively [39]. The personal best position Pbesti and global best position Gbest are calculated in Equations (3 and 4):
Where Fit (x i ): R n → R is the fitness function, i ∈ [1 … , n] and n > 1. The previous steps are applied to all particles, for each approach the fitness function is calculated, then Pbest is the best position that the individual particle i has visited since first time step. The Gbest is the best position discovered by any of particles in the entire swarm and this data are sent to the fog server to make the decision of which approach is activated and in order to pass vehicles in a minimum time.
In our proposed system, Particles are represented as a mapping between approaches and directions; each mapping has a value dependent on a fitness function that minimizes the delay time and minimizes the all arrival times of all vehicles. The particle representation is shown in Fig. 5 where 0,1,2,3 refer to the four approaches in the roundabout and L, R refer to left and right directions respectively. In this strategy, the left direction is the chosen, as right directions do not need permission for passing vehicles.

Particle Representation.
Table 1 describe all the used notations in the paper for PSO algorithm and parameters of traffic rules used to enhance the performance of traffic control system.
Notations
In this paper, PSO is introduced with different traffic rules in fixed and real time using four methods. The trip time is aimed to be minimized and the traffic is organized to overcome the traffic jam and congestion. The PSO sub-controllers presented are PSO-Turn, PSO-Jump, and PSO-Mix. InSection 4, these sub-controllers are presented.
In this section, the mathematical model is presented for the roundabout with PSO control strategy to optimize the efficiency of roundabout.
The particle is represented as in Fig. 5. Equations (5– 7) are used to compute the fitness value of each particle in the proposed control strategy:
Where Fit (x i ) denotes the fitness function of each particle, w1 and w2 are weights used in the evaluation of particles. nMV i and nPV i refers to the number of passing and missing vehicles during green time. nV i is the vehicles number in the approach i as there are 4 approaches; 0,1,2,3 and t g is the time of green light. Finally, VehDelay is calculated as the time between entering the signal and stopping time waiting for pass the approach. The traffic control by PSO in fixed green time is shown in Fig. 6 that needs to call PSO algorithm from Fig. 4 to complete its procedures.
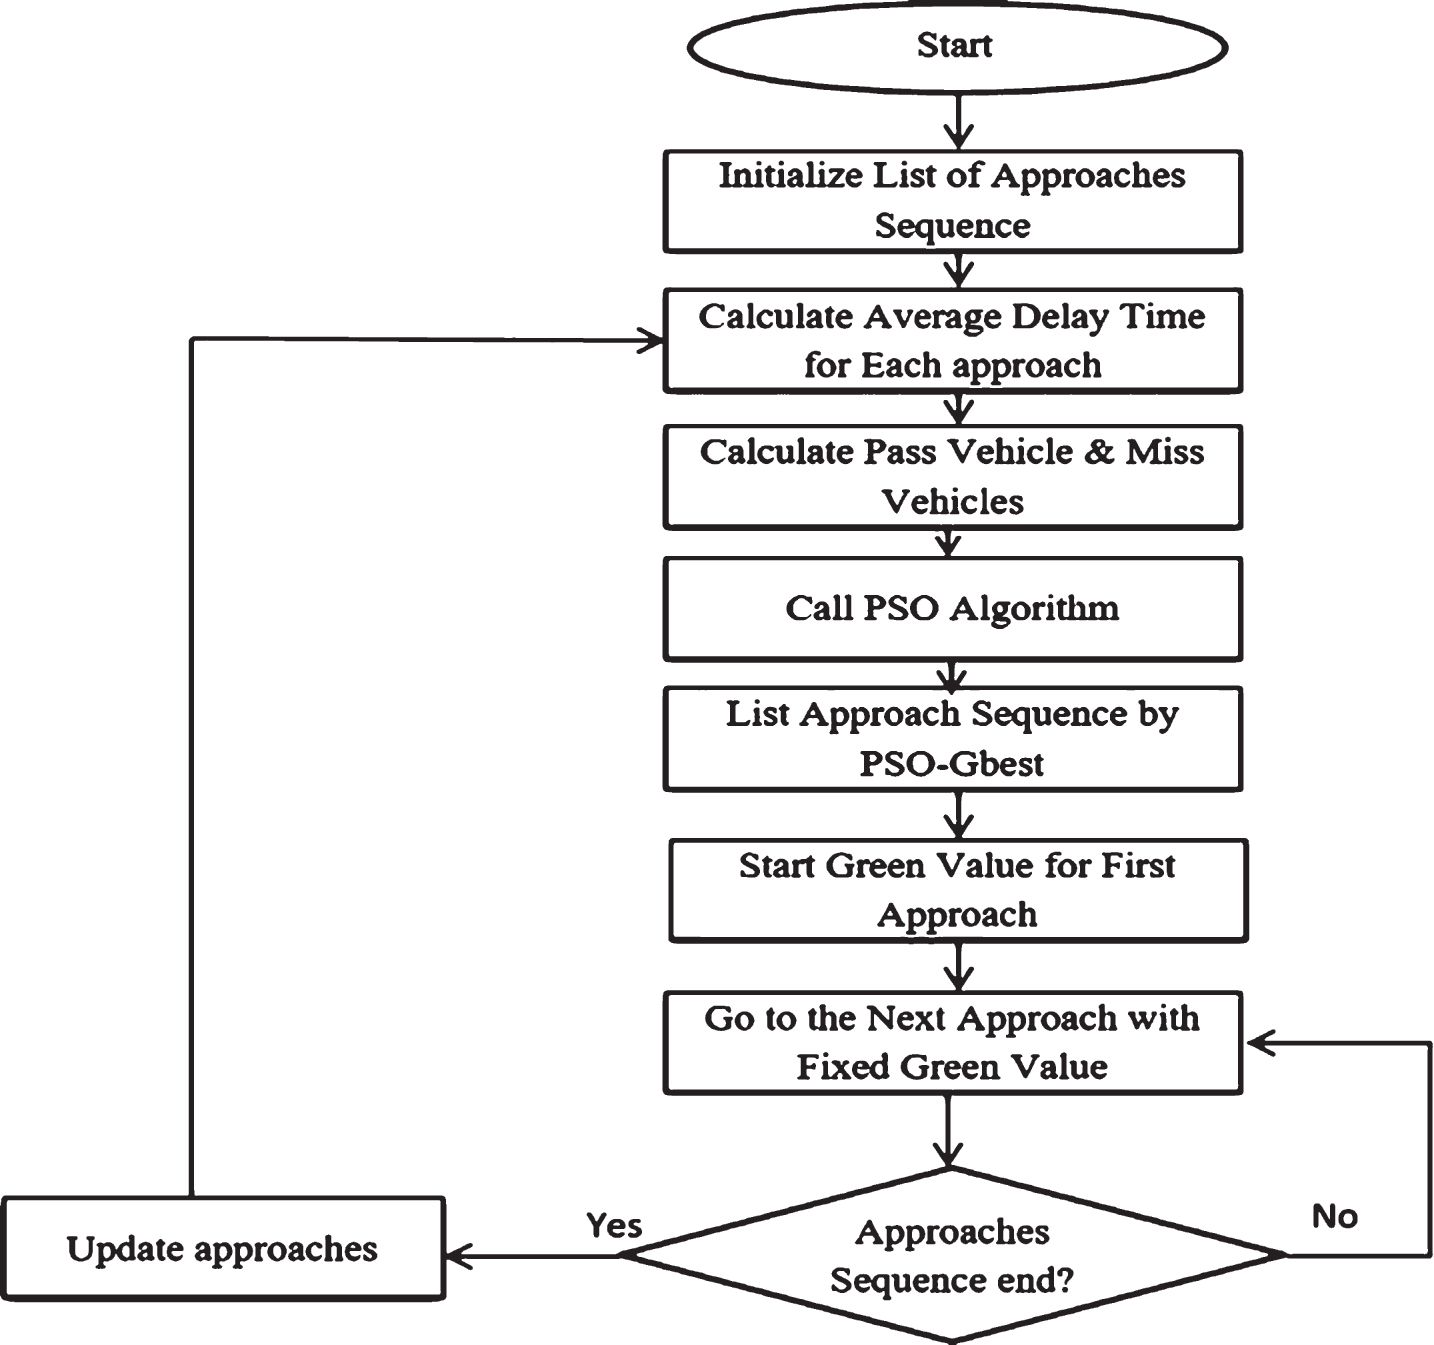
Traffic Control by PSO in Fixed Green Time.
To find the minimization of the fitness function, the following steps are applied to the collected traffic data:
The number of particles is chosen using 7 particles with initial positions in this paper. The initial population (i.e. the iteration number t = 0) can be represented as
Let c1 = c2 = 1, set the initial velocities of each particle to zero;
The values of objective function are listed in column “Fitness Value” in Table 2 by Equations (5– 7).
PSO for real traffic data
The personal best for each particle is get by Equation (3), the values of
The global best for all particles is calculated by Equation (4) as the least personal best of all the swarm.
It is noted that the least value is 0.00000002 and this value is get from different particles with different order:
Particle 5 is selected for Gbest value as it has the least average fitness value. It is noted from the results in Table 2 that particle 5 is best particle in reducing the delay time of waiting vehicles, increasing number of passing vehicles in the roundabout. Therefore, particle 5 is the particle that is chosen to be used in the remaining computations of COTSD-PSO in the different sub-controllers to determine which approaches order is suitable to begin the cycle of roundabout approaches to decrease the overall delay time.
To implement PSO-Mix combination, the PSO algorithm is first presented for traffic system and then the three sub-controller depending on PSO; PSO-Jump, PSO-Turn, and PSO-Mix. PSO-Jump aims to: Reduce the delay time of waiting vehicles; Avoid traffic congestion (queue lengths); and Avoid conflicts at the intersection.
PSO-Turn sub-controller uses streets distance, vehicles speed and whether to turn to the next phase in the running phase subset, which helps to smooth the traffic flows and to avoid traffic jam. PSO-Mix is hybrid between PSO-Turn, PSO-Jump. The proposed COTSD-PSO sub-controllers are described as follows:
Traffic control by PSO-turn
PSO-Turn calculates an extension time (ET) by the end of each phase as in Equation (8).
Where D is street distance and S is vehicle speed [47].
If ET is larger than a known threshold value, the green time for current phase continuous for another ET period. Otherwise, the current green phase is terminated and an initial duration Θ is assigned for the next phase in phase circle. PSO-Turn can extend the extension time and decides whether to turn to the next phase in the running phase subset to smooth the traffic flows and to avoid traffic jam. Flowchart of Traffic Control by PSO-Turn is described in Fig. 7.

PSO-Turn Controller.
PSO-Jump computes the urgency degree (UD) of each phase to extend it for another period Δ. Then the phase with largest UD is activated. The waiting time and the queue length are used to determine the urgency degree separately for each phase as shown in Equations (9– 12).
Where UD is the urgency degree for each phase or approach, We is the total waiting time (the duration of time that vehicles have waited in the queue), and Qe is the phase queue length (the number of vehicles in a phase during a red light phase). UD n xtph is the urgency degree of the Next phase to determine the phase to be given the next green signal, UD (i) is the urgency degree of each individual phase constituting the intersection and n is the number of the phases considered [21]. Figure 8 describes the flowchart of PSO-Jump controller.

PSO-Jump sub-Controller.
The PSO-Mix combination consists of two layers; the outer layer and the inner layer. The outer layer is a PSO-Jump sub-controller and the inner layer is a PSO-Turn sub-controller. The PSO-Jump sub-controller computes the UD of the two-phase subsets, as the phase set can be divided into two subsets according to the direction (north-south from approaches 0 and 2 and west-east from approaches 1 and 3). If the current running subset has a larger UD than the other subset, the inner layer is activated. PSO-Turn computes the ET of the current green phase. If UD is smallest, then all-red time is activated to clear vehicles in roundabouts. On the other hand, the phase is kept unchanged if ET is larger than Φ; otherwise, the next phase is activated and initialized with Θ time units. Figure 9 describes the flowchart of PSO-Mix. The idea of this sub-controller is to always jump to the phase, which is in the most urgent so as to improve the real-timeliness.
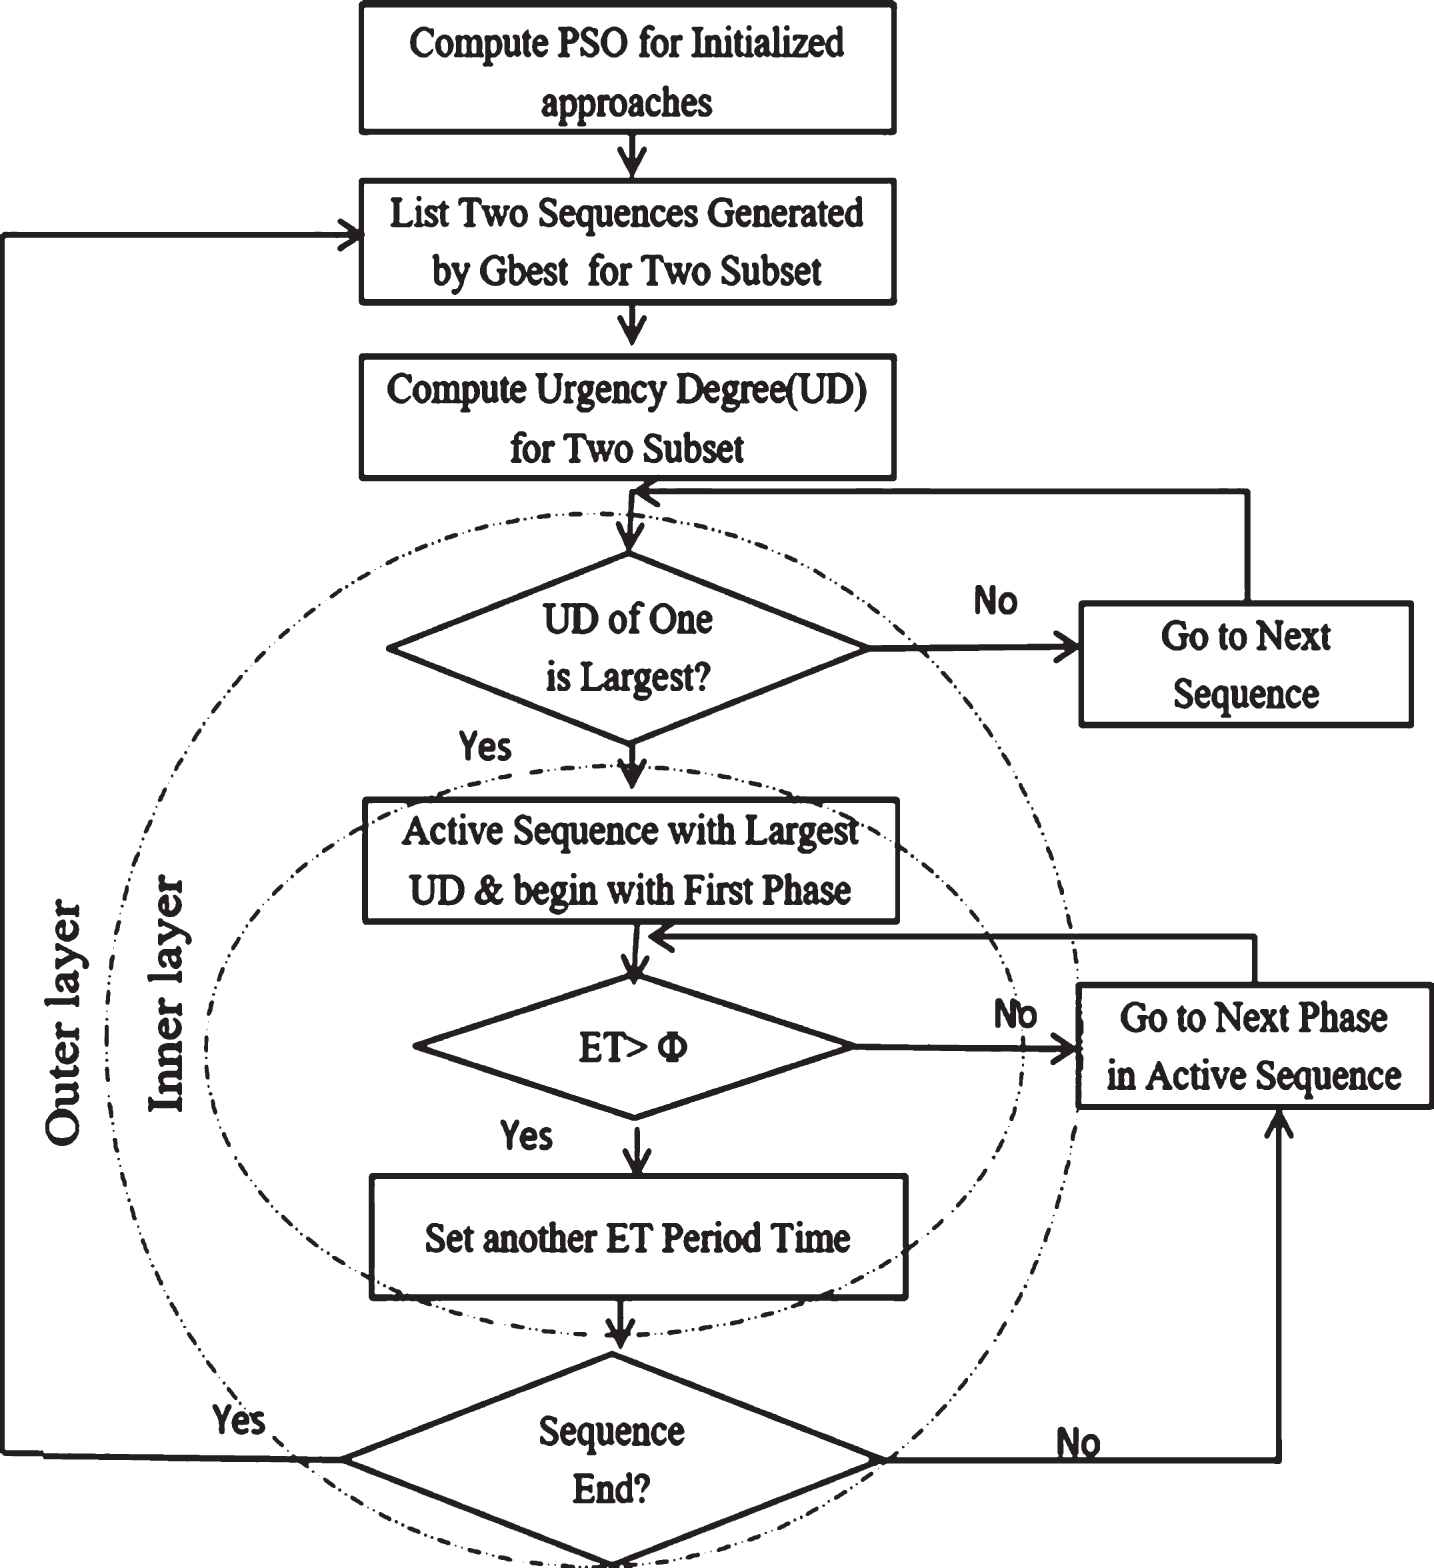
PSO-Mix combination.
In this section, the results are presented and the COTSD-PSO with the different sub-controllers are implemented. The proposed COTSD-PSO has been written by java programming language using eclipse program in Intel(R) Core(TM) i7-5600u CPU in 2.59 GHZ and 8.00 GB of RAM. The experimental setup of the PSO algorithm considers that the iterations = 20, and the number of execution = 30.
Evaluation of PSO algorithm
Our proposed system depends on real data (case study from Taif streets in Saudi Arabia country), these real data with the calculated values is presented in Table 2, while Pbest values for different particles are shown in Fig. 10. Only sample of 7 particles are chosen as the remaining particles has no big difference in data from the first 7 particles.
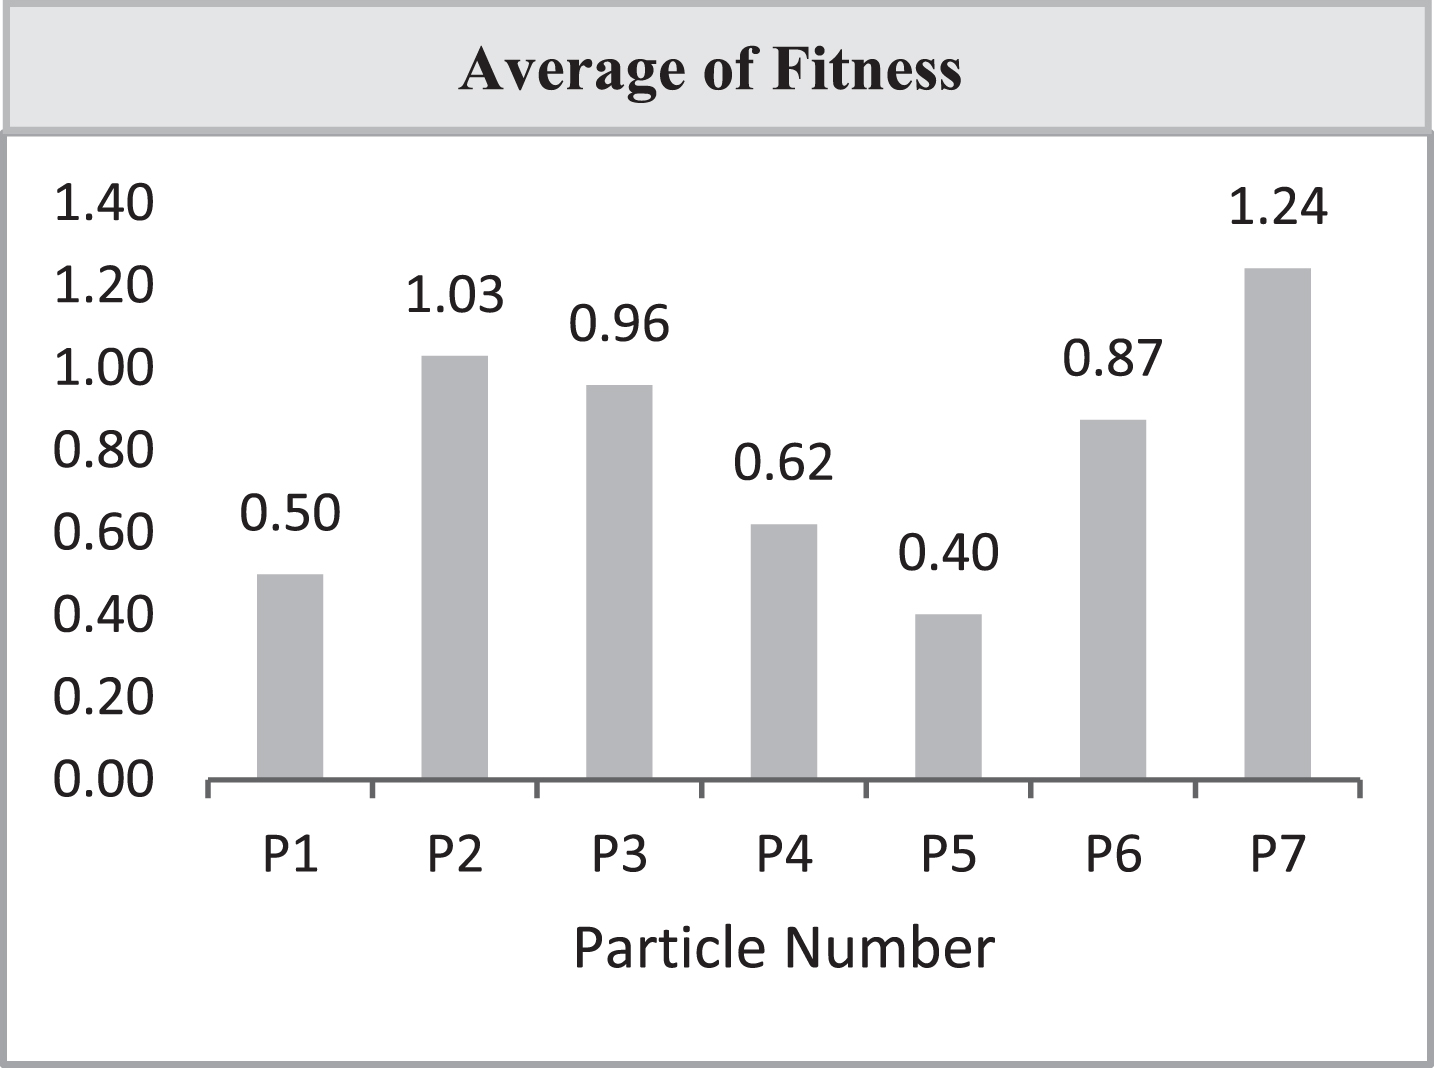
Fitness values.
From Fig. 10, it is noted that particle 5 (P5) achieves the least fitness value according to the fitness function and this value is assigned to Pbest in the first iteration, After a number of execution times, the Gbest value is calculated as the least Pbest from all Pbest values. Finally, the Gbest value, which refers to the best mapping of approaches and directions with the least travel time, will be applied. Fog server uses the Gbest from PSO control strategy and sends order to the traffic network to open the signal that achieves least delay time.
Table 3 describes the best sequence obtained by PSO algorithm. Cycle time or the cycle length is the time in seconds that a signal takes to complete one full cycle of indications (red, green, yellow) as in Equation (13).
Gbest sequence for the optimal solution
Where tg, tr, ty are cycle times for green, red and yellow signs calculated using Equations (14 and 15).
PSO algorithm applies the traffic flow using fixed real times, as green time ranges between 20–60 seconds, yellow time ranges between 0–5 second, and red time ranges between 30–40 seconds.
Using the speed of vehicles and the distance of the street, the red times are calculated according to Equation (12), these times are shown in Table 4 and these red times are used later to measure the performance of different controllers.
Duration of Red period intervals
Where W is the Width of intersection in feet, L is the length of vehicle in feet (typically taken as 20 feet), S is the speed on the approach in feet per second.
The variation of signal times of each approach with the three signal colors according to Table 3, is showed in Fig. 11.

Percentage of traffic signal times.
Figure 11 lists the signal times for each approach with the two left and go-through directions, as right directions pass directly without signal. The Final result of PSO control strategy is sent to fog server which organizes the signals of the four approaches by the order of Gbest with the shown signal times (green, red, yellow). The varied signal times are described in section 5.2 with the discussion of PSO-turn and PSO-Jump.
The idea of PSO-turn sub-controller is to check if the signal of current approach is turned to another approach according to a predefined threshold. PSO-Turn uses the extension time as shown in Equation 6. The extension times of green times is shown in Table 5. PSO-turn first calculates the minimum green (G) as in Equation (13) and then the extension time is added to the minimum green to get the total green value which is compared with the predefined threshold.
Extension times
Extension times
Where n is the number of vehicles between stop line and nearest upstream detector in one lane, n = d / 25 and d is the distance between the stop line and the downstream edge of the nearest upstream detector (in feet), 25 is the average vehicle length (in feet) which could vary by area.
From Table 5, each minimum green is added to the extension time if the extension time value is greater than the predefined threshold value, then the final green value that appears in the traffic signal by the fog server is the sum of previous green time and initial duration time. In our experiment, threshold >5 and initial duration = 10.
Lost time per phase is the startup time plus the clearance lost time, which is a portion of the all-red interval and the yellow interval [40]. The lost time calculation is shown in Equation (16).
Where ts is the start-up time (usually 2-3 sec) and td is all-red time to clear the signal from vehicles, is 5 sec.
Table 6 describes the lost time with the different cycle lengths applied to each approach (Gbest sequences), and Fig. 12 shows the relationship between cycle time and lost time.
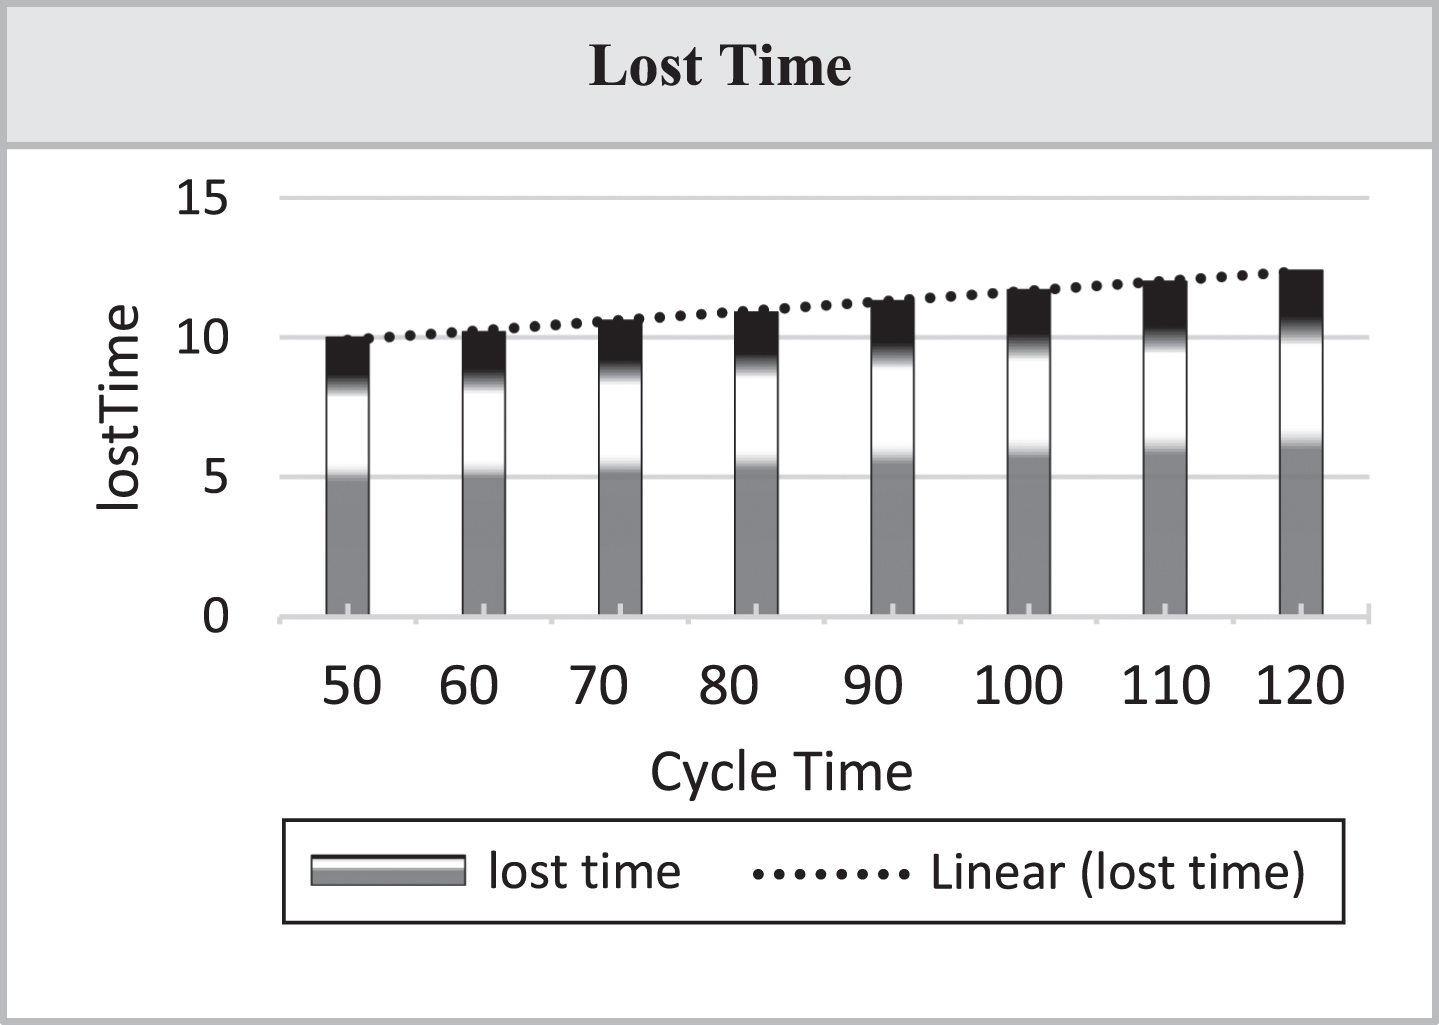
Lost time & cycle length.
Lost times
The lost time is calculated as all-red = 5 sec, the startup time (usually 2-3 sec), the yellow interval (usually 3–6 sec).
In general, PSO-Turn calculate the minimum green time that allows all vehicles queued beyond the detectors to enter and pass through the signal. The goal of calculating the lost time is to minimize the loss of unused green durations per cycle specially peak-hours.
PSO-Jump uses the urgency degree that is concerned with two input variables; waiting time to reduce the delay time and queue length to avoid traffic congestion. The urgency equations are listed in Equations (9 to 12).
In our experiment, the ranges of used parameters are; the waiting time between 0–500 seconds, queue length between 0–300 vehicles, the threshold waiting time was two minutes (120 seconds), the threshold queue length was 34 vehicles for double-lane phases and 17 vehicles for single-lane phase. Double-lane means the road with two lanes, and single-lane means the road with only one lane.
The urgency degree for Gbest approach for double-lane and single lane is presented in Table 7. It is noted that approach1 is selected as the next phase to be green as it has the largest urgency degree. Approach1 is followed by approach0, approach3, approach2 for single-lane. And for double-lane, the new sequence is; approach1, approach0, approach2, approach3.
Urgency degree
Urgency degree
Figure 13 describe the relation between the waiting time (WT) and the queue length (QL) to determine which approach to start with according to the urgency degree (UD). The value of UD is increased according to both waiting time and queue length, particularly the queue length for single-lane road and the waiting time for double-lane road.

Waiting time & queue length.
The results obtained indicates that the PSO-Jump sub-controller effectively selects a phase to be given next green signal after considering the traffic situation of number of vehicles and its waiting time to avoid traffic congestion.
The PSO-Mix combination is a hybrid of PSO-Turn and PSO-Jump. PSO-Mix uses the both two parameters; the extension time and the urgency degree. The PSO-Mix is presented in Table 8.
Best sequence in PSO-Mix
Best sequence in PSO-Mix
Table 8 calculates the urgency degree and the extension time and then checks for the larger urgency. If the extension time (ET) is more than the threshold that equal to 5 on our experiment, then extend to another period. The new sequence is ordered by the larger mix value. So the new sequence with the new extension time for double-lane is: Approach 1, Approach 0, Approach 2, Approach 3 and for single-lane is; Approach 1, Approach 0, Approach 3, Approach 2.
The relation between urgency degree and extension time is showed in Fig. 14.
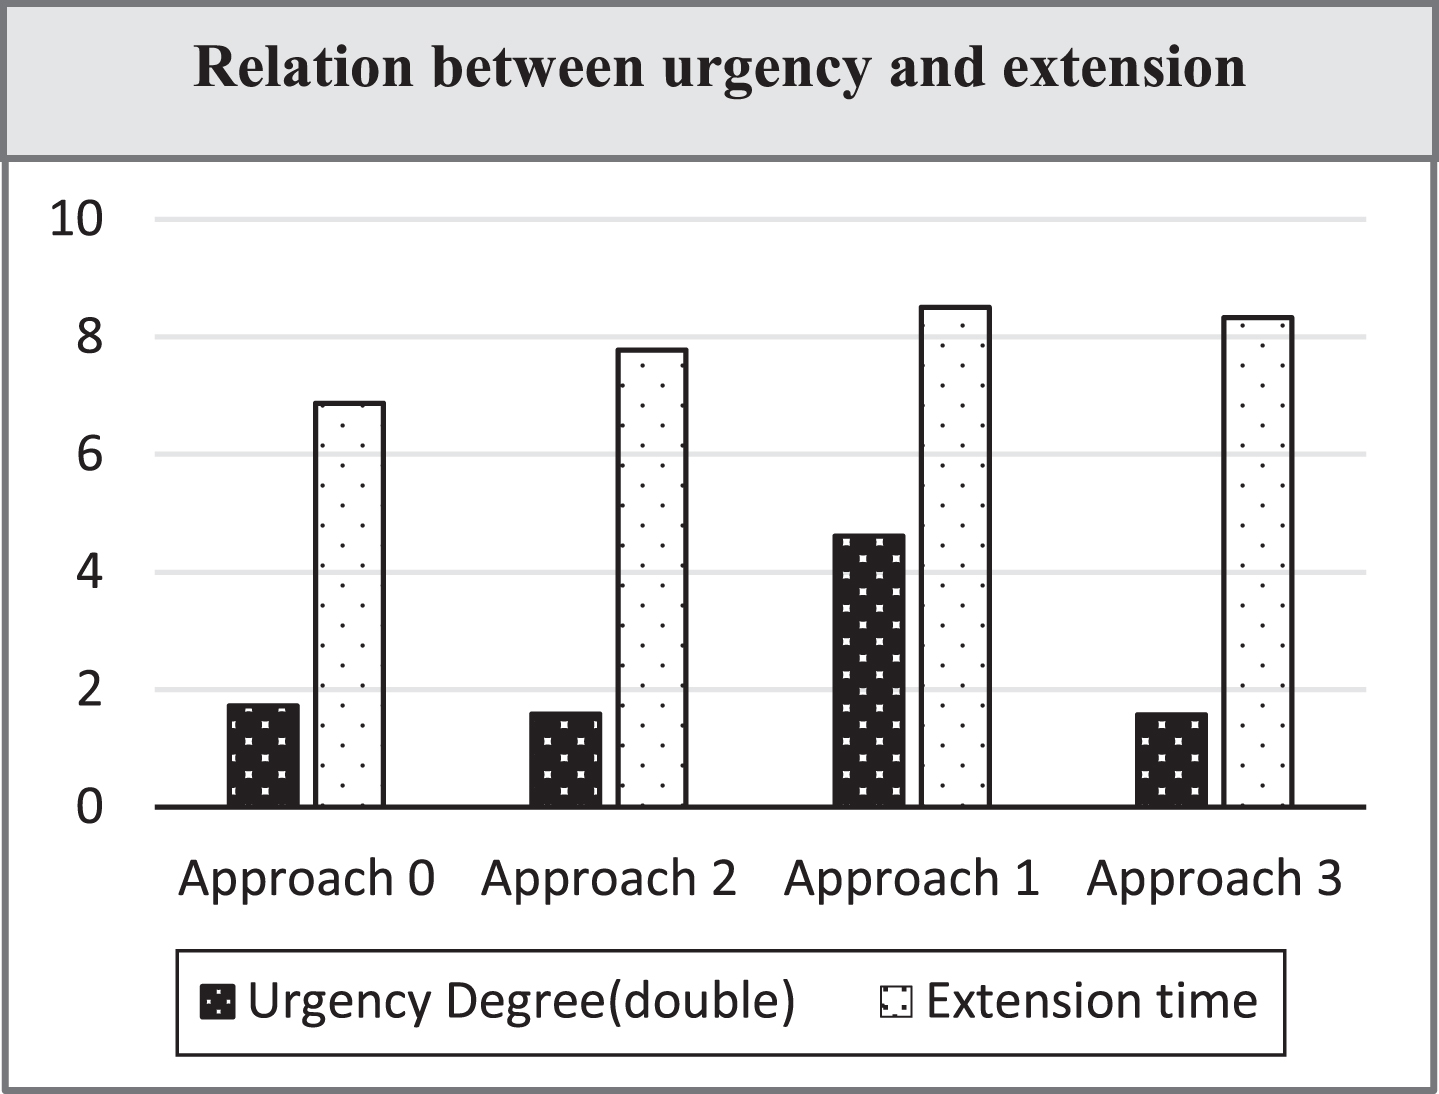
Urgency degree & extension time.
From Fig. 14, the extension time will be perfect for single-lane road& the urgency degree is more suitable for double-lane road.
The comparisons between the different sub-controllers of COTSD-PSO is discussed in next section.
Performance
To compare between PSO-Turn, PSO-Jump and PSO-Mix, the average delay time is used as in Equation (17). As the average delay time of vehicles is computed to improve the performance of the logical controllers [11].
Where tr is red time, c is cycle length and p is arrival rate/departure time.
According to our experiment, dmax is calculated as in Equation (18), which is the maximum delay time to compare between sub-controllers of COTSD-PSO. The difference between delay times is described in Tables 9–11.
Delay time for PSO-Jump
Delay time for PSO-Turn
Delay time for PSO-Mix
From the previous results, it is noted that PSO-Mix combination is better combination as it minimizes the average delay time, with percentage of 21% from PSO-fixed time. These results optimize the management of traffic system.
Table 12 is used to analyze the performance of COTSD-PSO control strategy with the urgency degree, the extension time and the mix between the urgency and the extension time.
Average delay time of T-PSO
Reducing the vehicles delay time can expand road resources, and increase the transport efficiency, so the average delay times of proposed COTSD-PSO with the previous methods are compared in the same field. Pengzhe Zhou and others made comparison between different algorithms to reduce the average delay time [31] as shown in Table 13. It is noted that COTSD-PSO is more efficient in reducing average delay time especially PSO-Mix, which achieves the least average delay time, compared with the traditional methods of timing control. Therefore, this algorithm adjusts the traffic signal timing scheme of roundabouts dynamically according to traffic flows on roads.
Average delay time of different timing methods
Average delay time of different timing methods
This paper presents a real-time traffic control strategy for roundabouts on fog computing environment. The proposed COTSD-PSO is a control strategy for optimized traffic signal design that based on PSO with three sub-controllers; the PSO-Turn, PSO-Jump and PSO-Mix methods. The COTSD-PSO aims at achieving two objectives: minimize the delay time and minimize the overall travel time. From results, PSO-Mix minimizes the delay time in the traffic network and it is very effective in improving traffic efficiency of the roundabout. Short cycle length achieves the best performance in terms of lowest overall average delay. Longer cycles are used to provide more green time during peak periods. The presented control strategy COTSD-PSO can reduce the occurrence of certain types of crashes or traffic jam because of the less delay time followed by rabid transport.