
Abstract
With the advent of IoT, cloud/fog based healthcare systems have become a growing trend in modern healthcare systems. These systems comprise of smart sensors, which on integration with medical devices, generate heterogeneous medical big data that can be used in diagnosis of various diseases. However, there is a continuous flow of large quantity of data in such a systems, due to which it may face many difficulties. Among various pre-requisites for proper functioning of these systems, lifetime is a vital factor. Keeping in view these aspects, the use of new hybrid whale-PSO algorithm (HWPSO) in clustering has been proposed for prolonging the network lifetime by preserving the power of network edge devices. In addition to this, a novel fitness function with a set of relevant criteria of edge devices such as energy factor, average intra-cluster distance, average distance to cluster leader over data analytics center, average sleeping time, and computational load has been taken into account in the selection of cluster leader. The cluster leader is responsible for managing intra-cluster and inter-cluster data communication.
Introduction
Internet of Things (IoT) has revolutionized the life of human beings through its ability of aggregating numerous data, decision making and several other activities. The word ‘things’ in IoT refers to devices such as sensor, software, actuator, hardware, etc. which can be used in various application areas. It forms a competent connectivity between nature and digital world without any human intervention. In this new world of data, IoT architecture is quickly expanding and plays a significant role even in cloud computing. It acts as an igniter to fresh ideas in the prevalent computing technology. Both IoT and cloud have immense influence on urbanization and can transform cities into a well-efficient digitized place. This can be effective in the development of various application areas such as smart homes and buildings [1], smart agriculture [2], smart health-care [3, 4], intelligent transportation [5, 6], security and sustainability, waste management [7] and energy management [8] etc. However, IoT has several fundamental issues with regards to performance and management. As the devices and sensors configured for data collection in IoT are mostly battery driven, so each device requires some amount of energy during the transmission time which may lead to a smaller network lifetime. Furthermore, the failure of an IoT device may cause critical data loss. As a result, to perpetuate the network lifetime, a healthy relation is required to be maintained between data transmission and battery energy.
In the healthcare sector, the use of IoT can make it more robust and competent. IoT has been employed in various medical applications which includes remote health monitoring and chronic diseases etc. [4]. Moreover, it has the potential to provide treatment and medication at home through the use of medical devices, wearable sensors, diagnostic and imaging devices. Thus, IoT technology can make the traditional healthcare smarter and can alleviate costs, increase the quality of life, and enrich the user’s experience as well. In an e-Healthcare system, IoT devices and sensors collect the data from various patients regarding various parameters which can be used in analyzing the patient health condition and thereby take necessary actions against it. Thus, the continuous monitoring of patients through numerous sensors and devices is of prime importance. In this regard, the edge/fog computing has the potential to gear up the healthcare industry by providing better and faster health services to the patients. In healthcare systems where every second is crucial, the edge computing can be helpful to reduce the time between data capture and analytics in a powerful manner. In edge computing, the network edge devices are configured in such a manner that they can handle critical analysis and make necessary decisions instead of sending the captured health data directly to the cloud. However, lifetime of the edge network is a critical factor and thus a stable efficient network architecture has to be designed to achieve the above mentioned goal. So, clustering of edge devices into distinct clusters can be a proficient way of improving energy efficiency of the network, thereby providing health services for a long time. Cluster head based communication is a commonly followed method in wireless sensor network (WSN) for prolonging the network life time. This paper also addresses the clustering protocol like WSN but for the edge device network. In WSN the clustering is performed locally in the network whereas clustering in edge network can be considered as globally in the network. Furthermore, clustering in edge devices enables distributed edge analytics. It has an added advantage of having faster and real-time analysis of data in any large geographical region. This leads to a faster fault response time.
In this paper, a fog layer configured e-Healthcare architecture, consisting of a pool of micro data center (MDC) as edge devices has been proposed. These micro data centers are entrusted with the responsibility of temporary and frequent processing of data and are deployed in various areas depending on the data collection needs. Every MDC is connected with some smart sensors or devices and are used to acquire health information of patients and transmit it to the cloud. As it is battery operated, there is a chance of network failure and hence may cause an extremely crucial health data loss. So, to overcome this, an energy efficient MDC network has been designed that may improve the overall lifetime of the network as well as the transmission time.
The key contributions of the research are as follows: A fog layer configured e-Healthcare model and strategy equipped with energy efficient edge devices has been designed. A fast hybrid meta-heuristic algorithm named hybrid whale-PSO algorithm (HWPSO) has also been employed that partitions the network into distinct clusters of participating edge devices within the network in such a way that each cluster will have equally good fitness. The goodness of the employed strategy over other state of the art methods for prolonging the edge network lifetime has also been studied. A novel fitness function associated with all the necessary criteria has been proposed for optimization of the edge network and selection of most promising edge devices in each cluster. This process determines the life of cluster as well as the whole MDC based healthcare network.
The rest of the paper is organized as follows: Section 2 addresses the background related to this research. Section 3 presents the related research works in the relevant field in detail. The proposed energy efficient clustering technique has been presented precisely in Section 4. Section 5 presents results and analysis part of this research. The paper has been concluded in Section 6.
Background
Hybrid whale particle swarm optimization (HWPSO)
The HWPSO algorithm is a population based hybrid meta-heuristic proposed by Laskar et al. in 2018. [9]. It is an improved variant of PSO algorithm and utilizes the search mechanism of WOA, so as to remove stagnation effect. The search mechanism consists of two characteristics: position and velocity, similar to a PSO algorithm. The hybridization mechanisms consists of three unique process: iterative hybridization, ‘Forced’ Whale and ‘Capping’ Phenomenon. Iterative hybridization comprises of two types of iterations: primary, in which PSO works. The position update for the particles are as per equation (1) and (2).
P best : Particle local best position.
G best : Global best position of the swarm.
Within the primary iterations, there are secondary iterations, in which WOA is working. The position update for the search agents are as per equation (3)-(10).
During exploitation phase, considering shrinking updating method,
X*: Best position vector.
Where
Another approach is Spiral Updating Method, where
Where b is a constant which defines the shape of logarithmic spiral and l is a random number € [0, 1].
During exploration phase,
Where
In HWPSO, the co-efficient a and a2 is made to dependent on secondary iterations based on equation (11) and (12). This is called ‘Forced’ whale.
Where, it is current iteration and im2 is maximum number of secondary iterations.
The number of secondary iterations is dynamically decreasing with increase in primary iteration as per equation (13). This is called ‘Capping’ phenomenon.
The algorithm begins with initialization of particles based on PSO in primary iterations. In the exploration stage, ‘Forced’ Whale technique is employed in secondary iterations to fine tune the solution obtained using PSO, so as to avoid stagnation effect. The ‘Capping’ phenomenon is used in exploitation stage and is realized for secondary iterations. It imposes a restriction on the WOA search mechanism during exploitation, thereby leading to faster convergence of the solution. A more detailed description of the working of this algorithm can be studied from Laskar et al. [9].
AHP is a powerful and robust multi-criteria decision making (MCDM) technique that is largely applied in complex decision making. It is basically based on pairwise comparisons where disintegrating the problems into a hierarchy of factors and criteria is done. It is also treated as an effective tool which helps in deriving weights for each evaluation criteria using matrix-oriented methods according to the decision maker’s pairwise comparisons of the criteria. The higher the weight, the more important the corresponding criterion. At the end a final score is achieved for each criteria through relative weights aggregation of the decision elements.
Related research
This section provides a survey of different energy efficient techniques used for several IoT enabledsystems.
In 2014, Gubbi et al. [10] presented a detailed description of IoT and its various possible applications. The authors highlighted the need for energy management in IoT application areas and also proposed several possible solutions of energy sources for it. After this, lot of ideas related to this issue have been suggested till now. In 2014, “energy-efficient index tree” was proposed for energy saving of a pool of geographically distributed sensors [11]. It is basically a tree based architecture proposed to save energy utilized for data acquisition, aggregation etc. by the sensors. Similarly, in 2014, Tang et al. [12] proposed another tree-based model which involved partitioning of IoT region into several hierarchically organized grid cells which form a tree. The data transmission was restricted in such a way that sensors will only transmit data if any changes occur in the currently detected value as compared to the previously sent value. In 2017, Kaur et al. [13] proposed a hierarchical layer based mechanism for enhancing the IoT energy efficiency. In this approach, the layers exchanged energy-related information between them for the prediction of sleep interval of sensors on the basis of their remaining battery level and previous usage history. The cluster-based approach is one of the most followed approaches for resolving the energy consumption issue in IoT network and increasing the network lifetime. By using a suitable clustering approach, the average transmission distances of sensors can be reduced effectively. Researchers also tried to improve the battery energy efficiency by configuring the sleep interval of the IoT devices [14]. Their approach allowed the node to keep in sleep mode until an event is triggered. In 2015, Chang [15] presented a strategy where the sensors residual energy and the center of gravity were considered for appropriate cluster head selection. In 2015, Rani et al. [16] recommended a hierarchical network structure for deployment of IoT devices with high scalability feature. In addition to this, authors also introduced a concept of using cluster coordinators for balancing load on both cluster heads and coordinators. Additionally, an energy efficient transmission algorithm for the implementation of an optimal model was also carried out in their work. In 2015, Aazam et al. [17] highlighted different problems associated with IoT and introduced a term CoT (Cloud of Things) which used cloud computing mechanism for helping IoT to attain its goals and for resolving the issues. In their approach, authors also introduced a smart gateway along with the fog computing based framework for providing better and fast service provisioning, data trimming and pre-processing. Researchers also used various optimization algorithms in different ways for the improvement of energy-related issues in networks. In 2015, Bagula et al. [18] suggested a role-based clustering model where every sensors role in cluster were decided based on its residual energy at a different point in time and the service intensiveness of that node. A similar approach related to service and energy-aware clustering of sensing nodes were proposed by another group of researchers [19]. In 2016, Akgul et al. [20] proposed a concept of smart and self-configured sensors which has the capability of putting itself into sleep mode and active mode based on requirement. In 2016, Orsino et al. [21] stated that Long Term Evolution-Advanced (LTE-A) could play a vital role in IoT that can provide large infrastructure and a broad range of connectivity to the devices. But a large amount of data transfer consumes a huge amount of energy. Keeping this in mind, they suggested the use of network-assisted Device-to-Device (D2D) communications as a solution in which a single IoT device will act as an aggregator of all data coming from a cluster of devices. In 2017, techniques for clustering of IoT devices and cluster heads selection for the responsibility of data transfer to the base station was proposed [22]. For cluster head selection, a hybrid gravitational search algorithm with artificial bee colony optimization approach was used. Parameters namely, Distance, energy, delay, load etc. were considered in the approach. Song et al. [23] in 2017, proposed a hybrid approach where quantum particle swarm optimization (QPSO) and improved non dominated sorting genetic algorithm (NSGA-II) was formed for an energy efficient IoT network. A multi-objective optimization environment for a better quality of service as well as an improved network lifetime was considered. Authors suggested a device interaction aware clustering model which can work well for heterogeneous IoT systems in which all participating devices were configured with varied processing capabilities, energy, and bandwidth. In the proposed approach, the cluster heads were selected based on residual energy along with the proximity to the devices. In 2018, Van et al. [24] proposed an energy efficient clustering protocol using fuzzy inference system considering residual energy and the current position as the parameters. They implemented two protocols named Enhanced-LEACH and Fuzzy-LEACH based on the threshold value and fuzzy inference system respectively.
Proposed method
System model
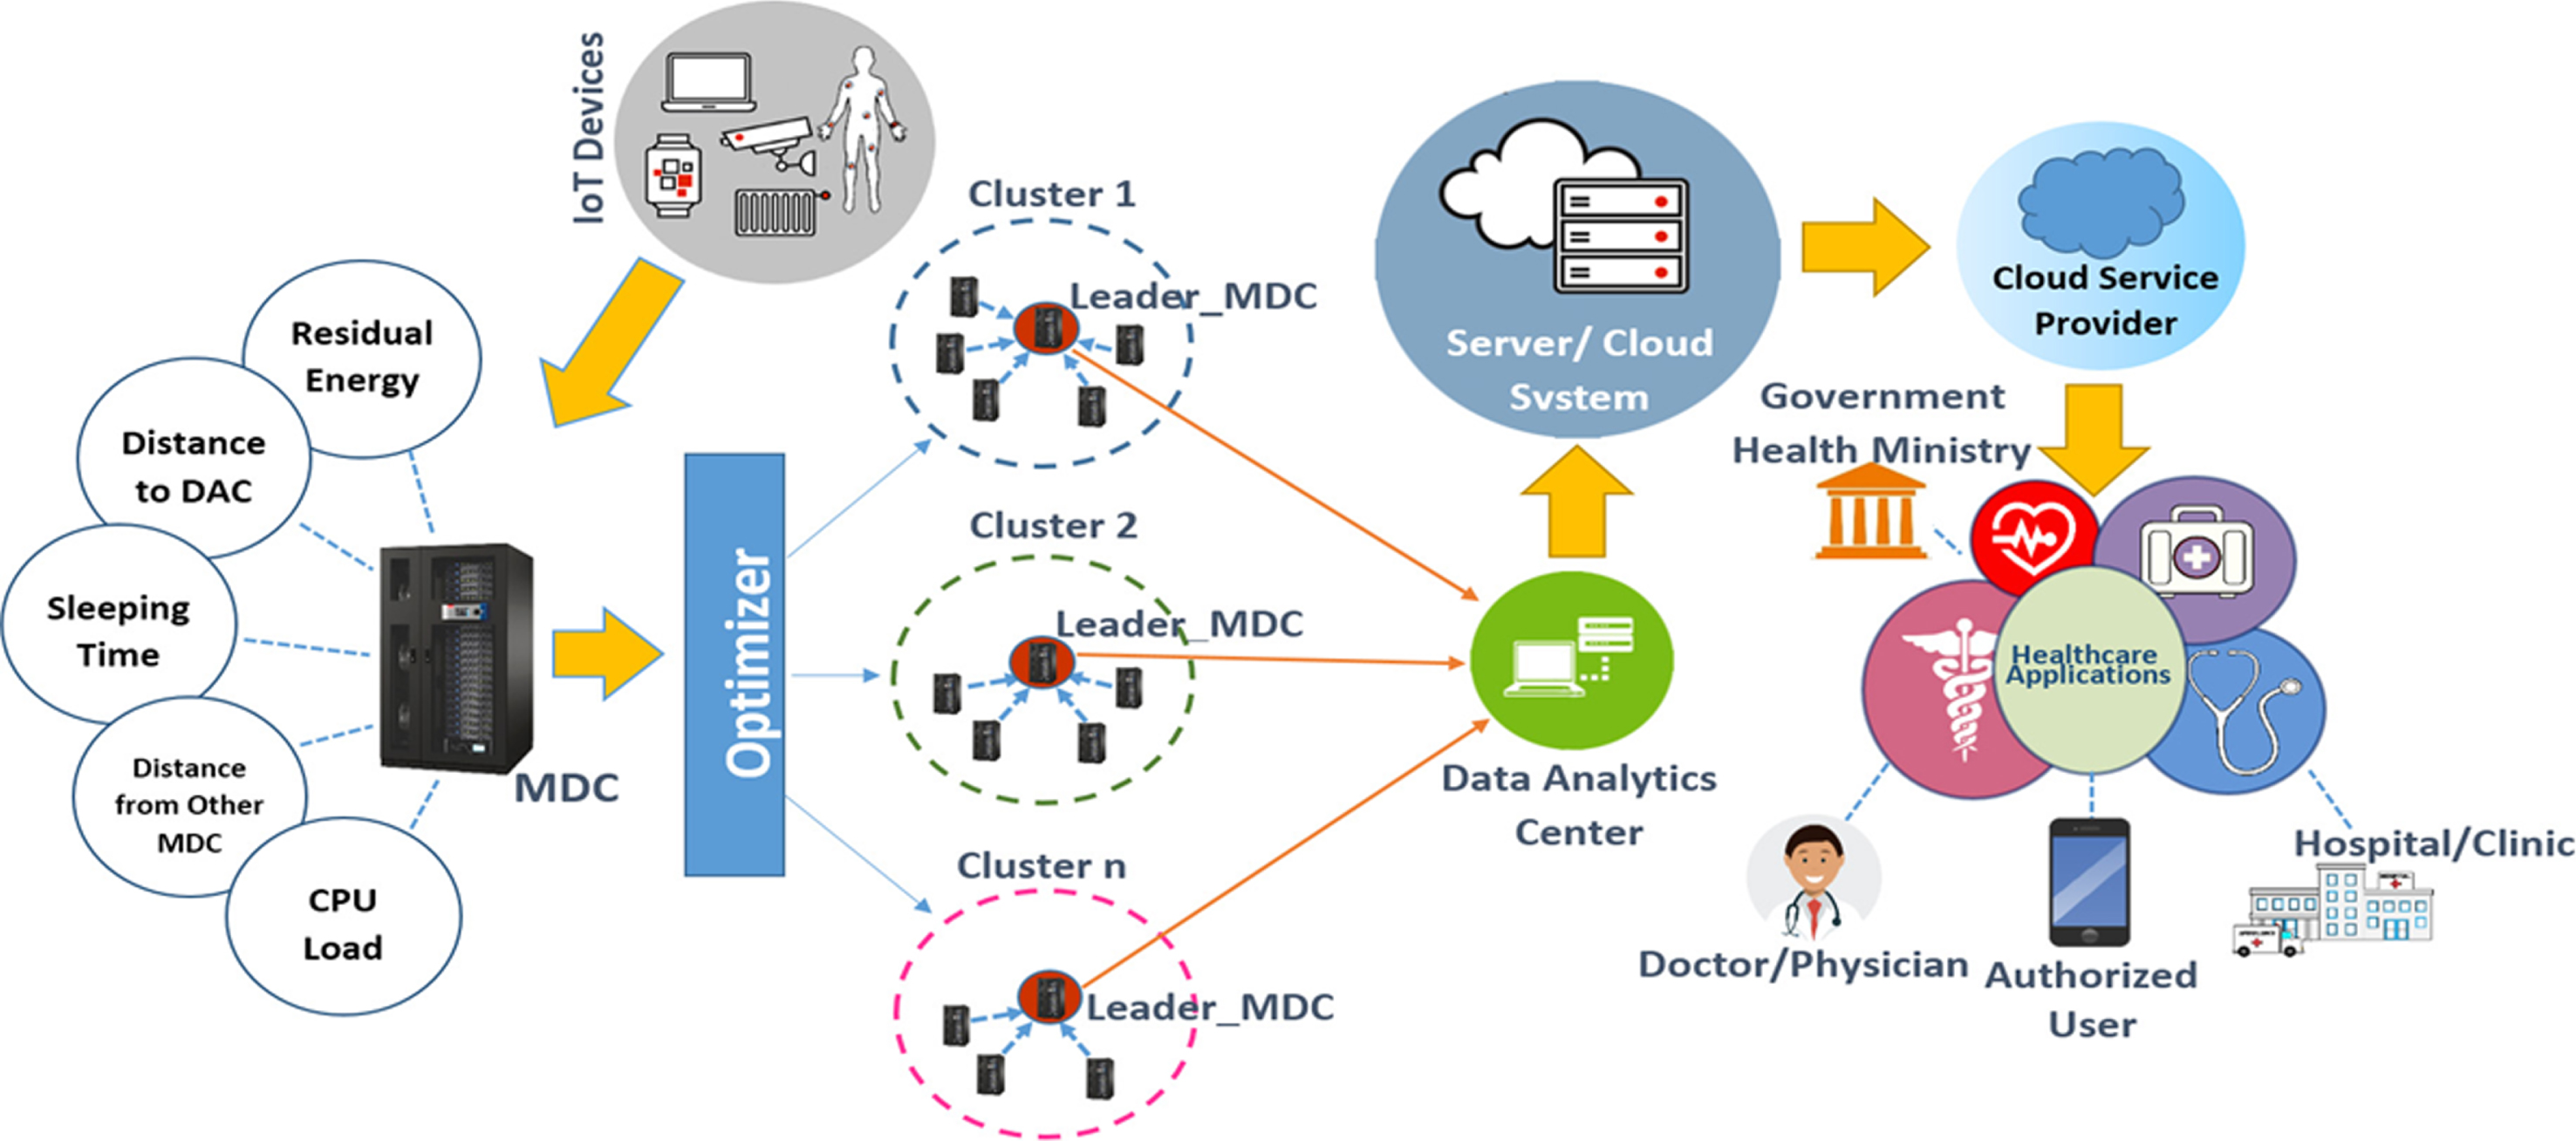
Figure 1 depicts the architecture of proposed energy efficient e-Healthcare system. The proposed model is comprised of five components namely IoT devices, micro data center, data analytic center, cloud server, and application user. IoT devices: In healthcare systems, Internet of Things (IoT) is generally termed as Internet of Medical Things (IoMT) which are actually the collection of wirelessly connected electronic devices that are capable of capturing and transmitting medical big data in real time through online computer networks. The captured data may be in various forms like electrocardiograms, temperature, heart rate, blood pressure, blood glucose level, breathing and more. An IoT device may also have enough intelligence to be active itself automatically while triggering certain events. Micro data center (MDC): A micro data center is a ruggedized modular unit which is ideal for edge deployments and responsible for solving different problems or handling different workloads at the edge of the network. MDCs are principally designed for deployments in more remote locations such as disaster-stricken or war-torn areas around the world. It is expected that in future edge market will boost demand for micro data centers. In the proposed system, each MDC has been associated with a significant number of IoT devices or sensors within a geographical area and deployed under a fog layer. As different IoT devices transmit data in different forms, thus in the proposed model, each MDC is responsible to prepare those collected data in a suitable form for processing and transmit it to the cloud server for further analysis. In the proposed system model, a group of MDCs act as a set of fog layer edge devices that have been distributed within predefined positions under proper observation by confirming a continuous and efficient health data delivery. A MDC can be classified as either trigger based or periodic. The trigger based MDCs transmit data only when an event is fired while periodic MDCs collect and transmit data at regular intervals or on request. Data analytic center (DAC): A data analytic center has the potential to do big data analysis such as, data mining, visualization, decision making, generating new perspectives on complex problems etc. In the proposed healthcare system model, the DAC gathers an enormous amount of health-related data from lots of IoT devices through the edge network. Besides, it concocts further analysis upon it and stores it on the cloud server for future uses. Here, a DAC has been appointed for clustering and cluster head selection process in the edge network. It summons all the real-time attributes of the MDC and performs optimization to decide the cluster head for ensuring an energy efficient network. Cloud server: It is responsible for secure storing of electronic health record (EHR) as well as the in-depth analysis of the patient’s health data to provide valuable insights. It also maintains EHR security by providing strong authentication protocols. Application user: They access data/services from the cloud server. Only authorized users are permitted to access specific health information from the cloud server. In the proposed system any physician or health organization individual acts as a user and access the EHR through different healthcare applications.
Proposed framework.
The following properties have been considered for the simplification of the network model in this work: Random distribution of MDCs in the geographic area. Deployment of static MDCs in the work environment. The MDCs deployed are homogeneous having equal capabilities. All MDCs have capabilities to control power and each node has the ability of changing power level and communicating with DAC directly. DAC is placed far from the sensing field at the center of the problem space and is not constrained by energy.
HWPSO-based clustering
In this work, the HWPSO based energy efficient clustering strategy has been proposed to form the best set of clusters based upon the proposed fitness function. The graphical representation of all the steps involved in this clustering strategy has been depicted in Fig. 2. In this approach, firstly, for a specific area, ‘n’ number of MDCs have been deployed randomly in different places at different times. Similarly, the data analytic center has also been established at the center of the defined area. An initial population having a number of particles has been generated randomly where each particles has been generated randomly here each particle is comprised of ‘m’ centroid positions within the predefined region. Based on these centroids, the required number of clusters have been formed for each particle. The nearest neighbor method has been used here to make a distinct set of clusters to reduce the average transmission distances among MDCs. In this method, all micro data centers compute the distance from each centroid and join under the closer one to form a cluster. In this way, all the MDC’s will come under a cluster. Afterward, the proposed HWPSO based clustering strategy has been followed to form the final set of suitable clusters of MDC and corresponding cluster-heads. The whole process of clustering must undergo a series of repetitive optimization steps.

Flowchart of proposed HWPSO based clustering.
It is required to calculate the fitness value of each individual in the clusters according to the fitness function as the survivability of an individual depends upon its fitness value. In this work, the proposed fitness function is based on the following five parameters or criteria:
Energy factor:
This factor specifies the remaining energy of a node ni over the initial energy at the time of deployment.
Where Ecurr = Current energy of MDC; E0= Initial energy of MDC.
Average intra-cluster distance:
This factor calculates the average distance between the remaining nodes of the cluster C k from selected cluster member n i .
Where |C k |=Number of members in k th . cluster;
Average distance to cluster leader over DAC:
This is the factor that specifies the ratio or goodness of distance from n j . to selected node n j . over distance from n j . to the DAC.
Where |C k |=Number of members in k th . cluster;
Average sleeping time:
This factor depends on the previous history related to sleeping intervals of a node. In the proposed approach, sleep interval of each MDC has been set on the basis of emergency cases or highly suspicious cases. In highly suspicious cases the sleeping time of an MDC will be less due to the emergence of continuous or regular data transmission to monitor the health of the patient. Moreover, sleeping time of MDC can be adjusted by considering their sensing coverage and their distance from the leader-MDC or the DAC.
Where, Ti = Sleep interval (in seconds) for i th . time interval of a node; t = Total number of sleep intervals recorded for a node;
Computational load:
This parameter specifies the computational load or CPU load at time t. It is measured in percentage.
4.3.1.1. Criteria weight calculation. In this phase, the weight or importance factor of each criterion has been computed. As the energy efficiency of MDC, as well as the whole cluster, is the most concerning aim, the energy factor parameter of the MDC has been considered as the most important factor among all. The average intra-cluster distance and the average distance to cluster leader over DAC have been considered as the two most significant criteria in the proposed network because they save transmission time and network bandwidth which in turn assure the saving of energy and the extra communication cost in a cloud environment. The remaining two criteria namely average sleeping time and computational load also play an essential role in the MDC network as lower computational load and higher sleep time will save the energy indirectly.
Here, the weights of the criteria have been generated by pairwise comparisons for each of the chosen criteria using AHP. AHP transforms the comparisons, which are most often empirical, into numerical values for further processing and comparison. The relative significance scale between two criteria as suggested by Saaty [25] is the most widely used. Table 1 shows the scale where values vary from 1 to 9, determines the relative importance of a criterion when compared with another criterion. The consistency ratio (CR) measures the uniformity of a respondent’s answers to the AHP questionnaires. The pairwise questionnaire was generated by defining the questions along with the Saaty’s scale for responses. On the basis of the responses received from several experts in the relevant field and on the basis of literature, the target numbers used in the pairwise comparisons have been selected with the help of significance scale. The pairwise comparison matrix has now been generated as shown in Table 3(a) by utilizing the significance scale listed in Table 1.
Significance scale of criteria [25]
Where N is the number of evaluated criteria.
The complete flow of tasks for weight generation through AHP is: initialization of group of criteria ⟶ preparation of comparison matrix for group of criteria ⟶ normalization of comparison matrix ⟶ eigenvector calculation ⟶ calculation of maximum eigenvalue (λ max )⟶ exhibit of random consistency index (RI) as shown in Table 2 ⟶ the calculation of the consistency index (CI) using equation (19) ⟶ the calculation of the consistency rate (CR) using equation (20) ⟶ demonstrating the contribution or weights of each criterion to the goal defined. For verification of adequate consistency index (CI), the consistency rate (CR) should always be less than 10%. It is defined as the ratio between the consistency index and the random consistency index (RI). Table 3(b) lists the final weight of each criterion which have been calculated from the abovementioned analytic hierarchy process (AHP) method. In this work, the obtained consistency rate is 0.03999 < 0.1∼10%. Since the value is less than 10%, the weights can be considered to be consistent and can be used in further fitnessfunction generation.
Exhibit of random consistency indices (RI) [25]
Weight determination of criteria
4.3.1.2. Criteria evaluation and fitness function generation. Since the criteria are different, it is not obvious that all the time the best solution obtained for one criterion will be desirable for other criteria also. To deal with this kind of situation, the concept of multi-objective was introduced. In this respect, researchers have successfully used the Overall Evaluation Criteria (OEC) method in many cases to achieve multi-objective behavior [26, 27]. In this work, the OEC method has also been used to deal with the multi-objective behavior of all the criteria and formulate them into a single index. The data have been normalized and weighted accordingly. As mentioned earlier, AHP has been used to calculate the weights of criteria. To observe the combined effect of the five factors namely Energy factor, Average Intra cluster distance, Average distance to cluster leader over DAC, Average Sleeping Time and Computational Load, OEC analysis has been performed. Equation (21) shows the formulation of OEC for the responses X and Y having weight percentages W
X
and W
Y
respectively [27].
The quality characteristic (QC) for X is ‘bigger is the best’ (QC = B) and for Y is ‘smaller is better’ (QC = S). In this equation, the effect of all the criteria have been converted to bigger and for this, smaller criteria function have been subtracted from 1. After scaling the fitness function, we have fitness function as:
Our objective is to maximize the fitness value. In other words, higher the fitness value, better is the MDC as well as the cluster.
4.3.2. Final cluster formation and head selection
After computing the fitness of all MDC’s within all the clusters, the cluster head determination task takes place. In a cluster, the MDC with the highest fitness value will be treated as the cluster leader, and the remaining members will be notified about this. Next, the fitness of every cluster will be computed from the average fitness of all the participating individual within that cluster. Subsequently, the best particle will be identified based on closeness proximity of cluster fitness by following the HWPSO algorithm. That means the best particle with a combination of ‘m’ clusters having equally good fitness will be chosen. If the newly found one is better than the previously stored particle, then the new one will be replaced with the stored one and termed as the best particle found so far. Otherwise, the HWPSO will be applied to form the newly updated population matrix for the next iteration, and this process continues until the final optimal best cluster combination arrives over all iterations.
We performed extensive simulations on the proposed algorithm and other states of the art algorithms using MATLAB R2012b. As mentioned earlier, every member MDC transmits data to the cluster head and consume a certain amount of energy. Similarly, each leader-MDC in each cluster aggregate all the data coming from the other cluster members and transmit it to the DAC periodically. As a result, the leader-MDC consumes some extra energy due to aggregation as well as the bulk data transfer to the DAC situated at a distant place. Additionally, all the MDC consume some energy to execute its other computational needs. The rate of energy consumed per transaction by leader-MDC has been shown in equation (23) and the same for the other cluster members has been shown in equation (24). All the network parameter values used in the simulation has been drawn in Table 4.
Simulation parameters
Simulation parameters
Energy loss for cluster head in each transmission:
Energy loss for cluster members in each transmission:
For observing the convergence rate and other measures in cluster formation, a performance based comparative analysis has been performed between HWPSO, the parent algorithms particle swarm optimization (PSO) and whale optimization algorithm (WOA) and some high performing state of the art optimization algorithms namely, human behavior based PSO (HBPSO), simple genetic algorithm (SGA), dragonfly algorithm (DA) etc. These three algorithms demonstrated better performance when used in case of benchmark functions and is thus used for comparison with HWPSO. Table 5 lists the values of the parameters considered during the simulation of HWPSO. The simulations of all the five algorithms have been conducted against the same number of population and the maximum iteration limit. The initial deployment of MDCs has been depicted in Fig. 3 and the same has also been considered for the simulation of all the optimization algorithms. Table 6 shows the comparative analysis of the algorithms in terms of their best, worst, average and standard deviation for 20 number of runs. Table 6 shows that HWPSO is more consistent in terms of a lower standard deviation when compared with other state of art algorithms.

Initial deployment of micro data centers.
HWPSO simulation parameters
Comparison between the algorithms in terms of their best, worst, average and standard deviation (SD)
For validating the results obtained by the algorithms, Friedman statistical test has been performed. It is a nonparametric test used for ranking algorithms based on performance [9]. In the Friedman’s test, the best performing algorithm has lowest mean rank while the worst performing algorithm is ranked highest. The results for the Friedman’s test for the problem is shown in Table 7. From Table 7 it is seen that HWPSO outperforms the state of art algorithms with a mean rank of 1.050, which further validates the result obtained.
Friedman’s statistical test result
Figure 4 shows the box plot for HWPSO as per the statistical data. As seen from the figure, the optimum values obtained by HWPSO lie close to each other having a low standard deviation at approximately half the data set. Figure 5 represents the detailed graphical overview for finding the convergence point in case of all the above mentioned algorithms. In the case of PSO, it has been found stagnant at a cluster closeness proximity of 0.0018 from the iteration number 226 onwards. Whereas, in case of HBPSO it has been found stagnant at 0.0013 from the iteration number 175 onwards. HBPSO outperforms the basic PSO in better convergence speed and the cluster closeness proximity. The similar analysis for SGA (with population = 100, crossover probability = 0.5 and mutation probability = 0.1) has also been performed and found stagnant at 0.0012 from the iteration number 213 onwards. Moreover, in case of DA, it has been found stagnant at 0.0007 from the iteration number 183 onwards. For WOA, it has been found stagnant at 0.00067 from the iteration number 170 onwards. Clearly, WOA performs better with very less cluster closeness proximity value even at less number of iteration as compared to the HBPSO and SGA and DA. For HWPSO, it has been found stagnant at 0.00054 from the iteration number 41 onwards. HWPSO performs much better as compared to the WOA with less cluster closeness proximity even within just 41 iterations. Hence, clearly the HWPSO yields better result in faster convergence with better cluster closeness proximity than the other four algorithms. Figure 6 shows the changes in average residual energy of each cluster with respect to the number of data transmission process for all the optimization algorithms (up to 10,000 transmissions).

Box plot of HWPSO for 20 number of runs.
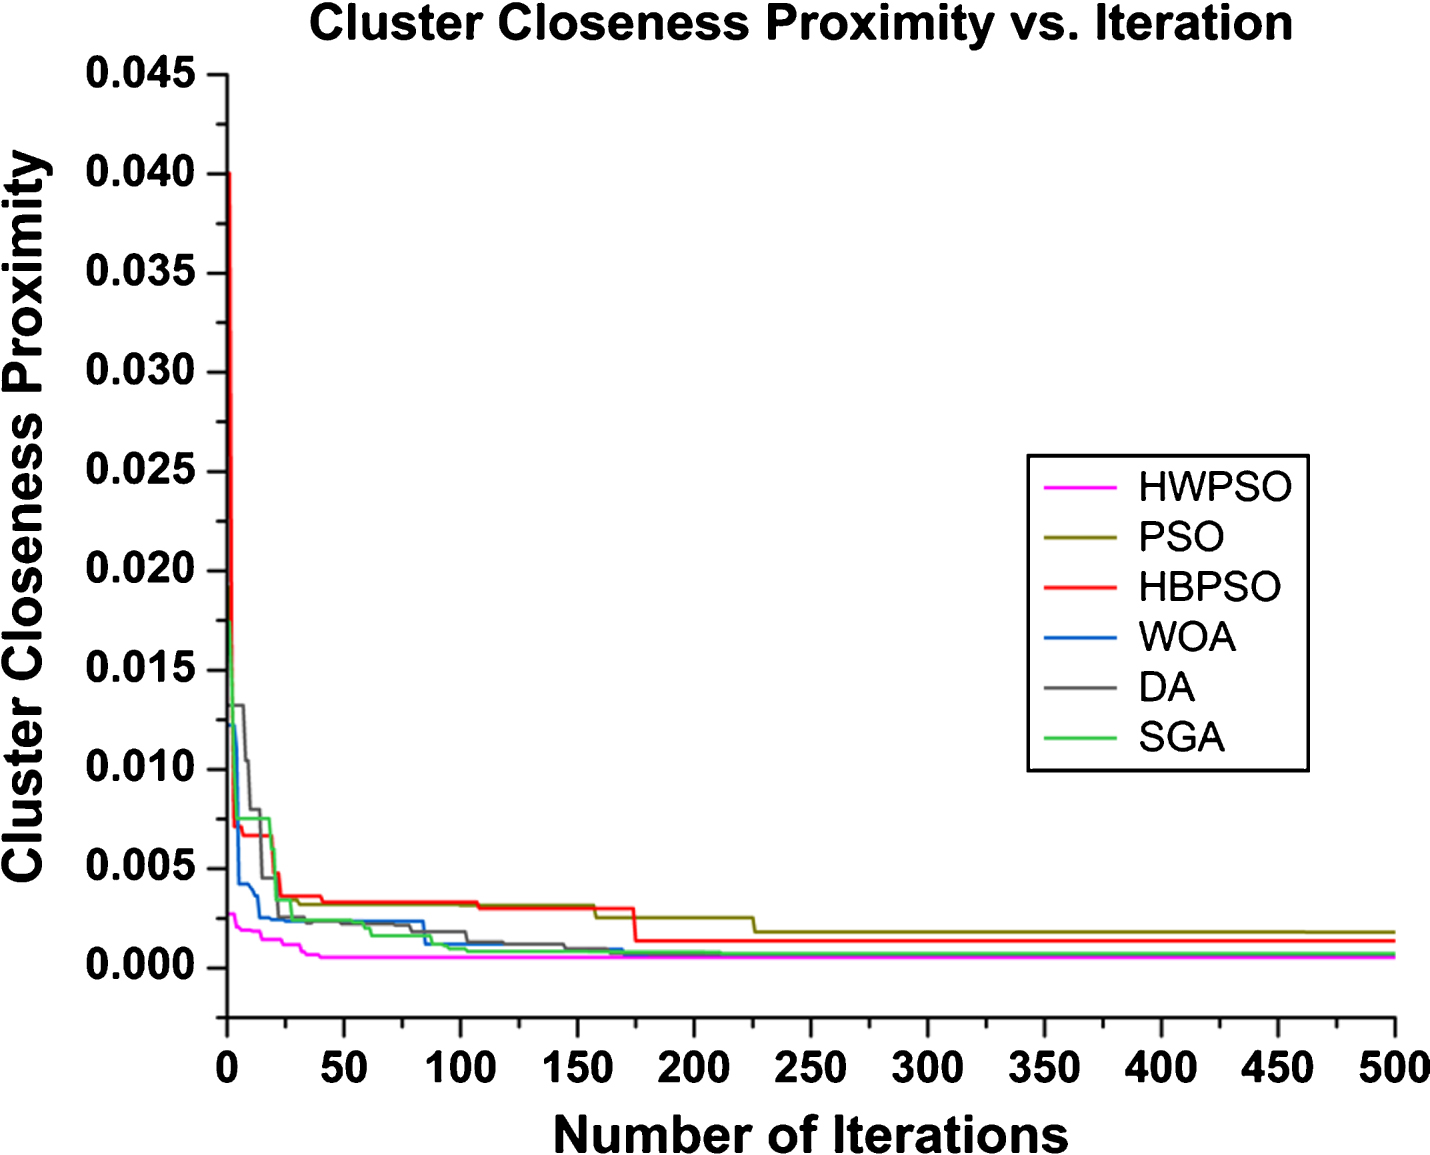
Changes in cluster closeness proximity with the number of iteration.
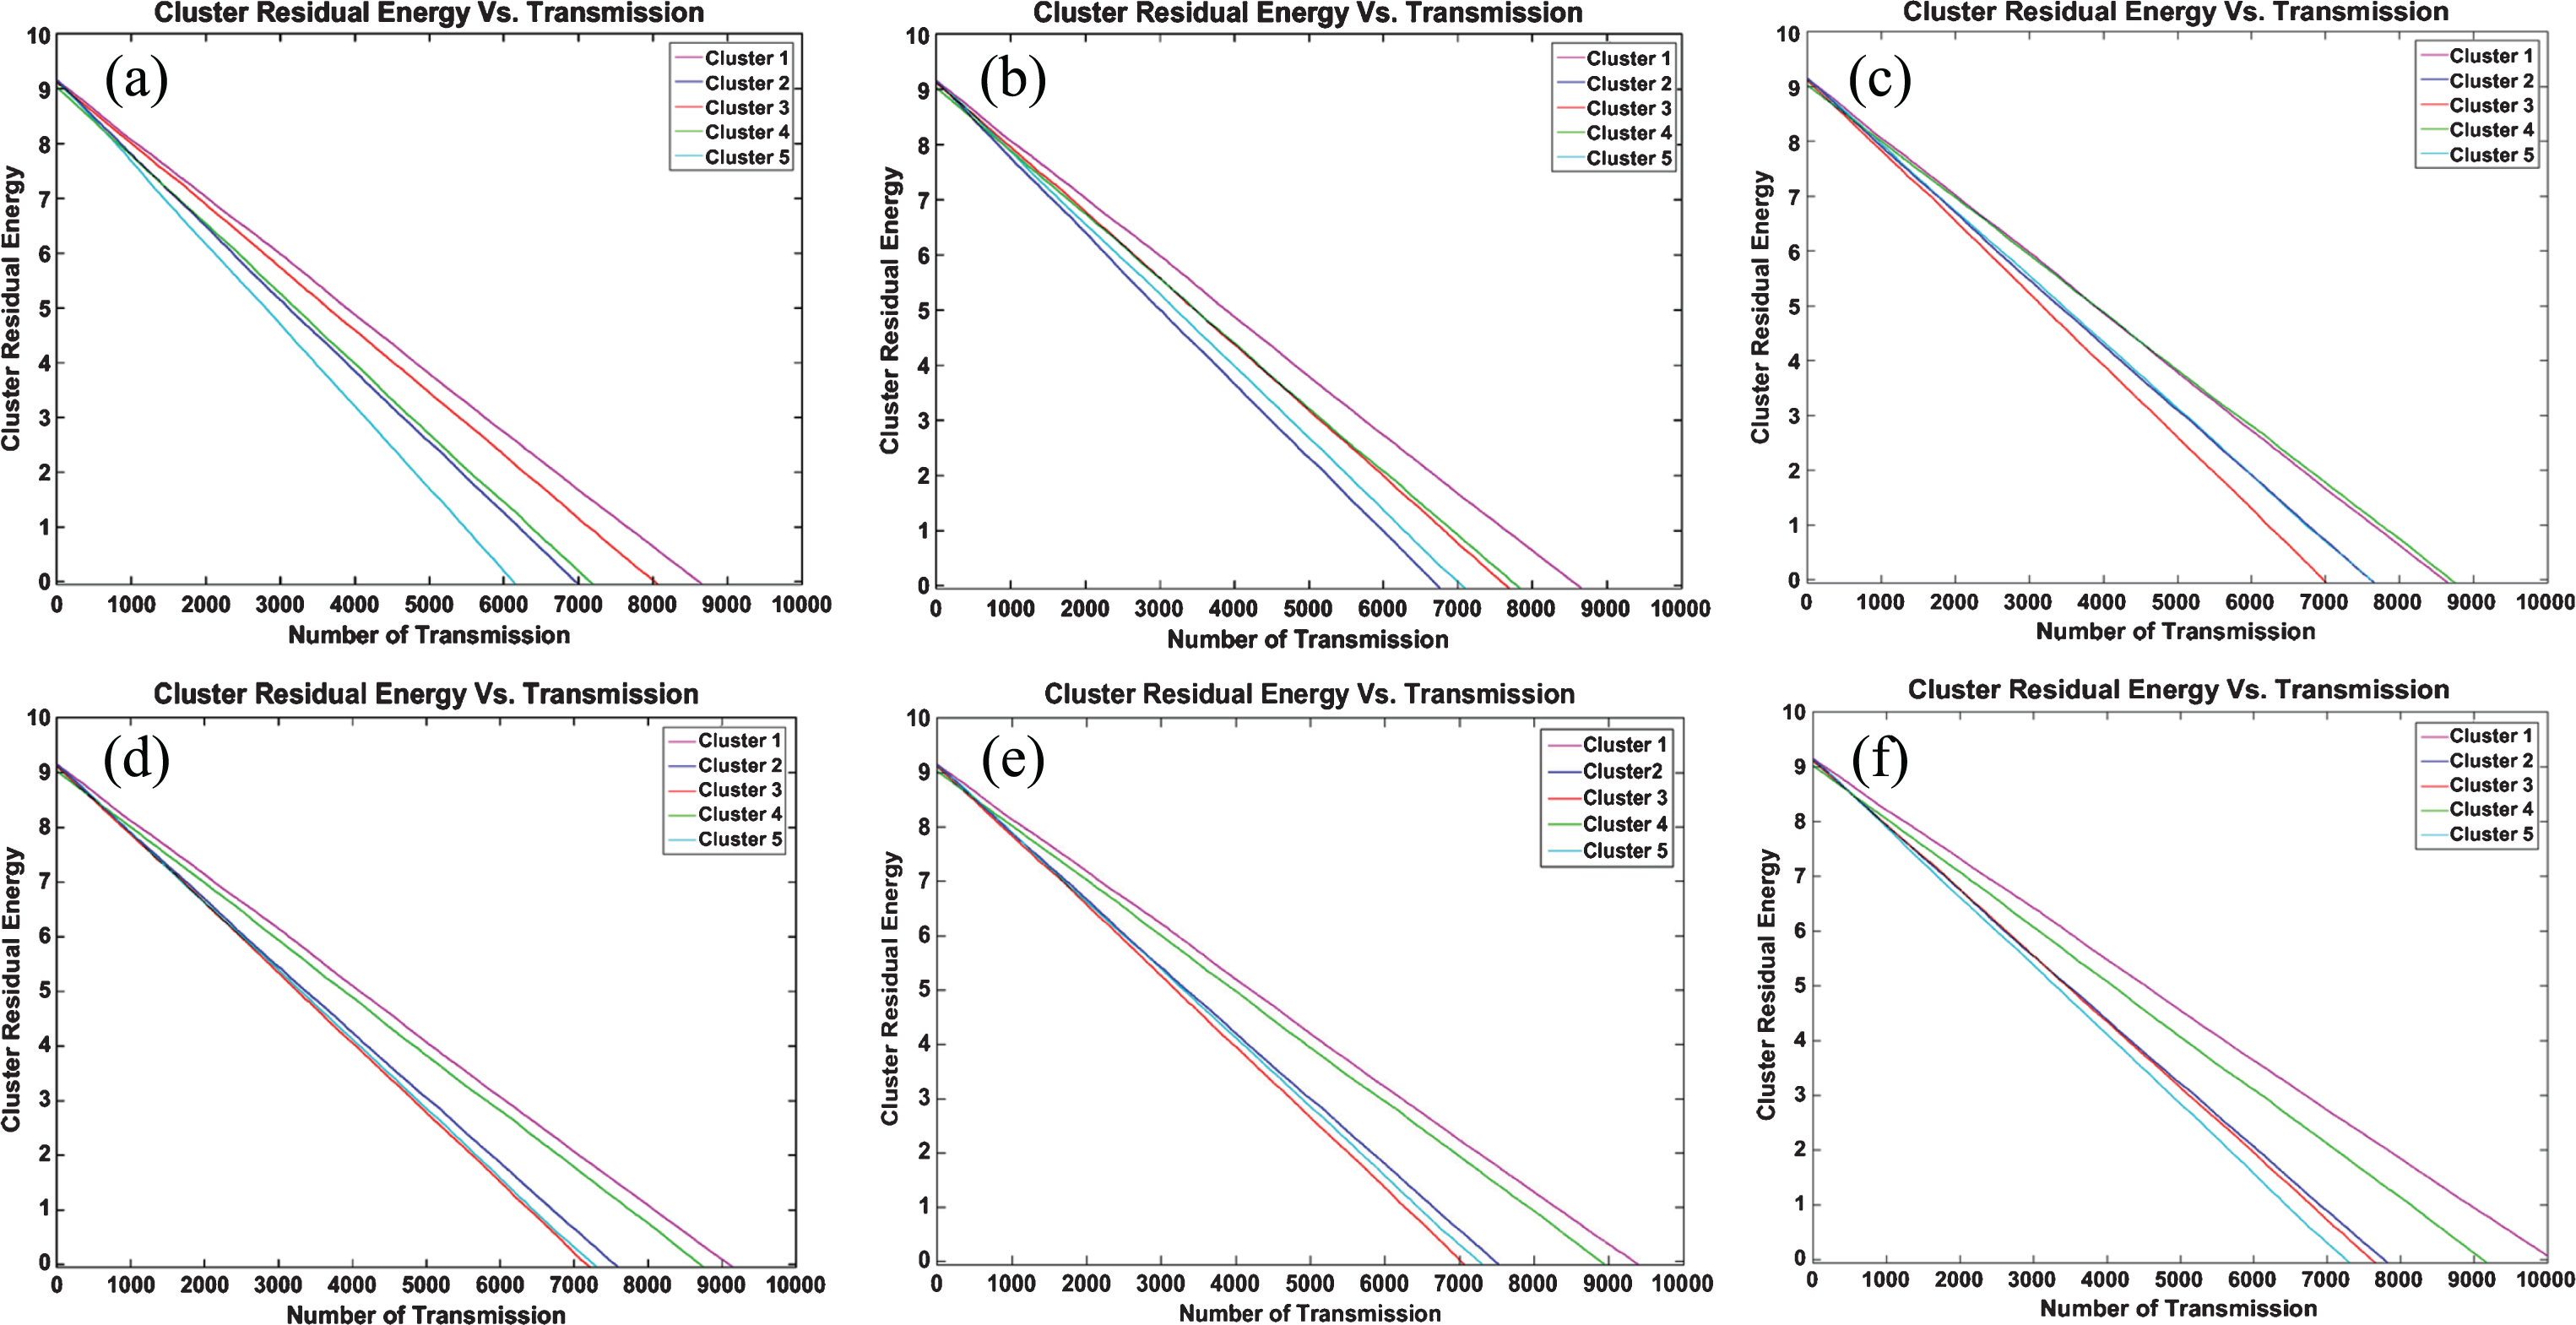
Clusters residual energy in each transmission in case of (a) PSO (b) HBPSO (c) SGA (d) WOA (e) DA and (f) HWPSO.
Figure 6(a)-(f) illustrates the clusters residual energy in each transmission for all the aforementioned algorithms. In case of PSO, after transmission number 6,184 cluster-5 dies first. For HBPSO, it has been found that after the transmission number 6,889 cluster-2 dies first. Similarly, in case of SGA cluster 3 dies first after transmission number 7,014. It has also been noticed that in case of WOA cluster-3 dies first after transmission number 7,203. For DA, after transmission number 7,099 cluster-3 dies first. Moreover, in case of HWPSO cluster-5 dies first after transmission number 7,322. Besides, it can also be noticed that in case of HWPSO all the clusters sustain for a long time as compared to the others. From this analysis, it has been clearly perceived that the proposed HWPSO outperforms the other algorithms in the average network lifetime which is the actual signature requirement for an e-Healthcare system.
Figure 7(a) shows the optimized set of clusters in case of HWPSO based clustering approach with their corresponding centroids and cluster heads whereas Fig. 7(b) depicts the position of newly appointed cluster heads at transmission number 7,322. The centroids have been shown as square shaped icon whereas the cluster heads have been shown as the encircled star. This figure resembles the fact that even at 7,322 number of iteration the HWPSO performs effectively to generate the set of clusters which have an equally good cluster closeness proximity.
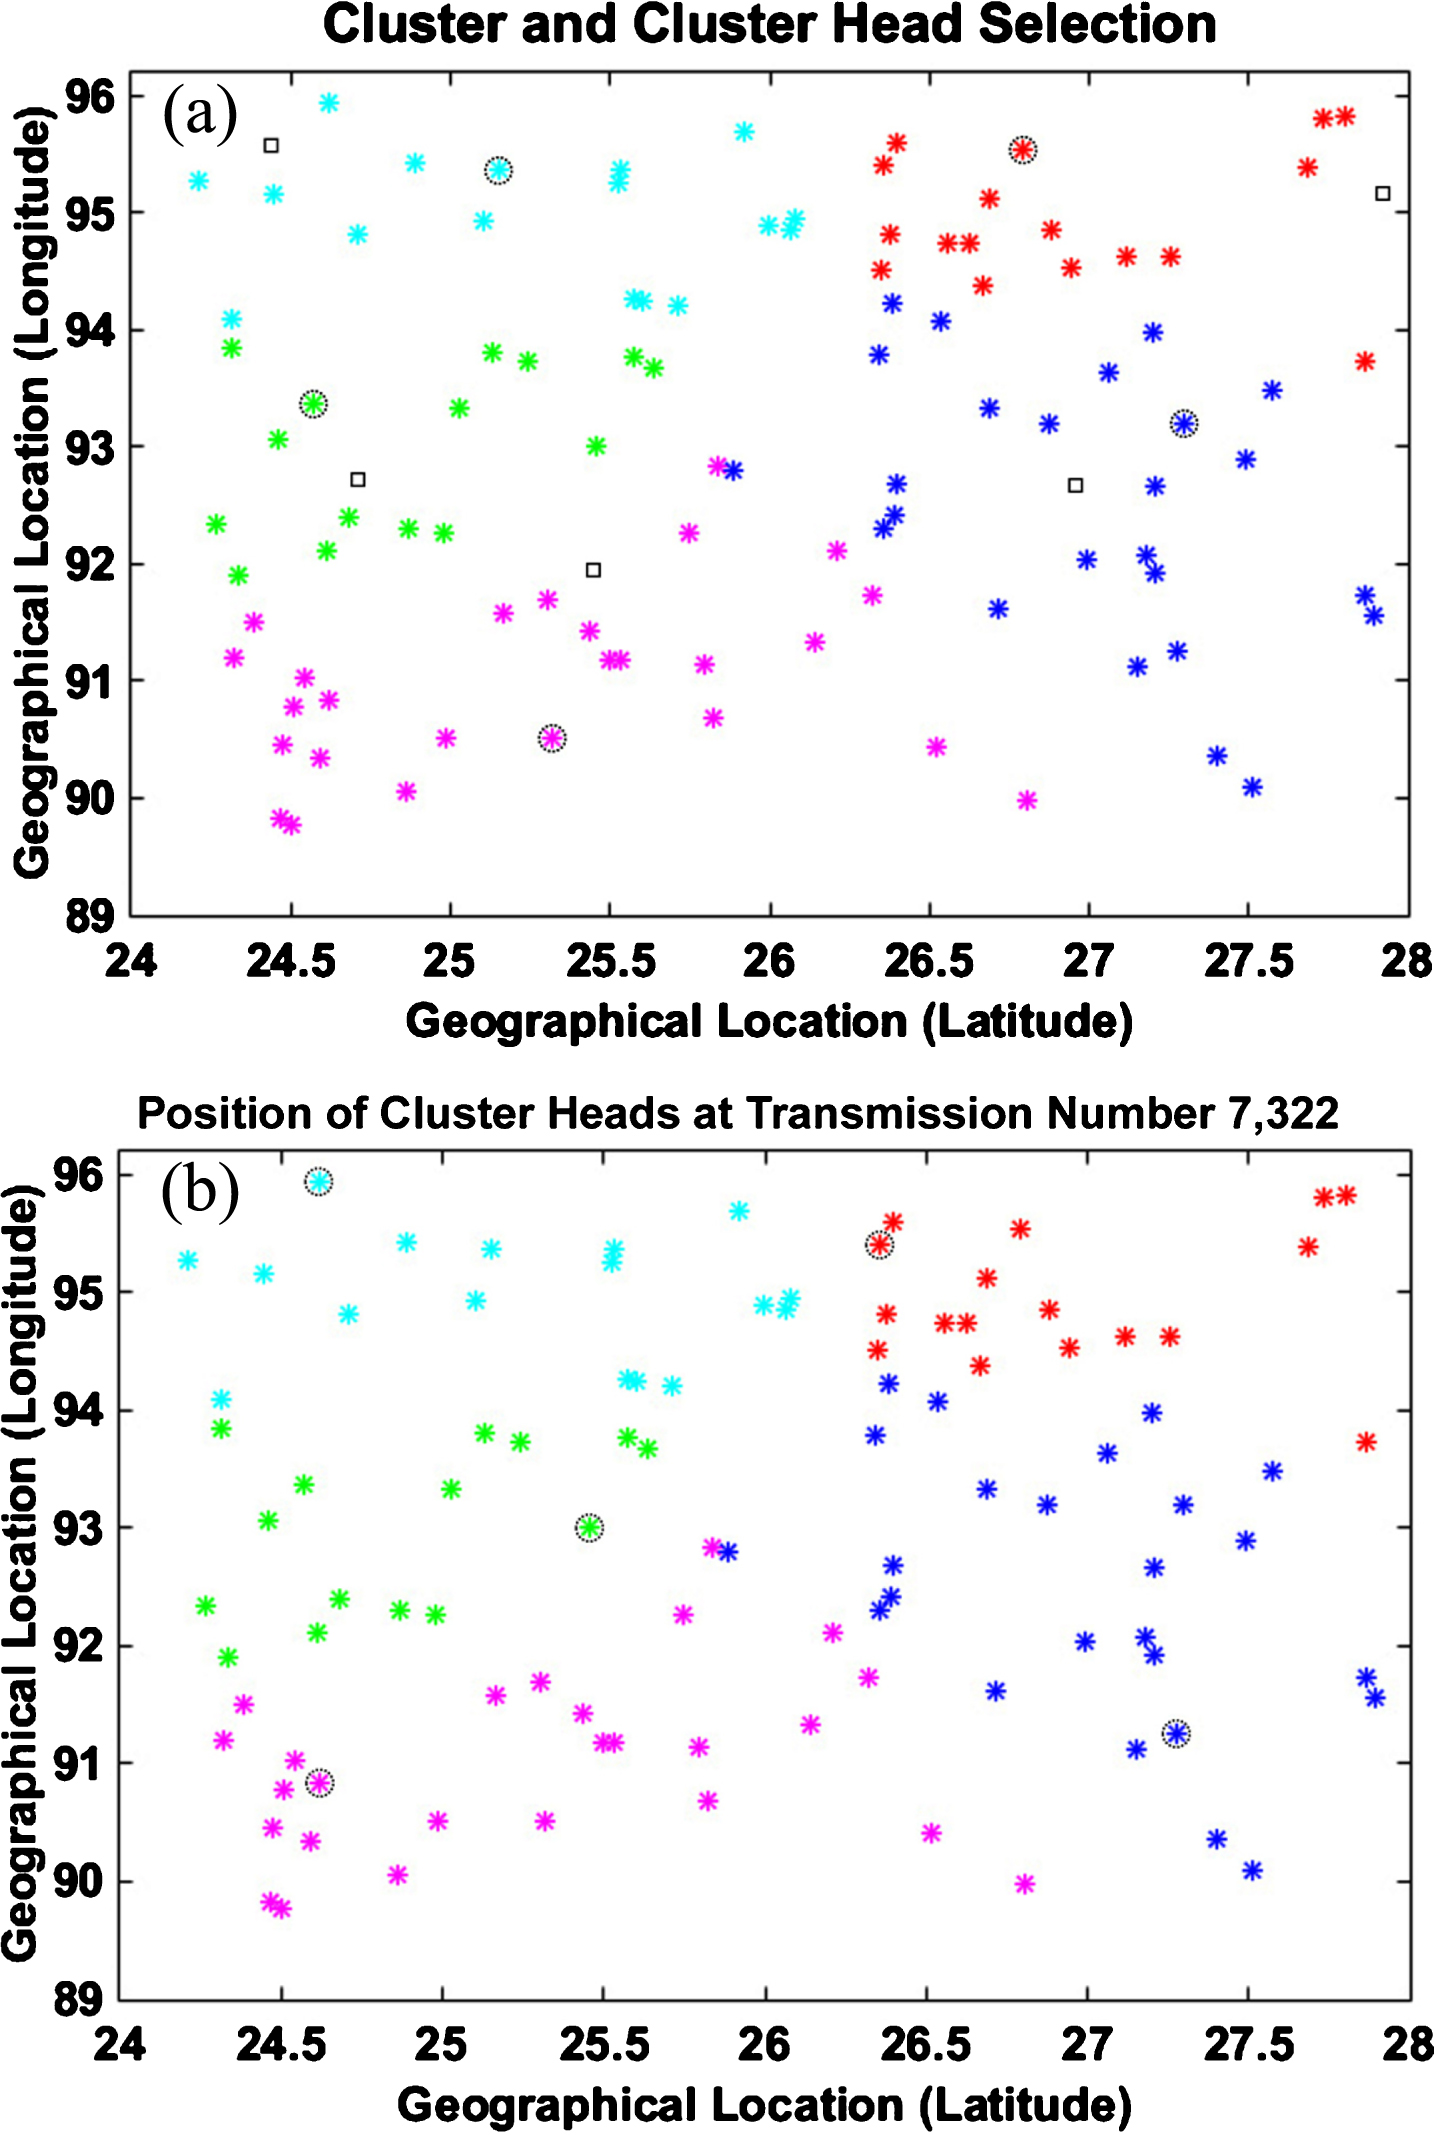
(a) Initial MDC clustering using centroids and cluster head selection in case of HWPSO. (b) Position of newly appointed cluster heads at 7,322 number of transmission in case of HWPSO.
Due to the technological advancements, monitoring and diagnosis of many infectious diseases have become easy through the use of various sensors and devices which aid health sectors in taking necessary precautionary measures. In this paper, a comprehensive framework for advanced e-Health monitoring system configured with a set of edge devices has been proposed. Moreover, the use of HWPSO algorithm provides a new perspective to measure the network lifetime which is much suitable for the online systems like e-Healthcare due to its faster convergence nature. Additionally, the proposed fitness function also claims that the longevity of a network should not be evaluated based on the energy of the devices only, but also other important parameters related to distance and computational status should also be taken into consideration. This system also confirms the formation of an efficient cluster-based e-Healthcare network where all the formed clusters configured with fog layer edge devices will be almost equally good in every respect which in turn confirms an organized energy consumption and better e-Healthcare network lifetime. Future work will include real life implementation of the proposed healthcare framework using microcontrollers. In addition to this, the development of a novel and robust optimization based clustering algorithm can also be considered as a future extension to this work.