
Abstract
Prediction of links/ connections in social networks is useful for increasing business in the area of telecom and social media. All types of social networking organization are trying to increase their nodes, i.e. the number of members. So the calculation of link prediction is the most important task because this calculation will help how to increase the number of user on a social network. A new technique of link prediction, namely RSM index, is introduced in this paper. Few essential properties have been established. Also, a comparative study with the existing methods is depicted with suitable tables and graphs.
Introduction
Nowadays, the popularity of social networks is growing in human life very rapidly. At present people can exchange information very quickly by the help of social networks [14]. Social networks can be used for many purposes like spreading of news, marketing of products, etc. These social networks can be represented as a graph, where every user like a person, a community, an organization, so on, are considered as vertices. Also, the relation between two users is considered as an edge. For an example, set of all users of Facebook is considered as vertex set and their friendships considered an edge set, if all the researchers of a university are considered as vertex set of a social network, there exists an edge if they have at least one common research paper.
All types of social network organizations are trying to increase the popularity of their network. If the number of user increases then popularity increases. Also, the number of users is related to a number of edges in a graph. So how to increase edges in the social networking system is very important in present condition. Moreover, how to increase the link in social networks in future is link prediction. Suppose, in a graph two nodes u and v have no edge. There may be many chances of connection between u and v. This chance is calculated by link prediction methodology.
In a social network, when a user gets a friend request or wishes to send a friend request to another user, the first user can check how many common friends they have. Also, check the personality of these common friends. Here, personality is the fuzzy terms. Also, the personality of common friends is proportional to the chance to link. So, the calculation of link prediction by the fuzzy graph is more effective than from crisp graph. The newly proposed method of link prediction depends on this personality. All the other methods of link prediction are based on the number of common neighbours. However, this newly proposed method is based on the nature of common neighbours.
Some of the earlier works including recommendation techniques and methods are being used in the area of recommendation system of online social networks. There are numerous existing researches in this area using collaborative filtering, whereas others use social network structure for the development of recommendation systems including various parameters (like content, location, strength, directions, etc.) that can be used to characterize connections between users. There are few other methods like user’s behaviour analysis in terms of similarity as well as diversity between their friends. This idea has a limitation in the scenario of dynamically changing behaviour of followers in a Facebook and Twitter-like social network. Many types of methods are used for the calculation of link prediction. Nowell et al. [11] introduced the method of Common Neighbor. In this method, link prediction directly depends on the number of common neighbours. This common neighbour was modified, which is a commonly used method Jaccard’s coefficient [9]. Sorensen [4] introduced a new method called Sorensen Index. Leicht et al. [5] modified Hub Depressed index [6] methodology of link prediction. Adamic et al. [12] launch a new concept of link prediction is Adamic/ Adar (AA) index. Link prediction with influential node identification was introduced by J. Wu et al. [17]. Link prediction on complex networks was represented by J. Wang [18]. S. Bastani et al. [19] described a new approach to link prediction in Fuzzy models. T. Manh Tuan et al. [20] introduced a new method in Fuzzy and neutrosophic modelling for link prediction in social networks. For further details readers may follow the articles[13, 21– 24].
Here all methods of link prediction are defined based on the neighbours. The score of link prediction depends on the number of neighbours. If the number of neighbours increases, then the chance of link prediction will also increase. But, the nature of neighbours is fundamental. The newly proposed method of link prediction depends on the nature of neighbour. Here link prediction not only depends on the number of neighbours but also the nature of neighbours. The newly proposed method is named as RSM index.
Preliminaries
Some notations
A graph is defined as a couple G = (V, E), where V is a set of object and E is a set of relation on V. The members of the set V are called vertices of the graph G. The elements of E are callededges of G.
A fuzzy set A on a universal set X is characterized by a mapping m : X → [0, 1], which is called the membership function. A fuzzy set is denoted by A = (X, m).
A fuzzy graph ξ = (V, σ, μ) is a non-empty set V together with a pair of functions σ : V → [0, 1] and μ : V × V → [0, 1] such that for all x, y ∈ V, μ (x, y) ≤ min {σ (x) , σ (y)}, where σ (x) and μ (x, y) represent the membership values of the vertex x and of the edge (x, y) in ξ respectively.
A path in a fuzzy graph is a sequence of distinct nodes x0, x1, …, x n such that μ (xi-1, x i ) >0, 1 ≤ i ≤ n. The fuzzy path is said to be fuzzy cycle if x0 and x n coincide.
The strength of a path is the minimum membership value of an edge in the path. The maximum of all strengths of paths between two vertices is the strength of connectivity between the vertices.
A fuzzy graph ξ = (V, σ, μ) is complete if μ (u, v) = min {σ (u) , σ (v)} for all u, v ∈ V, where (u, v) denotes the edge between the vertices u and v. All basic notations are shown in Table 1.
Some basic notations
Some basic notations
In (Fig. 1);, a flowchart of a literature review of link prediction is shown.

Flowchart of literature review of link prediction.
In a social network, a snapshot at the time t to find accurately predict edges which will be added to this social network at the time t*, where t < t*. An example is considered in (Fig. 2);, which represents a small network. At any time, t the graph has no edge between the vertices TP and BS. However, there may be chances of connection between TP and BS in future time t*. This chance is calculated by link prediction.
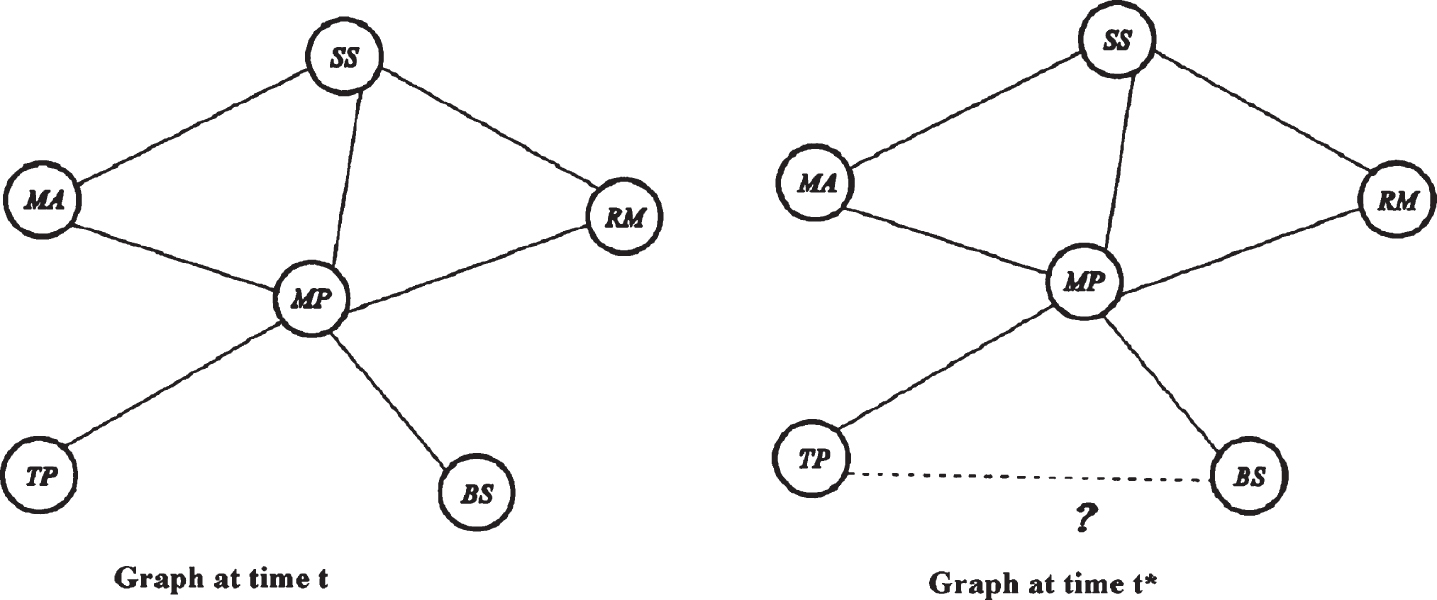
Example of link prediction.
The link prediction problem indicates how to grow a social network. Example, consider a graph whose vertices are all researchers of a university, and there is an edge if they have published at least one research paper. By this calculation, one subject may be connected to another subject for research. Biology subject is already connected with mathematics for research the subject. It is "BIO-MATH" and chemistry is connected with biology for research the subject. It is "BIO-CHEMISTRY".
Many types of methods are available to calculate the link prediction.
This method is based on common neighbors. Suppose, N (x) denotes the set of neighbors of the node x. The score of link prediction is denoted by β (x, y) and defined by
The score of link prediction is based on the idea that two nodes x and y have an increased score to connect if they have a common neighbor z. With an increasing number of common neighbors z this score of link prediction grows even higher.
Salton Index
Salton index [15] also called as Salton Cosine index. It is used to find the similarity index based on cosine angle between rows of adjacency matrix having nodes x and y. The score of link prediction is defined as
Jaccard Index
Jaccard proposed a statistic to compare similarity and diversity of sample sets. It is the ratio of common neighbors and all neighbors of nodes x and y. So, the score of link prediction by Jaccard index [9] prevents higher degree nodes to have high similarity index with other nodes. This method was introduced by Jaccard and is defined as -
Sorensen index
This method is similar to Jaccard and proposed by Sorenson for a measure of link prediction. This index has calculated the score as a ratio of twice the common neighbors and the sum of degrees of nodes x and y. This method is mainly used ecological community. Soresen index [4] is defined as
Hub Promoted Index
Hub Promoted index [6] is a measurement score of link prediction as the ratio of common neighbors and the minimum of degrees of nodes x and y. This method gives the high score because the denominator is the minimum degree of node x and y. This method is defined as
Hub Depressed Index
This method is similar to above method Hub Promoted Index. Hub Depressed index defined as the ratio of common neighbors and the maximum of degrees of nodes either x or y. Hub Depressed index always gives lower score from Hub Promoted index score because as the similarity measurement is computed by taking maximum of degrees of nodes x and y. This method is defined as
Leicht-Holme-Newman index
This index was proposed by Leicht Holme and Newman. It is the ratio of common neighbors and the product of degrees of nodes x and y. This index is defined as
This method and Salton index differ only in their denominator. As a result, for a same pair of nodes, x and y Salton index always assign a higher score compared to Leicht Holme Newman index [5].
Preferential Attachment index
Preferential Attachment index is a similarity score calculated independently of the neighborhood of each node. Social networks increase as and when new nodes join and the new nodes join with the existing nodes having a higher degree compared to lower degree nodes. The chance of link prediction of two nodes x and y by this method is proportional to K
x
* K
y
and is defined as
Adamic-Aar Index
Adamic-Adar index [12] of link prediction was proposed by Adamic and Adar. This is calculated by adding weights to the nodes which are connected to both nodes x and y. This method depends on common neighbor and this index is defined as
Resource Allocation Index
In this method [10], two pairs of nodes x and y have no edges, then the node x can send some information to the node y by their neighbor. Similarly, between the nodes, x and y can be explained as the amount of information y can receive from x which is defined as
This index is symmetric i.e. β (x, y) = β (y, x)
Here all methods of link prediction are defined based on the neighbors. Also, the result of link prediction depends on a number of neighbors. If a number of neighbors increases then the chance of link prediction will also increase. But, nature of neighbors plays a big role in link prediction. New proposed method of link prediction depends on nature of neighbor. Here, link prediction not only depends on a number of neighbors but also on nature of neighbors.
RSM index for link prediction
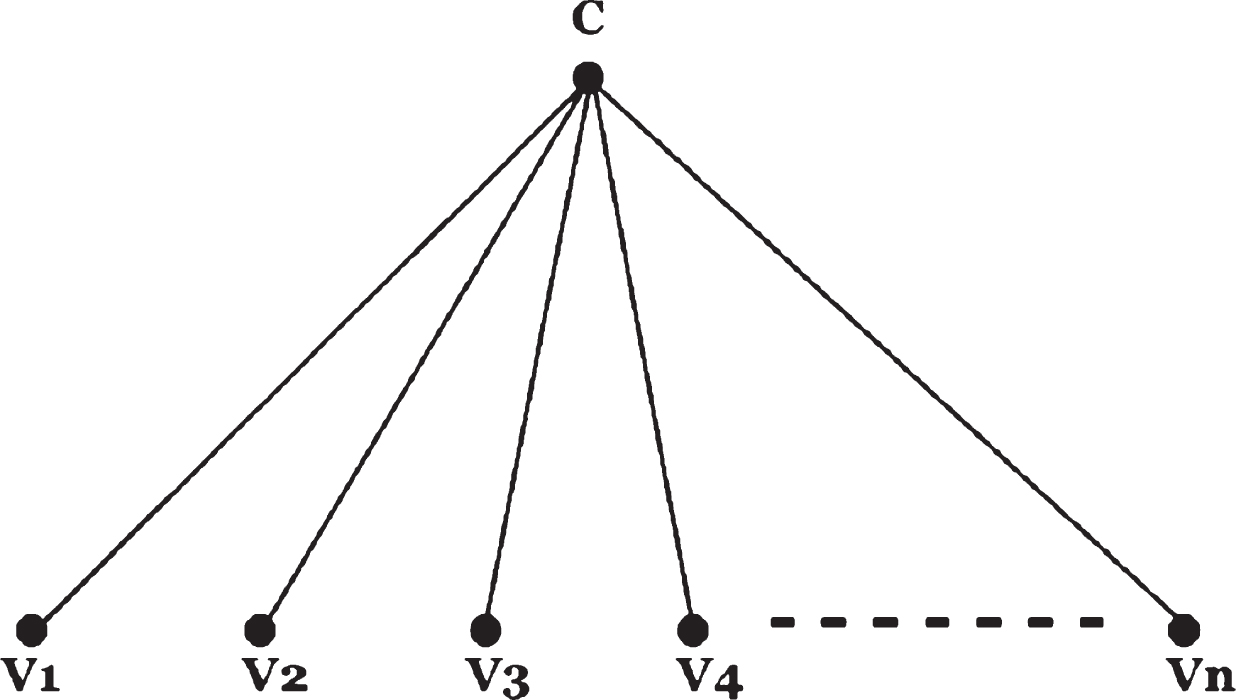
Let ξ = (V, σ, μ) be a connected fuzzy graph and u, v be any two vertices of this fuzzy graph. Let u and v (Fig. 3) have n numbers of common neighbors as w1, w2, …, w n . Also, μ (u, w i ) the membership value of the edge (u, w i ), where i = 1, 2, 3, …, n. If two persons have common friend then there link prediction depend on nature/ characteristic of the common neighbor. It is very difficult to represent the nature of any person. For this purpose it is assume that the nature of a common person is represented as the following formula.

A small network with n numbers of direct neighbors.
The nature of every neighbors is defined as follows
Then the score of link prediction is denoted by S
uv
and defined by
Input:- ξ = (V, σ, μ) be a non complete connected fuzzy graph, where μ is the edge membership value and σ is the vertex membership value.
Output:- Link prediction between two vertices u and v.
Step 1:- All the direct neighbors between the vertices “u” and “v” are labeled as (uv) 1, (uv) 2, (uv) 3, …, (uv) n , where n is the number of neighbors between the vertices u and v.
Step 2:- Calculate the nature N i = min {μ (u, (uv) i ) , μ (v, (uv) i )}, where i = 1, 2, 3, …, n.
Step 3:- Calculate the score of link prediction as
The whole algorithm can be visualized in (Fig. 4);, the framework of link prediction by RSM index.

The link prediction framework of RSM index.

Link prediction by RSM index.
In (Fig. 6);, consider C6 be a fuzzy cycle with 6 nodes. Now score of link prediction between v1 and v3 (having common neighbour v2) is equal to nature of v2. By this similar procedure, the score of link prediction between any two vertices is equal to nature of neighbour. So, for fuzzy cycle score of link prediction of any two vertices (having common neighbour) is equal to the nature of neighbour.

The link prediction of a Cyclic Graph.
Link prediction among nodes on networks depends on their structures. For example, if the structure is like star graph or cycle or bipartite graph, the link prediction can be calculated by the following theorems.
The link prediction of a Star Graph.

The link prediction of a Bipartite Graph.
Case 1. Without loss of generality, consider m r be the minimum edge membership value between the vertices v p , v q of the graph ξ. Then the score of link prediction S ij between any two vertices v i and v j which have only one neighbour v p or v q . Then S ij = nature of v p or v q = m r .
So, the score of link prediction depends on nature of neighbour. Also, nature of neighbour equal to minimum edge membership value. So, the minimum value of S ij is minimum edge membership value. Thus, minimum edge membership value ≤S ij .
Case 2. Consider, m s be the maximum edge membership in two edges which are (v x , v i ) and (v x , v j ) of the graph ξ. Then the score of link prediction S ij between any two vertices v i and v j which have only one neighbour v x . Thus S ij = nature of v x = m s .
So, the value of S ij is the maximum membership value of an edge of the graph ξ.
So, S ij ≤ maximum edge membership value.
From Case 1 and Case 2 this is proved that minimum edge membership value ≤S ij ≤ maximum edge membership value.
The RSM index for link prediction always shows a realistic result compared to other link prediction method. For this comparison, we considered a graph (see (Fig. 9);) of research scholars. Data are taken from ResearchGate (an online network of researchers). Few research scholars of Vidyasagar University are assumed as vertices. Also, there is an edge if two (vertices) scholars have co-authored at least one research paper. All the data are collected from ResearchGate dated 1st June, 2019. The membership value of a vertex is calculated based on as the ResearchGate score. Edge membership values are calculated based on the number of collaborated papers published by two scholars (vertices). In Fig.9, membership values of the vertices and edge are shown. The calculation of vertex and edge membership values are shown in (Fig. 10);.

Source graph, data taken from ResearchGate (1st June, 2019).

Table for calculation of membership values of Fig.9.
First, find out those pairs of vertices which have no edges and RSM index is focused on the prediction of such a link between them. In (Fig. 12);, a graph with predicted links is shown. Here, the number of links to be predicted is fifty-five. So, in (Fig. 12); graph has fifty-five number of edges. So the calculation of the link prediction by all the considered methods is shown.
The scores of the crisp graph ((Fig. 9);) have been converted to a fuzzy graph. Figure 10 shows a table of membership values of all vertices and edges. The vertex membership values are obtained by dividing the maximum vertex score. Here in (Fig. 9);, a maximum score of a vertex is "MP". So, each vertex score is divided by the vertex score of "MP". This is considered as the membership value of the vertex. By the same procedure, scores of each edge is determined. In this problem, the maximum edge score occurs in the edge "SS-MP". Hence, all edge membership values are obtained by dividing "SS-MP" edge score value. Now, the membership values of all edges and vertices are converted between 0 and 1 and all the calculation are shown in (Fig. 10); and plotted a graph in (Fig. 11);. Interestingly, the vertex score and edge score are temporary, it changes concerning a change of time. For the calculation of link prediction by RSM index first, find out the common neighbours. Then calculate the nature of every neighbour. Also, calculate the link prediction of all prediction edges by RSM index. Similarly, calculate the link prediction by Common neighbours, Salton index, Jaccard index, Sorensen index, Hub promoted index methods, Hub depressed index, Leicht holme Newman index, Preferential attachment index, Adamic adar index, Resource allocation index.

Fuzzy graph of source graph.

Predicted Graph of the Fig.9.
Now score of link prediction by all methods and comparison with RSM index is shown in (Fig. 13);. The link predictions by Common neighbours, Salton, Jaccard, Sorensen and HUB methods for this fifty-five predicted link are calculated and shown in (Fig. 13). Moreover, (Fig. 16);, shows a comparison table of another five-link prediction method HUB Depressed, Newman, Adamic-Adar, Preferential and Resource Allocation indexes. Also, (Fig. 14); Shown the normalized score of Common neighbours, Salton, Jaccard, Sorensen and HUB methods with RSM index and the comparison graph of Common neighbours, Salton, Jaccard, Sorensen and HUB methods with RSM index is shown in (Fig. 15);. Similarly, (Fig. 17); shown the normalized score of HUB Depressed, Newman, Adamic-Adar, Preferential and Resource Allocation indexes with RSM index and the comparison graph among the methods HUB Depressed, Newman, Adamic-Adar, Preferential and Resource Allocation indexes with RSM index is shown in Fig. 18. Figure 19 shows the comparison graph among all methods.

Scores of RSM index along with Common neighbours, Salton, Jaccard, Sorensen and HUB methods.

Normalized scores of RSM index along with Common neighbours, Salton, Jaccard, Sorensen and HUB methods.
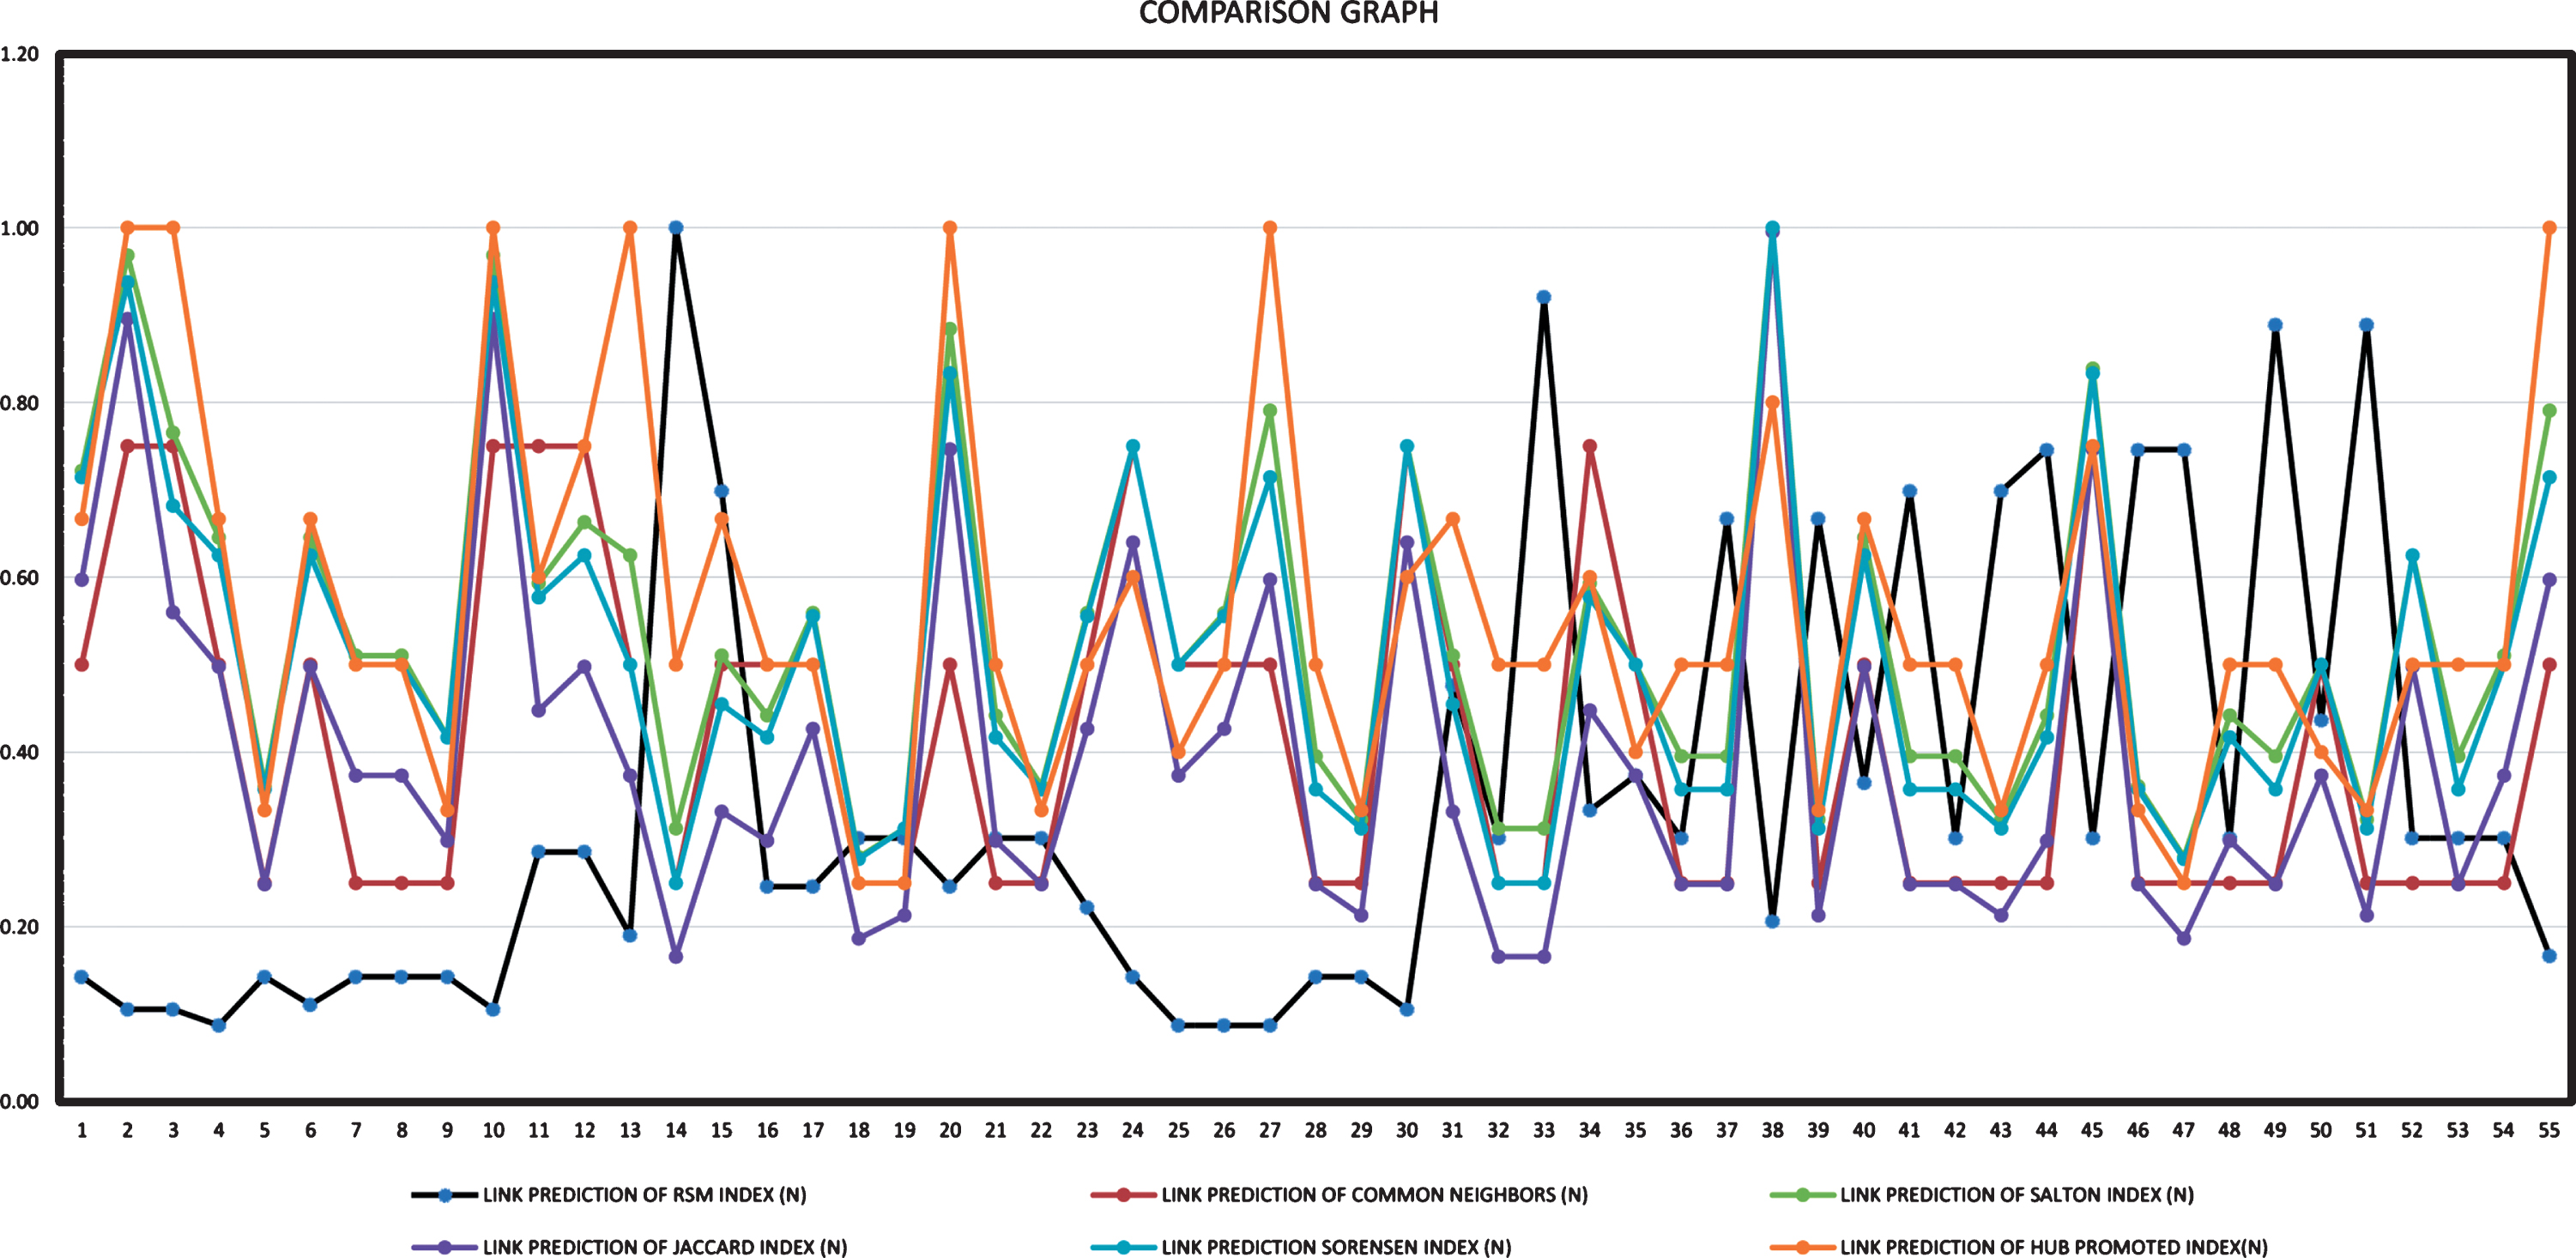
Comparison graph with Common neighbours, Salton, Jaccard, Sorensen and HUB methods.

Scores of RSM index along with HUB Depressed, Newman, Adamic-Adar, Preferential and Resource Allocation indexes.

Normalized scores of RSM index along with HUB Depressed, Newman, Adamic-Adar, Preferential and Resource Allocation indexes.

Comparison graph with HUB Depressed, Newman, Adamic-Adar, Preferential and Resource Allocation.

Comparison graph of RSM index with all considered methods
It is observed that the Common neighbour method is giving higher values of predictions compared to RSM index. The results are different for the links of serial number 14, 28, 33, 37, 39, 41, 49 and 51 (see (Fig. 13);). For illustration, take serial number 14. It is the link between SS and TS. Common neighbour method only counts the number of common neighbours, but RSM index checks the natures of common neighbours. Thus the results are expected from human behaviour. The result is almost the same for Salton index. The difference is that Salton index is lower than Common neighbour index.
For the case of Jaccard method, the result is proportional to RSM except for the mentioned links. In those case, the index has opposite peaks. However, RSM index has lots of overlapping results. Few scores are higher than RSM, and few are lower than that. For HUB promoted index all the scores are much higher than RSM index. For example, link 1 (MA-TP) has the lowest prediction value for RSM and HUB promoted has the highest value. However, for this case, RSM index is very accurate as the nature of common node between MA and TP is very contradictory (value is very low).
The almost same result is shown for HUB depressed but the scores are half than that of HUB promoted. L H Newman index has similar scores with RSM index except for that particular links of serial numbers 14, 28, 33, 37, 39, 41, 49 and 51 (see (Fig. 16);). The same can be said about Adamic Adar and Preferential attachment. But Resource allocation has a similar result to RSM to a large extent. But the scores on those mentioned links are strictly opposite. Thus it can be concluded that RSM index is the much more expected result for link prediction than any other existing methods.
All the previous method of link prediction was prepared based on the number of neighbours. However, in real life score of link prediction is dependent on nature/ characteristic/ personality of the common friend. Here a new method of link prediction, namely RSM index, was introduced. Here, this method depended on this nature/ characteristic/ personality of a common friend. Still, RSM index has some limitations like it could not count the indirect neighbours and their natures, i.e., this result will make more effective if taken two or three path neighbours. Also, sometimes, the negative nature of common friends affect the link prediction between two unknown people. Those are to be included in future studies. This study makes a comparison of RSM with ten suitable existing methods. However, for simplicity, the scores of RSM index is well expected.