
Abstract
Estimating similarity using multiple similarity measures or machine learning prediction models is a popular solution to the link prediction problem. The Relation Pattern Deep Learning Classification (RPDLC) technique is proposed in this study, and it is based on multiple neighbor-based similarity metrics and convolution neural networks. The RPDLC first calculates the characteristics for a pair of nodes using neighbor-based metrics and impact nodes. Second, the RPDLC creates a heat map using node characteristics to assess the similarity of the nodes’ connection patterns. Third, the RPDLC uses convolution neural network architecture to build a prediction model for missing relationship prediction. On three separate social network datasets, this method is compared to other state-of-the-art algorithms. On all three datasets, the suggested method achieves the greatest AUC, hovering around 99 percent. The use of convolution neural networks and features via relational patterns to create a prediction model are the paper’s primary contributions.
Introduction
Online social networks like Facebook, Twitter, and Youtube are exploding, and figuring out how to locate the missing ties has become a critical problem that is drawing academic and industrial researchers [4, 57].? Or, on Github, a recommender system that helps users locate software tools that fit their interests [58], friend recommendations on various social networks, such as Twitter and location-based Foursquare [19]. Furthermore, this field has had data security issues, which have been addressed in earlier studies [6, 53–55].
A topological graph representing individuals or organizations can be used to illustrate a social network. There are three popular techniques for predicting whether a pair of nodes or not [52]?will have a connection. Node-based, topology-based, and social theory-based techniques are the three most prevalent types of methods. Meanwhile, based on these metrics, several link prediction algorithms have been proposed, and various machine learning algorithms have been used to improve the efficacy of the link prediction [11, 44].
In recent years, social network theorists and researchers have suggested a number of methods for solving the link prediction problem. For example, Liang and Shuai proposed an ensemble technique based on neighbor-based metrics to deconstruct conventional link prediction issues into subproblems [11]. Leskovec et al. developed a logistic regression based on node and triad degrees to forecast directed social networks with good accuracy [29]. To solve the link prediction problem, the techniques employed a machine learning architecture.
Since most earlier studies on link prediction using machine learning algorithms based on similarity metrics have ignored the entire pattern of relationship, Due to memory and algorithm constraints, traditional link prediction algorithms cannot manage huge social networks and lose a lot of information in big data environments. To enhance connection prediction in real-world social networks, this study presents a deep learning framework based on novel feature extraction techniques.
To improve link prediction accuracy, a deep learning model and a new feature extraction method are proposed. To extract connection features from the target node’s social network, this study uses standard neighbor-based metrics based on related edges. It also facilitates the creation of heat maps by assessing similarity between nodes. Using a convolution neural network, the proposed technique also detects consistency between two node’s connection patterns.
By assessing path length, the suggested technique reduced the sample size on a vast social network. If the path’s length exceeds a threshold. So dissecting their connection is pointless. The proposed approach enhances link prediction performance by extracting more essential characteristics and leveraging strong deep learning architectures to build prediction models.
In this article, the proposed approach combines deep learning architecture with a new feature extraction method to improve the performance of solving the link prediction issue. The suggested algorithm’s major contributions are mentioned below. This paper makes the first attempt to use convolution neural network, which is a generally deep learning framework for image classification, to solve this problem. The proposed novel feature extraction method not only considers the similarity between two nodes in each edge, but also considers the similarity with the most important nodes on the social network. The procedure for decreasing the sample size by the path length between two nodes can effectively remove the weak relationships and prune the inefficient information.
There are five key components to this article. The first section introduces the topic of link prediction and offers some background information. The second section examines the literature as well as related works. The proposed algorithm is shown in Section 3. The experimental findings are presented in Section 4, and the conclusions and future work are discussed in Section 5.
Related work
This section reviews link prediction approaches and conventional deep learning architectures. The first segment introduces topology-based measures, social theory-based metrics, and machine learning-based prediction methods. As a result, topology-based and social theory-based link prediction metrics are frequently employed to compare two nodes’ similarity. The following part examines traditional convolution neural network designs and methods, and highlights their major contributions to increasing link prediction performance and efficiency.
Link prediction problem of social network
The link prediction issue is concerned with predicting missing social network relationships. The associated link prediction approaches are discussed in this section.
Topology-based metrics
Most similarity measures rely on social network topology. Topology-based metrics were considered. Their work led to numerous topology-based measures [31]. The three most often used topological metrics are discussed here. First, neighbor-based metrics assess two nodes’ similarity. Second, The number of distinct distances between the two nodes estimates the similarity. Finally, random walk based metrics evaluate similarity using random walk steps.
Neighbor-based Metrics. The neighbor-based metrics employ each node’s neighbors to compute similarity. Assume N x is a social network node, Γ (N x ) is the set of neighbors based on x. In earlier research, 11 measures were developed to compare two nodes in social networks.
The following neighbor-based metrics employ Common Neighbor (CN) [8] to compute the intersection of neighbors between two nodes. The more common neighbors they have, the closer they are.
The Jaccard Coefficient (JC) normalizes the size of shared neighbors [21]. JC is similar to CN, but it also considers the total neighbors of a pair of nodes.
Sørensen Index (SI) focuses on the lower degrees of nodes that have a greater connection probability [46]. The greater SI is because both nodes are low degree.
Salton Cosine Similarity (SCS), which was proposed by Salton and McGill in 1983 [10].
Hub Promoted (HP) is the topological overlap based on a pair of nodes, and the HP measure is considered by the nodes with a lower degree [42].
Hub Depressed is identical to HP, except it is utilized by nodes with a higher degree. [59].
Leich-Holme-Nerman (LHN) is defined as the similarity between two nodes. The higher value of LHN is because both two nodes have many common neighbors [28].
Parameter-Dependent (PD) was proposed by Zhu et al. [3]. They incorporated a free argument λ to take into account a higher number of neighbors.
Adamic and Adar proposed the Admic-Adar (AA) coefficient [1]. It is currently utilized in social networks. Physically, the AA measure is greater, meaning common neighbors are fewer.
Barabási et al. instructed Preferential Attachment [2]. It indicates that more adjacencies lead to a greater similarity assessment. It also solely relies on the neighbors of each node in a pair, not the shared neighbors.
Similarly to the Adamic-Adar Coefficient, Zhou et al. suggested Resource Allocation in 2009 [59]. But Resource Allocation does not penalize high degree neighbors.
Path-based Metrics. Along with neighbor-based metrics, path-based metrics are widely used to assess node similarity. It looks for a link between two nodes that has numerous paths with small distance. The distance between two nodes is the number of edges between them, thus if the distance is 2, then two edges separate them. There are four metrics suggested for evaluating the similarity of two nodes via their paths.
In 2009, L
Katz Index was proposed by Katz [23], which is the ensemble based on all paths with different distances, to measure the similarity between node pairs.
FriendLink, which was proposed by Papadimitriou et al. in 2012 [40], is a similarity metric based on counting number of all path with different distance between two nodes, and it is similar to Local Path.
Relation Strength Similarity(RSS), which was proposed by Chen et al. in 2012 [7], is calculated as the similarity score based on relation strength R (N x , N y ) between two non-neighboring nodes.
Random Walk based Metrics. Beyond the above-mentioned indexes, random walk based metrics presume that methods randomly choose a node and the node has a probability of walking to either neighbor. Finally, the random walk metrics can create the random walk model for finding similarity between two nodes.
Hitting Time(HT) is the number of random walk steps, that calculates the steps based on node N x reaches to N y [13]. Therefore, HT is defined as HT (N x , N y ), and the HT is not symmetric because the set of paths based on N x is not same as the set of paths based on N y , that means HT (N x , N y ) ≠ HT (N y , N x ). The physical definition of HT is that a lower value means that two nodes can possibly establish a link.
The Average Commute Time(ACT), which is based on Hitting Time, was proposed by Liu and L
SimRank(SR) was proposed by Jeh and Widom in 2002 [22], which is the random walk method to compute the similarity between neighbors of two nodes, if neighbors are similar then two nodes are also similar. For the physical definition, a lower value of SR means that the two nodes meet faster and the link probably exists.
Pan et al. introducted Random Walk with Restart(RWR) [39] for estimating the importance of node N b to node N a . The node N a randomly walks to neighbors with probability (1 - c) or N a goes back to itself with probability c. It is similar to HT, but has a probability to go back to the previous node.
Social Theory based Metrics. In addition to topology-based metrics, modern social theories such as node centrality [32], structural balance [5, 29], community [41] and closure are used to improve algorithms for predicting missing links or solving other problems in social networks.
Social psychology cites the Structural Balance hypothesis [5]. This theory’s hypotheses are twofold: 1) balanced triadic, e.g. two buddies share a buddy or foe. 2) imbalanced triadic, e.g. two enemies share a buddy or foe. Leskovec et al. presented a structural balance link prediction model [29].
There is a link prediction model proposed by Liu et al. [32], and this similarity measure is based on the node centrality degree, which is the set of neighbors, and a weak relation or tie. If the centrality degree is larger, the node is more important.
Deep learning
Deep Learning is based on multi-layer artificial neural networks and training with gradient descent, that have several main types, are popular, including convolution neural network, recurrent neural network, such as Long Short-Term Memory (LSTM) and Gate Recurrent Units (GRU), and Generative Adversarial Network (GAN).
This section presents the state-of-the-art convolution neural network architectures and techniques, including LeNet5, AlexNet, VGG net, dropout, Adam Optimization, and other popular convolution neural network architectures or techniques in recent years.
Activation functions
This part introduces the activation functions, because those functions can convert the input value to an output value for the next layer with a different property. There are many activation functions to convert the original output in each convolution or fully-connected layer that can possibly avoid vanishing the gradient problem, which means the output value of previous layer becomes extremely small, or gradient exploding problem, which means the output value of the previous layer becomes extremely large. This part presents several universal activation functions as the following description and mentions the characteristic for using rectified linear units in the proposed algorithm.
There is a standard logistic function, called sigmoid, that delimits the real value into the range [0, 1]. However, the sigmoid squashing the value into a very small output range would result in a vanishing gradient problem in the multilayer neural networks.
The Tanh function squashes the real value into the range[-1, 1] that also has the vanishing gradient problem. The mathematical function is tanh (x) =2σ (2x) -1.
To figure out the problem of the vanishing gradient problem using sigmoid and Tanh functions, the Rectified Linear Unit (ReLU) was proposed. ReLU is popularly used in CNN architectures in recent years, which was first proposed by Nair et al. [37]. ReLU is different from sigmoid and Tanh function because ReLU does not squash the input value, which is presented as the following Equation
Dropout
For solving the overfitting problem, which is a general problem in training the model of CNN, dropout was proposed by Srivastave et al. in 2014. Dropout is a technique for solving overfitting [47]. The primary idea of dropout is to randomly drop neurons from the neural network during the training step.
Adam optimizer
In addition, the learning rate is the most important hyperparameter for gradient descent. There are many approaches that find the best solution and Adam optimizer is one of the powerful algorithms to set up the learning rate for gradient descent because it achieves good results, is fast, and can dynamically adjust the learning rate. It was proposed by Kingma and Ba in 2015 [24] who combined the popular optimizer advantages of both AdaGrad [12] and RMSProp [18].
LeNet5
LeNet5 was proposed as a seven-layer CNN architecture by LeCun et al. in 1998 [27] that established the foundation of CNN architecture by three main layers, including convolution, pooling, and fully-connected layer, and used to recognize MNIST dataset, which contains all 58,527 digital samples of hand-written numbers. It obtained high performance based on the sigmoid or Tanh non-linear function and used average pooling to reduce the computational cost.
AlexNet
In 2012, AlexNet was constructed by Krizhevsky et al. [26] to win the challenge in ImageNet ILSVRC 2012 by reducing the top-5 error to 15.3%. AlexNet is quite similar to LeNet5, but it is more complex, bigger, and deeper. There are several new techniques to be used: ReLUs function trains faster than Tanh and sigmoid, and solves the vanishing gradient problem. Spreading the network across two Nvidia GeForce GTX580 GPUs with parallelization to drastically reducing the cost of computation. Using Local Response Normalization (LRN). Because ReLUs have the characteristic that do not normalize the input feature, so they need a layer to facilitate generalization. LRN leads to promote the top-5 error rate from 13% to 11% on the CIFAR-10 dataset. Max pooling layer replaces average pooling layer that is the overlapping scheme with stride smaller than the kernel and can avoid overfitting. Data augmentation that generates a new image by translations and horizontal reflections. Using dropout to randomly drop neuron units to avoid overfitting.
VGG
VGG net was introduced in 2014 by Simonyan and Zisserman [45] and is similar to AlexNet, but only uses 3 × 3 kernel in convolution layers and 2 × 2 kernel in pooling layers. Let bigger kernel disassemble to 3 × 3 kernel, e.g. 5 × 5 kernel can disassemble into two 3 × 3 kernels, 7 × 7 kernel can disassemble into three 3 × 3 kernels, that lead to a reduction in the amount of parameters and have a better feature extraction ability. VGG16 and VGG19 are commonly used nowadays.
Other state-of-the-art CNN architectures
Furthermore, there are many CNN architectures to accelerate the growth of this field. For example, Google Inception v1 was proposed by Szegedy et al. in 2014 [48] that introduces the concept for inception module, which combined maxpooling and several convolution kernels with varying sizes, and removed the fully-connected layers. Google Inception v2 was proposed by Szegedy, Christian, et al. in 2016 that implements the batch normalization in every layer of the convolution neural network to scale the output value for improving the performance [49]. Google Inception v3 was proposed by Szegedy et al. in 2016 [50] that disassemble the convolution kernels, such as 7time7 kernel disassembles to 7time1 and 1time7. RestNet was proposed by He et al. in 2016 that is a very deep network based on 152 layers and mentioned the residual blocks to improve the performance [17]. And Gao Huang et al. proposed DenseNet in 2016, which connects each layer to every other layer in a feed-forward fashion [20].
The proposed method: RPDLC algorithm
This study used a deep learning method called Relation Pattern Deep Learning Classification (RPDLC) to identify missing edges on a social network. Extracting features and developing deep learning classifiers were involved.
The neighbor-based metrics
The proposed approach uses five neighbor-based metrics: JC, SI, HP, HD, and LHN. These measurements are simple, quick, and widely used.
The proposed pseudo code
In Algorithm 1, the neighbor-based features is generated, including JC, HD, HP, SI, and LHN metric, between N a and N i ∈ N, which is identical to N b .
The Pseudo Code of RPDLC Algorithm
1: set the predefined δ value, where 1≤δ ≤ N;
2: defined N influence is the collection of important nodes.
3: n = |N|;
4: defind N d is the collection of CentralityDegree (N)
5:
6:
7: N influence adds the node N h with the highest value in N d ;
8: N d removes the node N h ;
9:
10:
11:
12:
13: P a = (N a , N i ) excerpts the values from (JC, HD, HP, SI, LHN);
14:
15:
16:
17:
18: P b = (N b , N i ) excerpts the values from (JC, HD, HP, SI, LHN);
19:
20:
21:
22: normalize values by z-score normalization;
23: H = P a + P b ;
24:
25:
26:
27: train CNN prediction model by Section 3.3
28:
29:
The algorithm then combines the Na and N b feature vectors and uses z-score normalization (Equation 1) to reshape to a new matrix Features (m, len), where m = 5 ×2 represents five distinct neighbor-based metrics (JC, HD, HP, SI, LHN) multiply two nodes per edge, and len represents all N in the social Finally, the missing link prediction model employed a convolution neural network architecture like AlexNet or VGG16.
To implement the Algorithm 1, it was found out the problem on the large network, if N is very big, the computational complexity and consumption would experience an exponential growth. Besides, the datasets of the social networks are usually imbalanced, which have large disparity between the number of majority and minority categories. The reasons result in extreme time of extracting feature and difficultly training a good enough classifier of convolution neural network algorithm with the imbalanced data.
Therefore, there is an approach in Algorithm 1 to improve the efficiency and to reduce the consumption of computational time. The proposed approach is based on the shortest path distance between a pair of nodes, which indicates the higher value of shortest path distance for the weaker relationship, and vice versa. Hence,
Algorithm 1 enhances performance. The number of nodes increases with the size of the social network, resulting in an incalculable calculation for extracting characteristics from the dataset. As a result, degree centrality is used to reduce the number of parameters in each sample. The degree centrality of a node is one of the most often used measures for measuring the number of edges to a node. The degree centrality in directed social networks has two types: in-degree is the number of incoming edges and out-degree is the number of outgoing edges, while in undirected social networks there is only one kind. The proposed approach selects important nodes by ranking all nodes with degree centrality and utilizes δ as the threshold value for determining influential node size. Thus, the most significant nodes in the social network dataset are defined as N influence . Algorithm 1 uses this method to substantially decrease computing resources.
After completing the process of feature extraction, categories by the features are classified, which was extracted using the above algorithm. We introduce the deep learning architecture in the following section to build the proposed prediction model.
Convolution Neural Network (CNN) has become the major research in computer vision over the past few years. It is a special type of neural network based on two primary ideas: 1) To find images as the 2D or 3D structure that have a high correlation between the neighborhood of pixels. CNN relies on sharing the features and each channel uses the same kernel function for all pixel locations. 2) To introduce the concept of pooling that makes the network to gradually see larger portions of the input images, which decreases the effects of small variations in position. In the following sections, we mention the important layers and concepts of CNN, including the convolution layer, pooling layer, and fully-connected layer.
After examining the strong approaches for CNN in section 2.2, the proposed method’s deep learning framework leverages the principles to create the CNN architecture for predicting missing links. Preliminarily, the framework constructs layers similar to AlexNet and VGG nets, which stack convolution layers with just 3 × 3 kernels and max pooling layers, respectively This allows us to utilize SeLU as an activation function for translating output values across layers, which normalizes the output value and solves the vanishing gradient problem. Second, the system employs dropout to reduce overfitting while enhancing prediction model generalization. Finally, the framework uses Adam Optimization to regulate the training speed. To summarize, the proposed technique uses a unique feature extraction methodology and CNN framework to predict potential links in the social network domain.
Experiments
This section describes our experimental setup and outcomes. The experiment’s goal is to anticipate missing connections in three social network datasets.
Experimental setup
Description of datasets
To evaluate the suggested approach of link prediction in diverse social networks, we used three real-world datasets. Jazz, which is the collaboration network between Jazz musicians by Pablo M. Gleiser and Leon Danon [14]. Each node is a Jazz musician and each edge exists if two musicians played in at least one common band. NetScience, which is the co-authorship network of scientists working on network theory and experiments, as compiled by Newman [38]. Facebook is the friendship network of participants using Facebook, the famous social networking services. This dataset consists of friends lists, ego network, and node features (profile), if a participant follows another, they will have an existing edge [36].
The detailed information about these datasets is described in Table 1. Each original dataset is split into ten equal-sized subsamples. Two subsamples were kept as test data for the testing model, while the other eight were utilized as training data for the training model.
Statistics of three datasets
Statistics of three datasets
The studies employ a common metric, the Area Under Receiver Operating Characteristic Curve (AUC) [16], to assess the accuracy of link prediction models. The AUC metric is the likelihood that a randomly picked absent edge would outperform a randomly chosen non-existent edge [59]. There are numbers of n′ when the missing edge has a higher score than the non-existing edge and numbers of n″ when the score is equal between the missing and non-existing edge among n independent comparisons. Equation 2 is used to define the AUC.
In this case, the AUC will be about 0.5. AUC >0.5 implies greater algorithm performance.
Experimental results
Experimental Results are divided into four sections. First, the experiment presents the result by improving the proposed algorithm with the shortest path and discusses the effects. Second, the experiment was implemented by the method with varying sizes of influence nodes and presented the result, which showed the effects for the computation cost of feature extraction and visualization of feature map with each size of influence nodes. Third, the experiment showed the AUC of the RPDLC algorithm on three datasets, including Jazz, NetScience and Facebook, further to compare with other link prediction algorithms. In addition, the experiment treated about five different similarity metrics that discussed the effectiveness of each metrics used independent with the proposed algorithm and finally, comparing the three datasets.
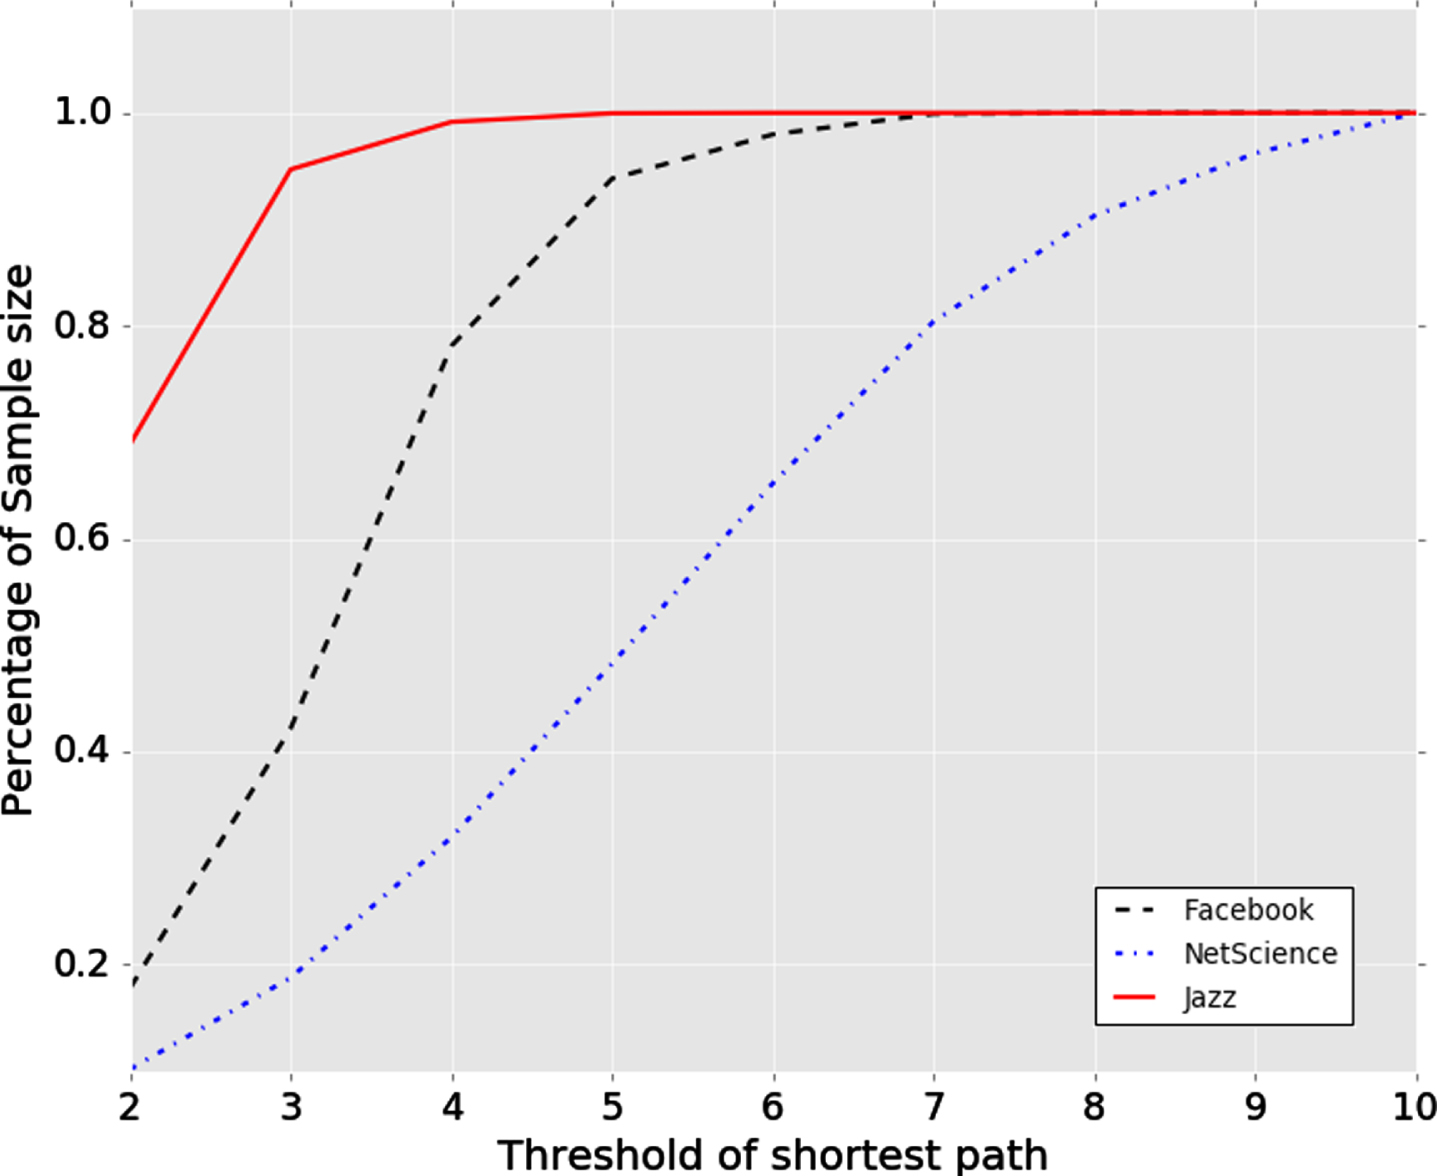
Result for different threshold of shortest path
The different threshold values of the shortest path influenced the size of samples as shown in Fig. 1 and Table 2 on three datasets, if the threshold value was bigger resulting in a larger size of samples. However, the proposed approach also avoided the special case between two nodes, when it was not possible to reach from N a to N b by any path. This extreme case has no link, such as the NetScience dataset, and has a very low degree network that can ignore the abnormal sample by the proposed approach. To sum up, it contains two main functions, including sample reduction by setting a different length of the path and precluding a sample of two nodes without any path.
Effectness by different shortest path.
Sample size by each threshold of shortest path
In this section, the result is presented on the effect of varying sizes of influence nodes that showed the large size of influential nodes. This increased the computation time and the experiment results are depicted in Fig. 2. However, the size of influential nodes would affect the performance for training CNN model of link prediction, a larger influence size results in a lower accuracy. Because the large size of influence probably contains the not important nodes or outliers. Hence, we need to find the balance between both costs of computation and performance for the training model.

Extraction time by different size of influence node.
Five baseline and link prediction methods were considered: CN [8], AA [1], RWR [39], FL [40], and PNC [56]. In RWR, c = 0.001, l = 3, and p = 1. The RPDLC algorithm is detailed in Table 3. Table 3a shows the configuration for extracting features for three datasets with various shortest path thresholds. It was decided to take all samples from Jazz dataset and use 6 as the cutoff value for shortest path because the dataset was small. As a low degree social network, the experiment utilized 11 as the threshold value on the NetScience dataset. The threshold value decreased samples by discarding samples with no path between two nodes and nearly held samples with any path distance. In the end, the Facebook dataset was selected because it was huge and a minimal threshold was employed to minimize the sample size. A collection of hyperparameters for the proposed CNN models is provided in Table 3b. The CNN training environment uses Tensorflow 1.5.0 and a GTX 1080Ti GPU.
Detail of setup for constructing model
Detail of setup for constructing model
As shown in Figs. 3, 4 and 5, the RPDLC algorithm achieved the highest performance of AUC on all datasets. The PNC algorithm had the second highest performance of AUC next to the RPDLC algorithm on all datasets. The FL obtained the third performance of AUC on Jazz dataset that had the highest degree. The RWR obtained the third performance of AUC on both NetScience and Facebook datasets, which was the lowest degree of social network with a lower probability to randomly walk to incorrect paths. The similarity-based method using neighbor-based metrics, including AA and CN, only considered the set of common neighbors and an approximate way to predict links which resulted in a average performance. In consequence, RPDLC algorithm combined the simple features based on neighbor-based metrics and CNN models to greatly get a better performance of AUC than PNC, FL, RWR, AA and CN algorithms in the experiment.

AUC value of different algorithms in Jazz dataset.

AUC value of different algorithms in NetScience dataset.
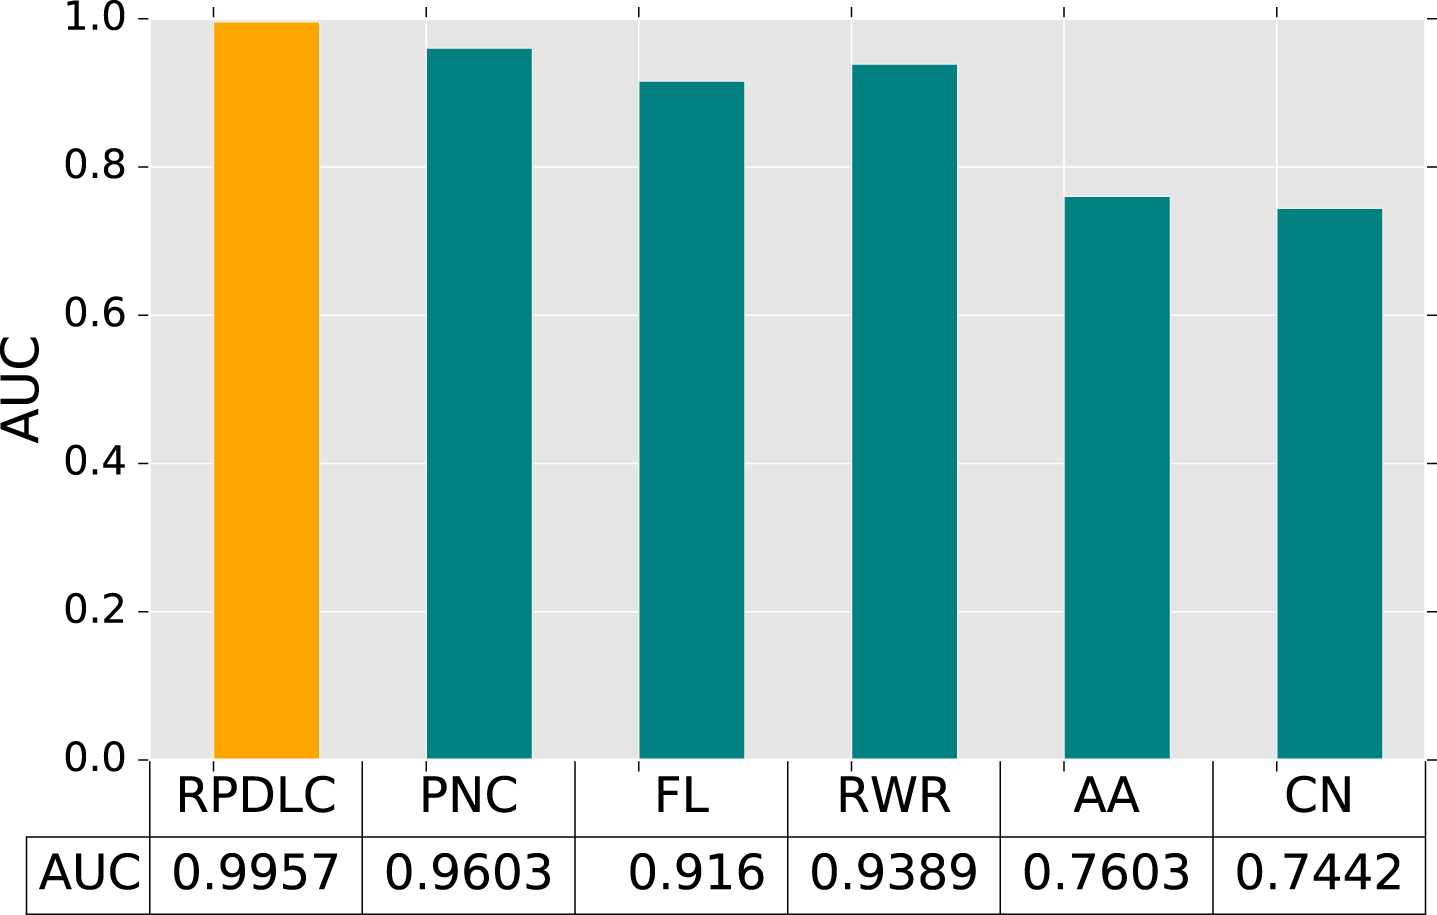
AUC value of different algorithms in Facebook dataset.
In the final section of results, we further compare the performance of each neighbor-based metric we used, as depicted in the Figs. 6, 7 and 8. First, as shown in Fig. 6 which presents each metric with the high value of AUC, if the social network had a high degree. Second, as shown in Fig. 7 the metrics including HP, HD and LHN are presented, which obtained the average performance, probably because of the social network with a very low degree. The low degree social network leads to HP, HD, LHN find out an uncommon value, such as 1 or 0, and lose the characteristic of those metrics. Finally, as shown in Fig. 8 that presented SI, HP and LHN metric could probably obtain an average performance by the set of degree with an uneven distribution.
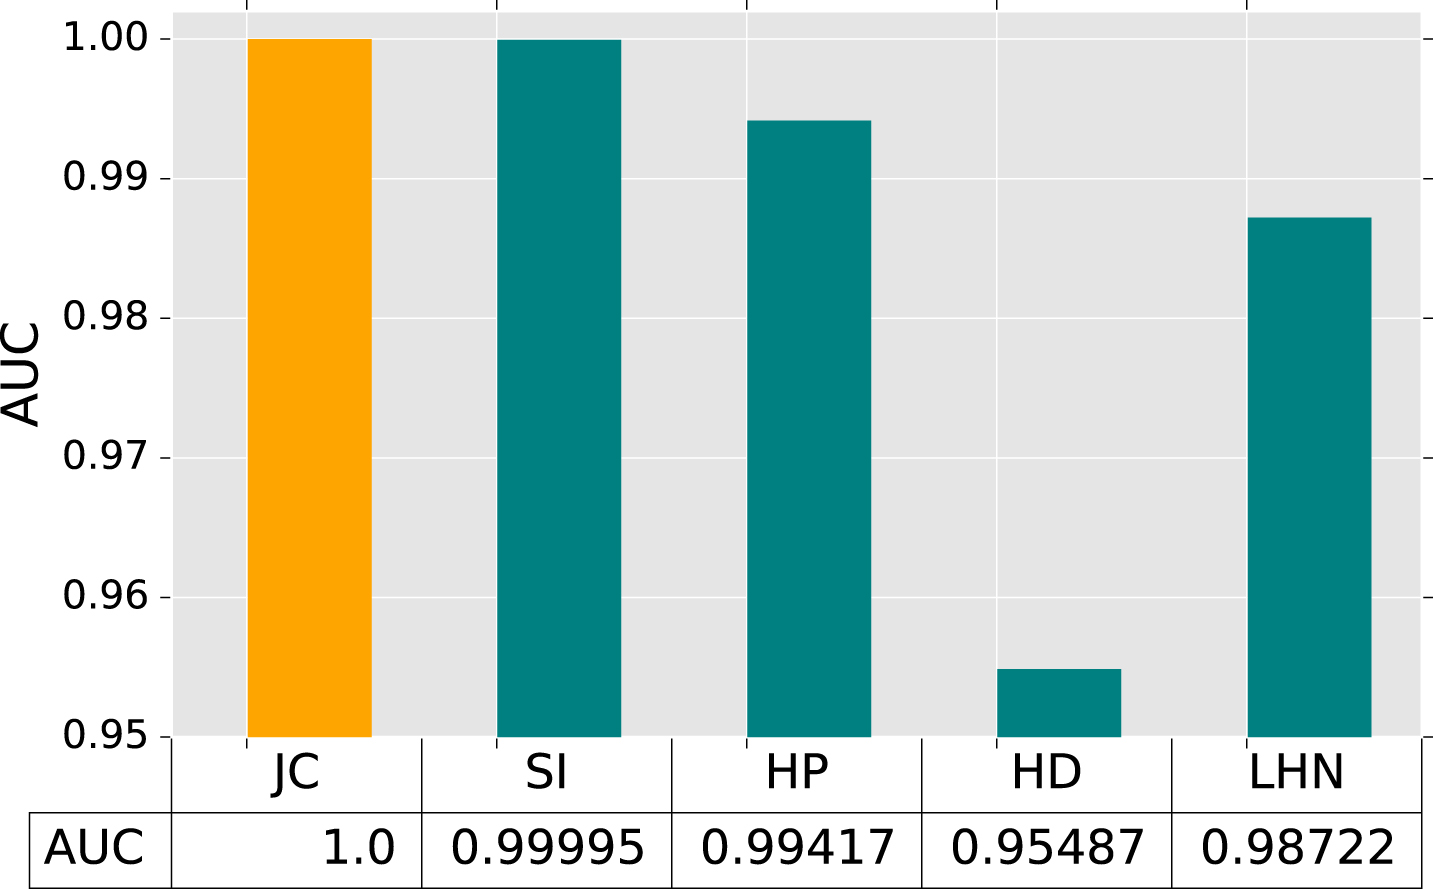
AUC value of RPDLC algorithm by each metric in Jazz dataset.

AUC value of RPDLC algorithm by each metric in NetScience dataset.
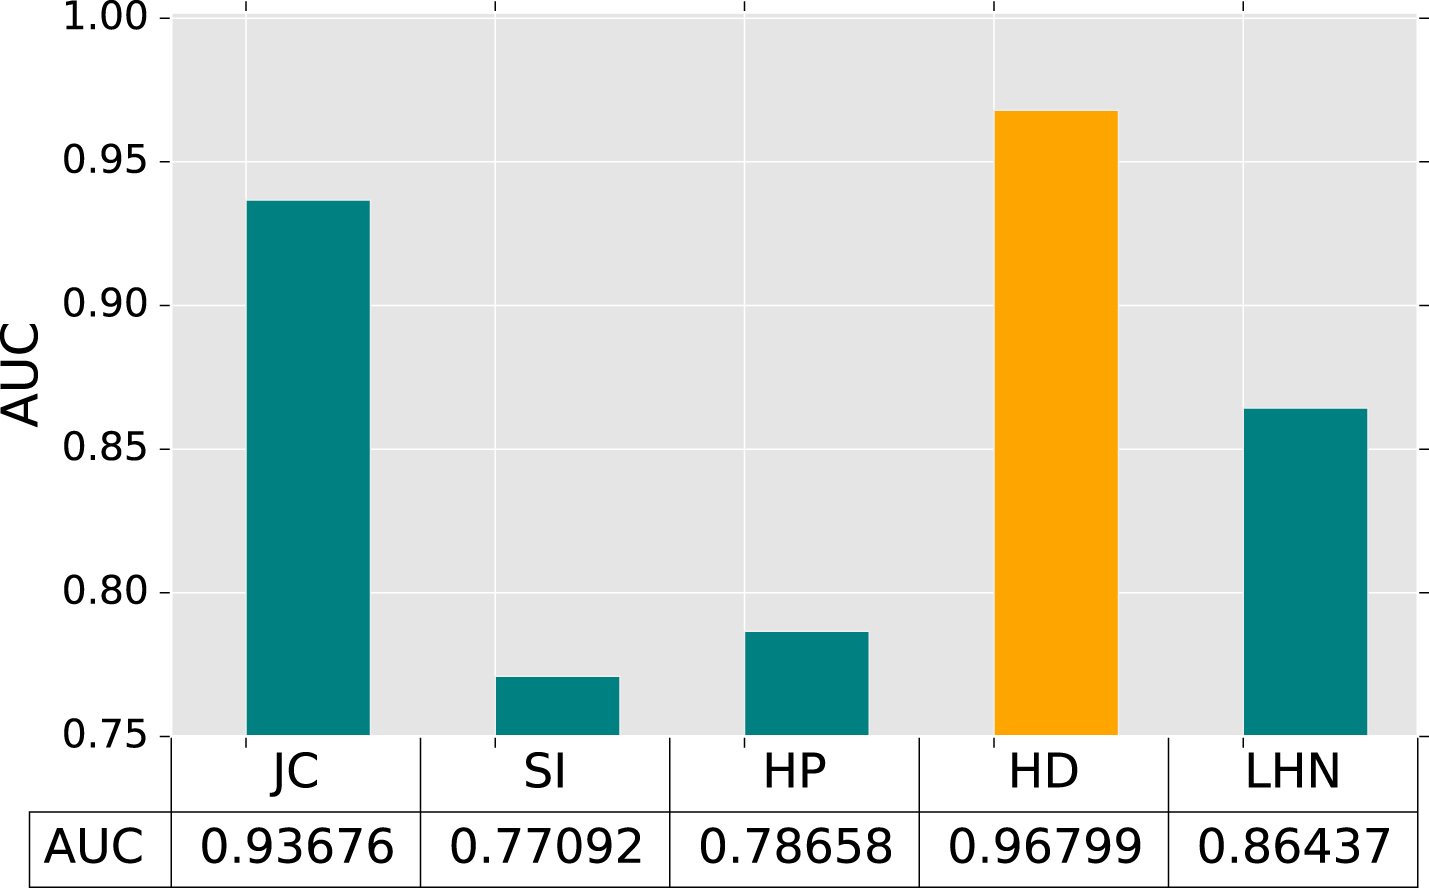
AUC value of RPDLC algorithm by each metric in Facebook dataset.
Encouraging nodes and neighbor-based metrics were used to extract unique features from the convolution neural network model. The main contribution is a deep learning link prediction method that can accurately anticipate missing relationships. This study also used deep learning, a strong categorization approach, to improve the effectiveness of predicting relationships in social networks. The suggested framework outperforms AA, CN, RWR, PNC, and FL. The suggested technique also lowered computing costs by leveraging influential nodes and shortest paths connecting nodes, reducing sample size and parameters per sample, and increasing the training model efficiency. To train the convolution neural network model for predicting missing links, the suggested technique employed five neighbor-based metrics simultaneously: JC, SI, HD, HP, and LHN. According to the experimental results, the size of influential nodes influenced feature extraction time, the shortest path threshold reduced sample size (from 16,313,521 to 6,878,493), and independent training on each metric resulted in worse performance than training on five metrics simultaneously.
Future work
Despite the RPDLC algorithm’s great performance, there is still potential for development. First, the RPDLC method uses CNN, which raises the cost of computation, even with the proposed influential nodes strategy. Moreover, the RPDLC method ignores alternative similarity metrics and solely employs neighbor-based metrics to extract features. The RPDLC algorithm will be extended to include similarity-based metrics (e.g. FL, Katz, and RSS), random walk-based metrics (e.g. ACT, SR, and RWR), social theory-based metrics (e.g. homophily, structure balance, and node centrality), and combinations of different sets of metrics. We should also test the RPDLC method on real-world social network datasets. Finally, more study is needed in complicated networks to determine the RPDLC algorithm’s stability and multi-usefulness.