
Abstract
Dynamic time warping has attracted wide attention in various fields for its high matching accuracy. In time series data mining, dynamic time warping is a robust similarity measure of multivariate time series. However, the high computational cost of dynamic time warping restricts its applications in large scale data sets. In this paper, we propose a novel approach to speed up dynamic time warping of multivariate time series. Multivariate time series are fitted with multidimensional piecewise lines; and then, important points are extracted as features to reduce the dimensions of multivariate time series; finally, the features are imported to dynamic time warping to measure the similarity of multivariate time series. Extensive empirical results indicate that the proposed method can effectively improve the efficiency of dynamic time warping for multivariate time series, and obtain satisfactory matching accuracy.
Introduction
The past decades have witnessed the rapid development of sensor and storage technology. The scale of time series shows explosive growth in various applications, such as finance [1], multimedia [2], medicine [3], traffic [4], gesture recognition [5], etc.
A time series is a sequence of observations x
i
(t), (i = 1, 2, ⋯ , m; t = 1, 2, ⋯ , n) where i indexes the measurements at every time point t [6]. If m = 1, x
i
(t) is called a univariate time series; if m ≥ 2, it is known as a multivariate time series. Since time series from a data set usually have the same sampling rate, they can be simply denoted as X = x1, x2, ⋯ , x
n
, where
The tasks of time series data mining include classification [7], clustering [8], similarity search [9], outlier detection [10], etc. These tasks share a common subroutine: similarity measure [11], which is one of the most fundamental topics in data mining.
Most of the similarity measures of time series are mainly applicable to univariate time series. However, depicting the state of objects usually needs multiple variables. Multivariate time series are more prevalent in most applications. For example, stock can be described with opening price, closing price, average price and trading volume [12]; electroencephalogram (EEG) is measured by 64 electrodes [13]; in the application of sign language recognition, Australian sign language is gathered from 22 sensors on the hands of a native Australian speaker [14].
However, existing similarity measures of multivariate time series cannot ease the conflict between matching accuracy and computational cost. We try to resolve the intractable problem from thisperspective. The main contribution of this paper is that we proposed a method to reduce the computational complexity of dynamic time warping for multivariate time series and obtain satisfactory matching accuracy.
The rest of the paper is organized as follows. In Section 2, we give a review of the related work. In Section 3, a novel approach is proposed to speed up dynamic time warping of multivariate time series. In Section 4, extensive experiments are carried out on the real-world data sets. Finally, we summarize the work and present the future directions.
Related work
Existing similarity measures of multivariate time series mainly include Euclidean distance [15], dynamic time warping (DTW) [16], extended Frobenius norm (Eros) [17], etc.
Euclidean distance
Euclidean distance is the most popular similarity measure. It is parameter-free and has linear complexity. But Euclidean distance is sensitive to scaling and shifting of sequences in the time axis, and cannot measure the similarity of the sequences of different lengths [18]. These disadvantages make it only applicable to some special data sets.
Dynamic time warping
DTW was well-known in the speech-processing community, and it was introduced into the similarity measure of time series by Berndt and Clifford [16].
Compared with Euclidean distance, DTW searches an optimal match between two sequences, which enables it to accommodate scaling and shifting of sequences in the time axis. DTW can measure the similarity of the multivariate time series of different lengths and obtain high matching accuracy. Therefore, DTW is widely used in practice.
However, the computational cost of DTW is expensive, which seriously restricts its applications in large scale data sets [19].
Extended Frobenius norm
Eros is based on statistical theory. It views the observations of multivariate time series as the sample points of random variables, and takes the correlation coefficient matrix as the base of feature extraction. Then, linear space transformation is used to design the model of similarity measure.
Eros can preserve the correlation among different variables of multivariate time series. But it cannot describe the order of the observations in a sequence. For instance, two time series X, Y have the same observations but different order in the time dimension, as shown in Fig. 1.
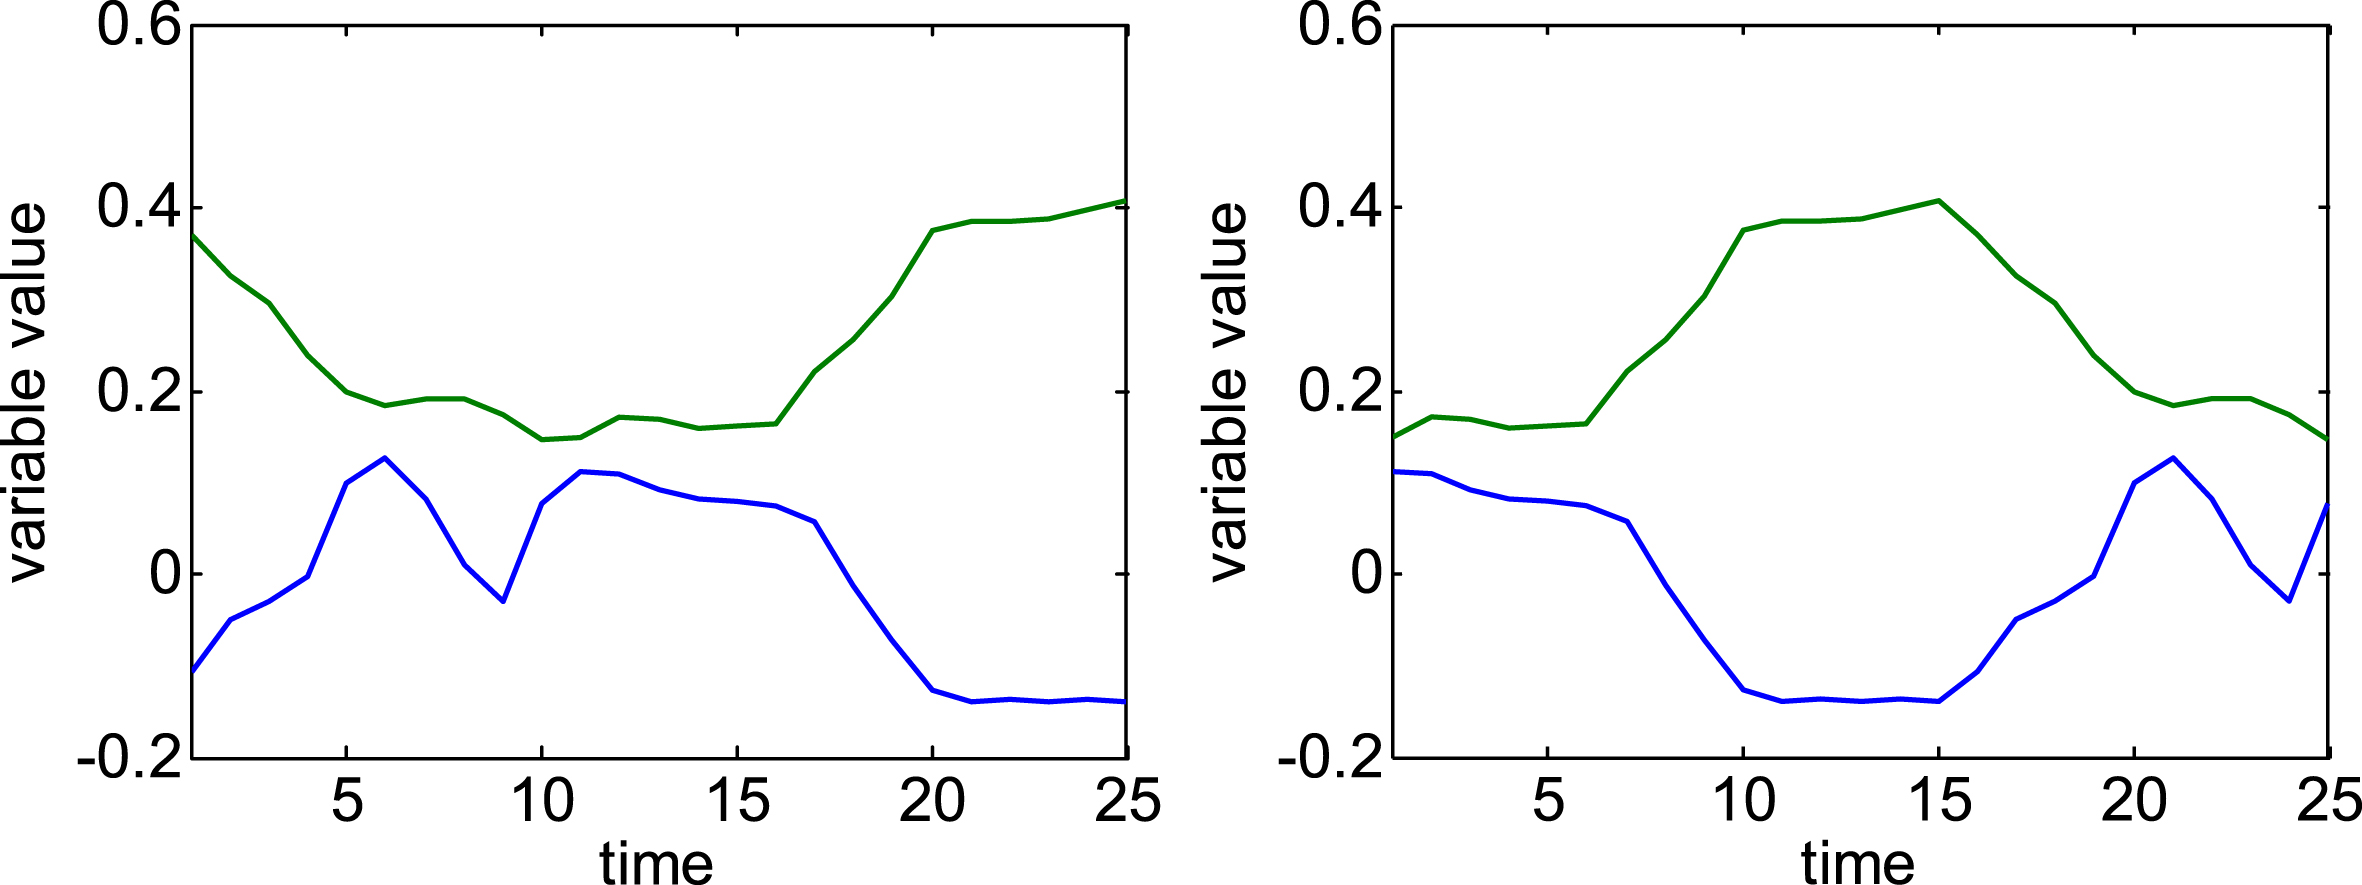
Two time series of the same observations but different order.
Since the correlation coefficient matrixes of the two sequences are identical, Eros views X, Y as the same series. Obviously, this judgement disobeys our intuition. Therefore, Eros is unable to eliminate the risk of misjudgement. Besides, the computational cost of Eros is also expensive.
Moreover, there are some symbol-based methods such as the longest common subsequence (LCSS) [20], edit distance [21]. They convert time series into character sequences, and utilize charactermanipulation technology to measure the similarity of time series. However, these methods are applicable to univariate time series. When the objects are extended from univariate time series to multivariate time series, symbolizing multivariate time series to preserve the correlation of the variables is still a toughtask.
Motivation of the proposed method
From the review of the related work, DTW can get high matching accuracy and deal with the sequences of different lengths. Besides, it dose not resort to symbolization and can describe the order of observations in a sequence.
However, the expensive computational cost becomes the only bottleneck restricting its applications in large-scale data sets. From this aspect, we want to propose a method to speed up dynamic time warping of multivariate time series.
Proposed method
Time series X, Y are regarded to be similar, if
DTW resorts to dynamic programming to search an optimal match between two sequences, as shown in Fig. 2(b). Compared with Euclidean distance, DTW obtains high matching accuracy at the cost of computational complexity. It is difficult to simplify the calculation process of DTW.
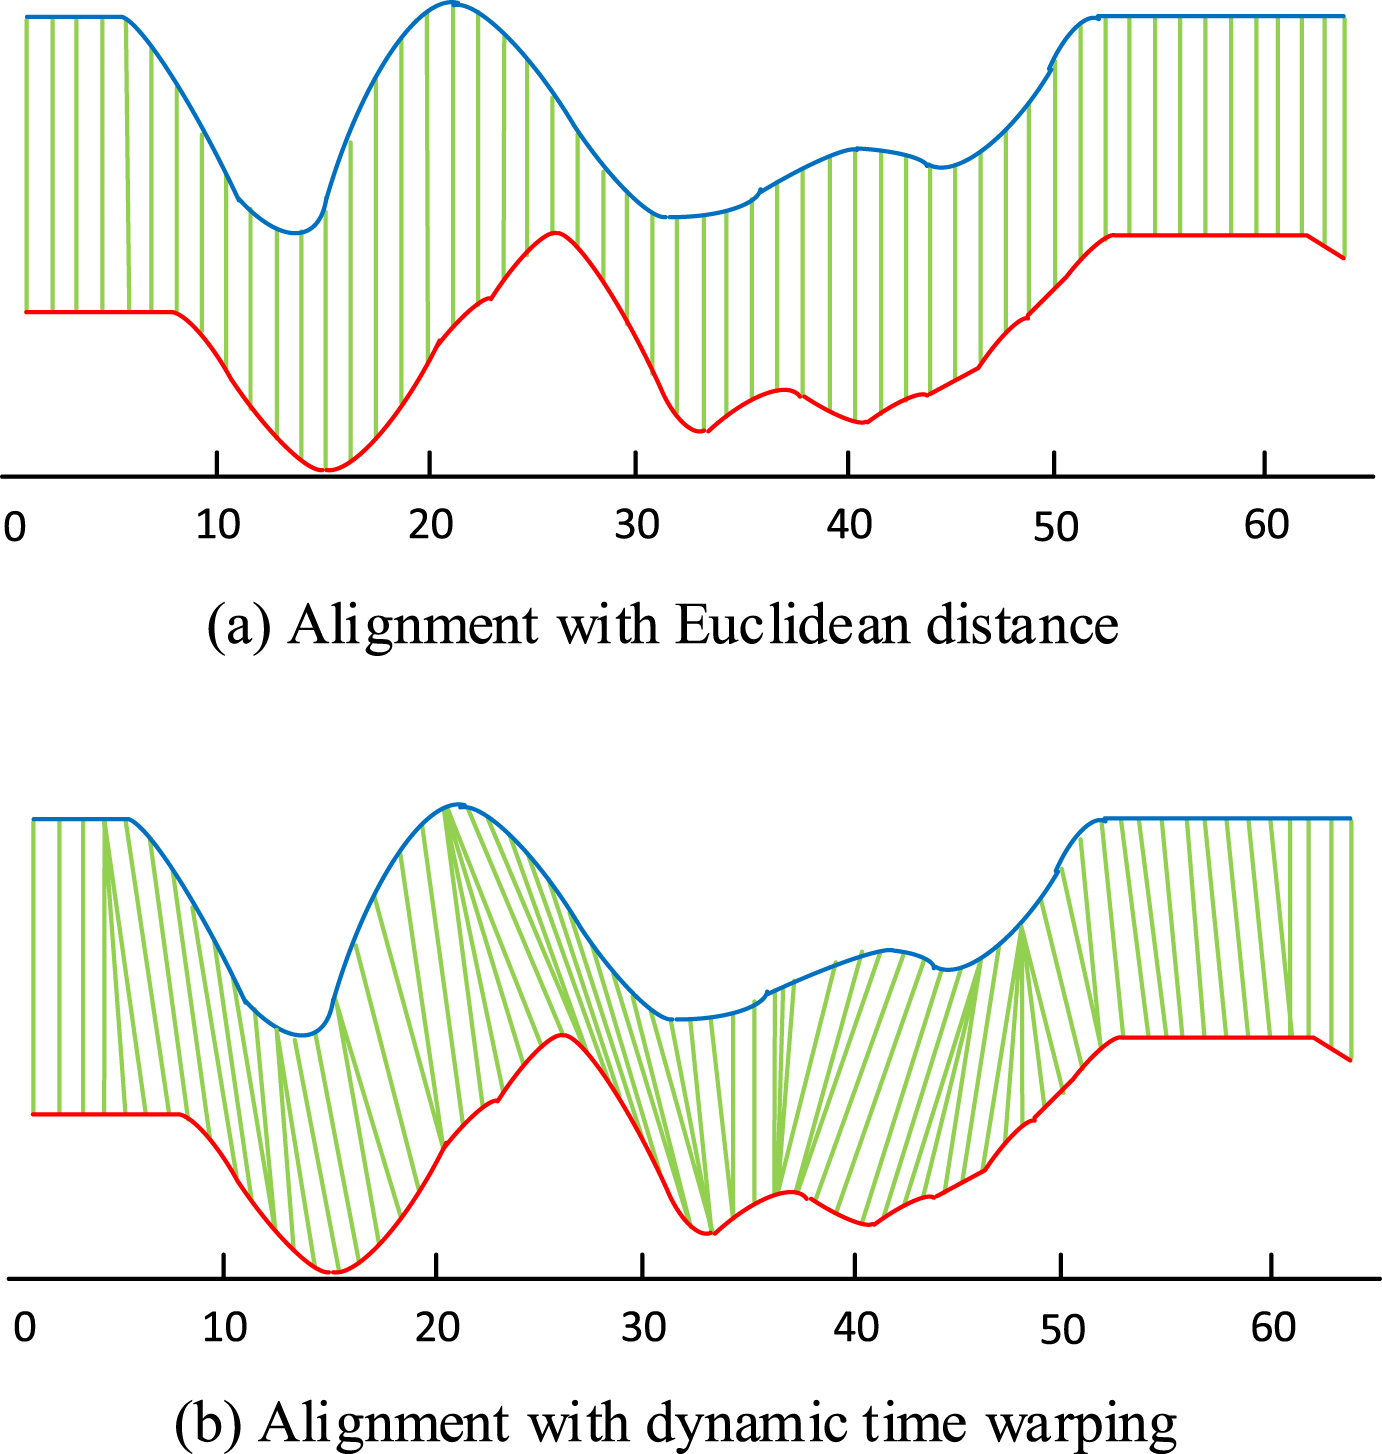
Different alignments of two similar time series.
Since multivariate time series are typically high-dimensional, measuring the similarity on the original sequences is computationally expensive. To speed up DTW, reducing the time dimension of multivariate time series may be an effective direction.
Feature extraction is a prerequisite for similarity measure. Popular feature extraction methods of time series include discrete fourier transform (DFT)[15, 22], discrete wavelet transform (DWT) [23], singular value decomposition (SVD) [24], piecewise aggregate approximation (PAA) [25] and piecewise linear approximation (PLA) [26].
Among the feature extraction methods mentioned above, only PAA and PLA can be used in DTW. We judge the similarity of multivariate time series according to their shape features. Compared with PAA, PLA can describe the shape features of time series more precisely. So we adopt PLA to extract the features of multivariate time series.
The most intuitive idea is to break a multivariate time series into multiple univariate time series, and extract the features of each univariate time series respectively. Then the features of multiple univariate time series are combined into the features of a multivariate time series. But this way ignores the correlation of the variables. Unfortunately, it is indispensable in most applications.
For example, Fig. 3 records the heights of the left and right knees in the process of human walk. If we break the multivariate time series into two univariate time series, and represent them by PLA respectively, as shown in Fig. 3(b), the meaning of the segments is not clear. The reason is that the correlation of the two variables is not considered. So we segment multivariate time series in the related variable dimensions simultaneously, as illustrated in Fig. 3(a). Each segment in Fig. 3(a) corresponds to a walking movement. Based on this inspiration, we propose the multidimensional segmentation method.
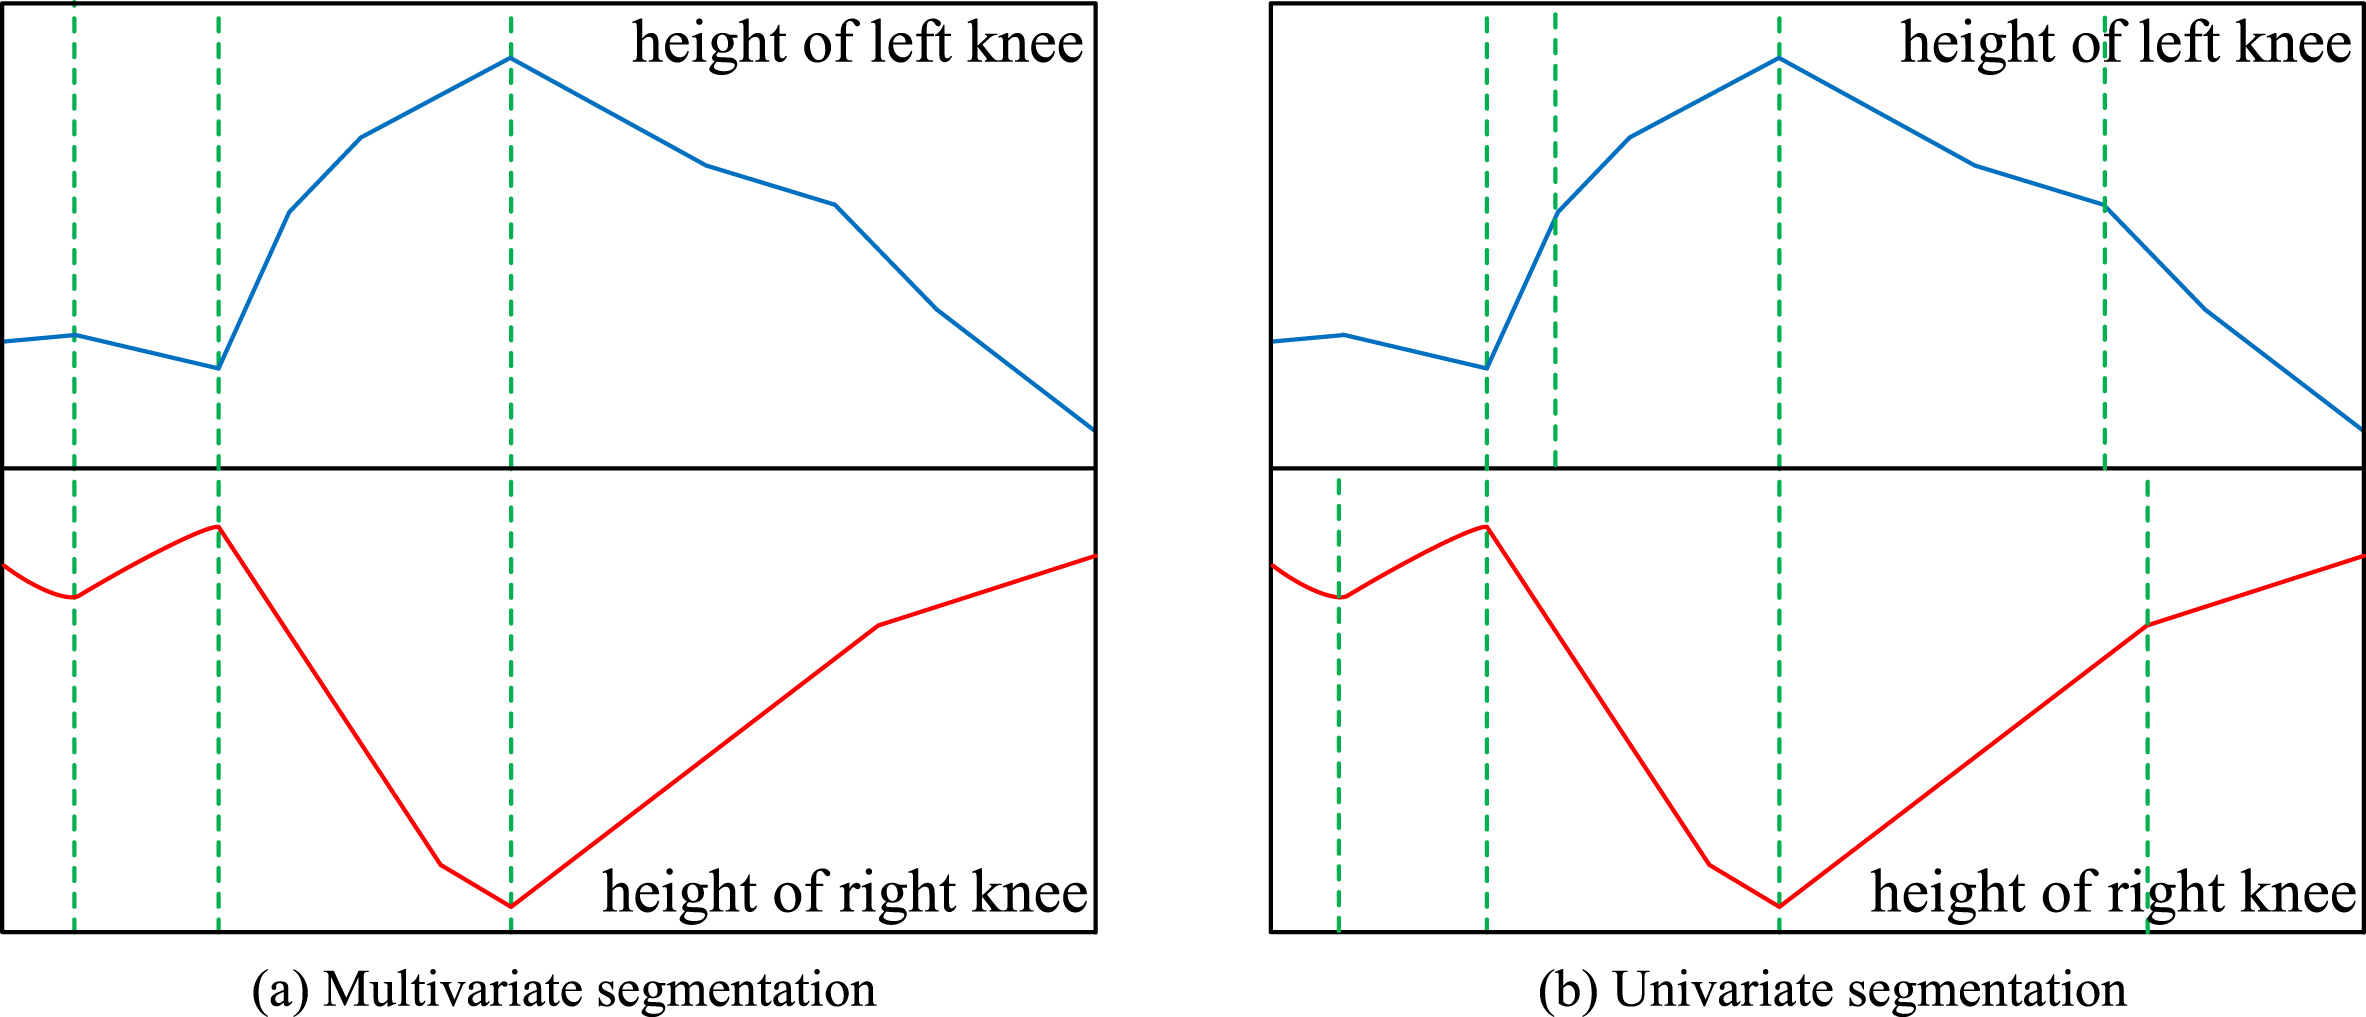
Two ways of segmenting multivariate time series.
Supposing X
i
= x1, x2, ⋯ , x
n
is a section of the sequence in the ith variable dimension of amultivariate time series, and P
i
= p1, p2, ⋯ , p
n
is the fitting line of X
i
, the fitting error between X
i
and P
i
is:
The total fitting error in all variable dimensions is evaluated by:
Considering the linear complexity and online computation capability, we use the window-sliding strategy [27] to segment a multivariate time series in all variable dimensions. When e seg is greater than a given threshold MaxSegError, we start a new segment. The details of segmenting a multivariate time series are described in Algorithm 1.
Algorithm 1 Algorithm to segment a multivariate time series
Initialize e seg = 0;
The first segment starts from the first point of X.
if e seg < MaxSegError
Extend the width of the current segment to
the next point of X;
Update e seg .
else
Add the current segment to T;
Begin a new segment from the current point
of X.
end
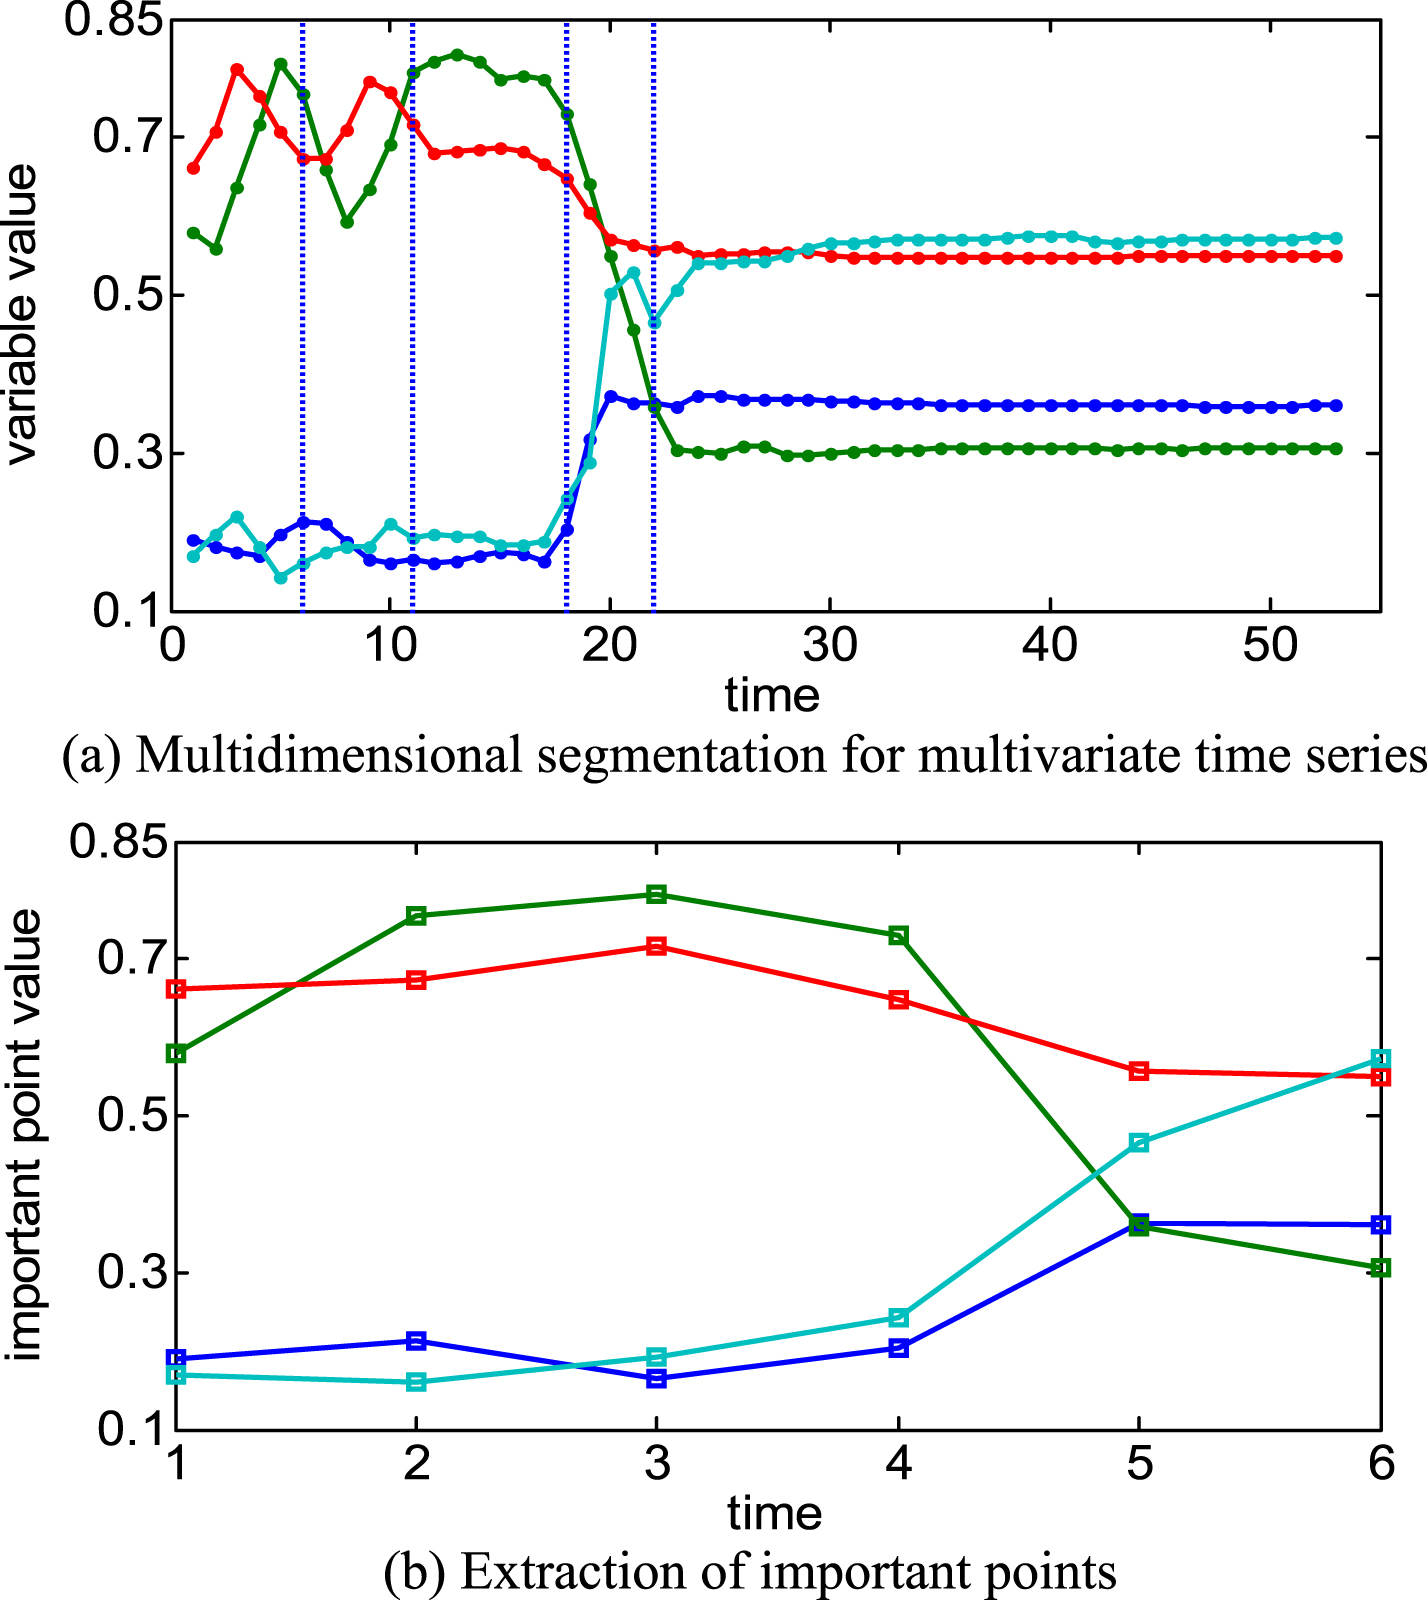
An instance of multidimensional segmentation of a multivariate time series is described in Fig. 4(a). We can see the multivariate time series is divided into 5 segments in all variable dimensions simultaneously.
Feature extraction of multivariate time series.
After the multidimensional segmentation, the first and last points of every segment are chosen as the features of the multivariate time series, as illustrated in Fig. 4(b). MaxSegError is a key parameter to balance the degree of dimension reduction and description granularity of a multivariate time series. In this way, the dimensions of a multivariate time series are greatly reduced.
The features of multivariate time series are imported to dynamic time warping to measure the similarity, called important points - dynamic time warping mehtod (IP-DTW). The proposed method is defined formally as follows:
We construct a matrix in which the (ith, jth) element denotes the base distance between the two points
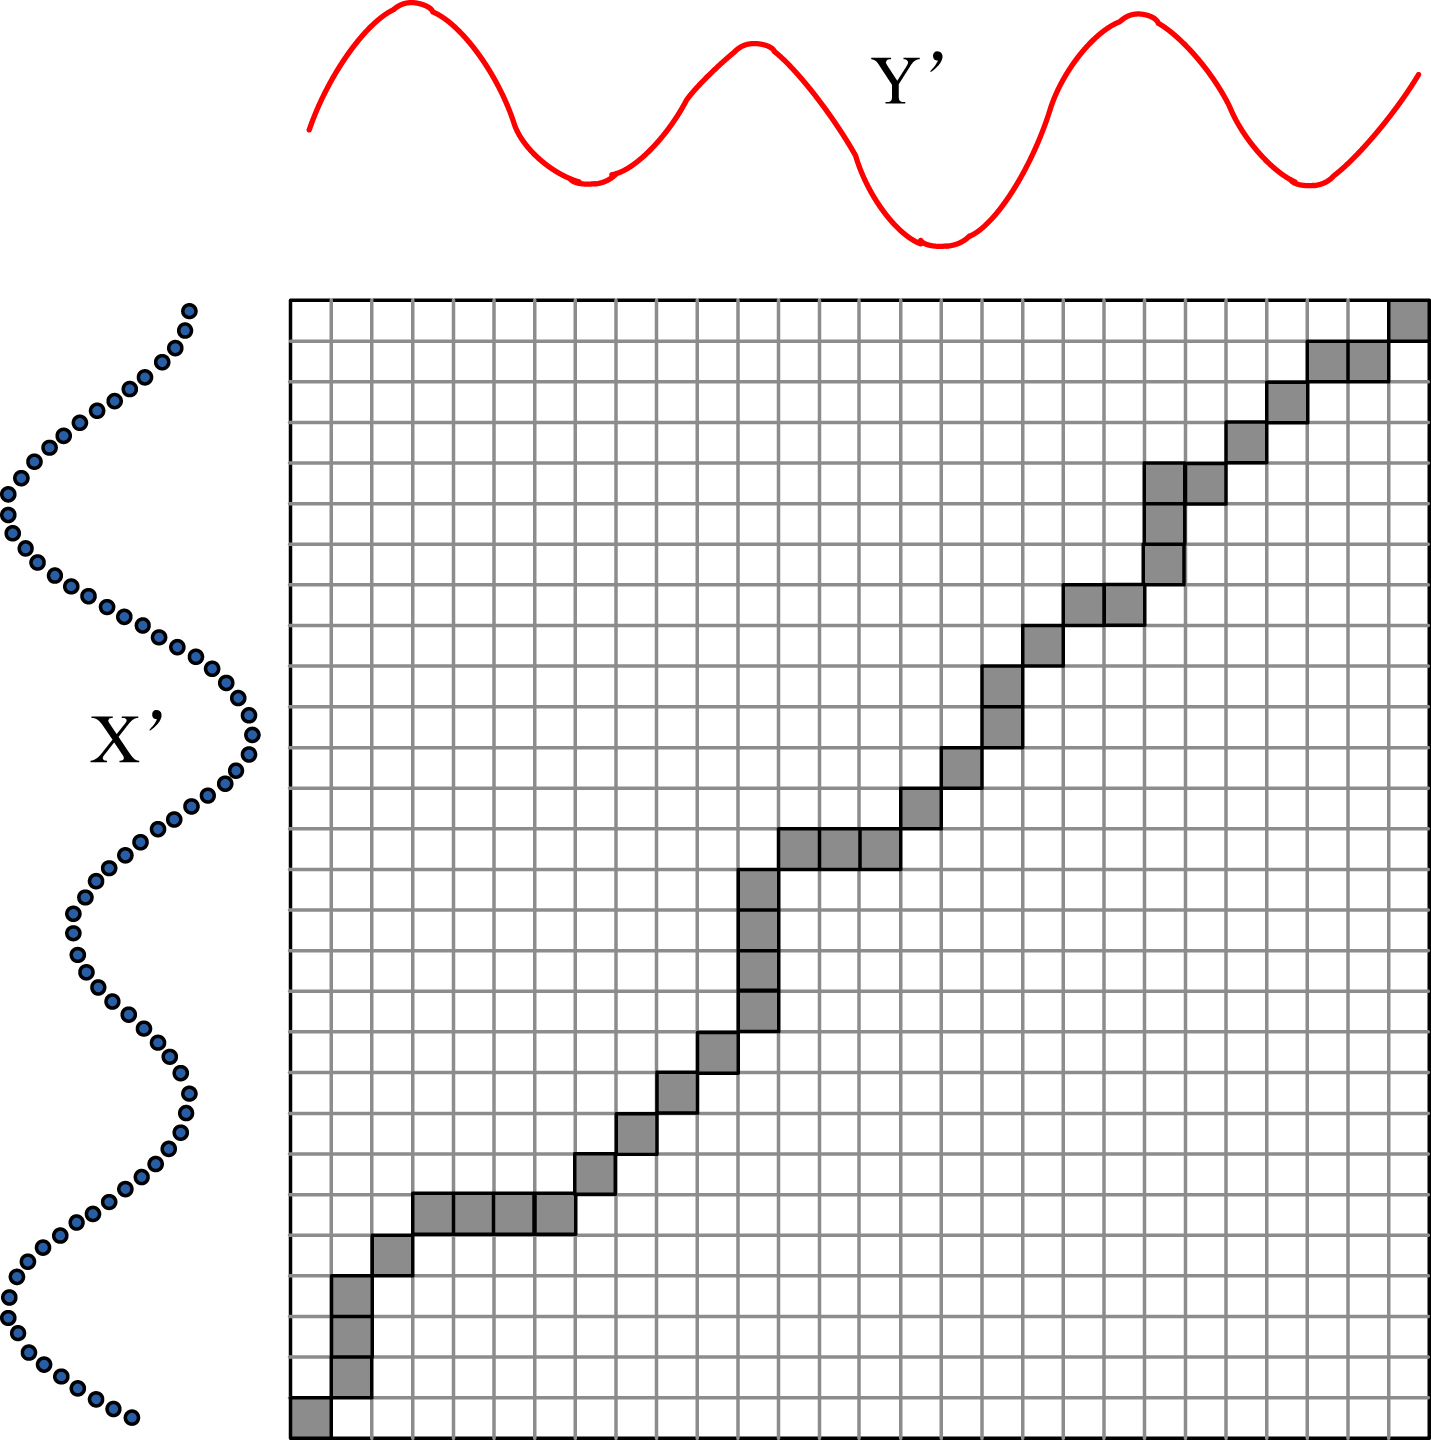
A warping path of two time series.
A warping path W is a contiguous set of the matrix elements that describes a mapping between X′ and Y′. The kth element of W is denoted as w
k
= (i, j)
k
. The warping path
This path can be found by calculating the following recurrence with dynamic programming [28]:
Supposing the lengths of X, Y are n and s, the computational complexity of DTW is O(ns). If X and Y are split into n′ and s′ segments respectively by our proposed method, the computational complexity of IP-DTW is O(n′s′). Then, we can use the ratio
We can see from Fig. 4, the length of the characteristic sequence is usually less than that of the original sequence. Theoretically, the proposed method can help to speed up dynamic time warping of multivariate time series.
Furthermore, we need to answer at least two questions by the following experiments: whether IP-DTW can obtain acceptable matching accuracy? how much computational complexity has been reduced?
The experiments involve three parts. First, we describe the experimental design including experimental setting and experiment procedures. Thenwe make a comprehensive comparison with competing methods to verify the effectiveness of the proposed method. Finally, we analyze its computational complexity in practical applications.
Experimental design
Experimental setting
Our experiment was implemented on a PC with Intel Quad Core 3.4 GHz CPU and 4 GB-RAM, running with Matlab R2010a.
Experiments are conducted with 7 real-world data sets, including the tasks of sign language recognition, handwriting recognition, medicine, robotics, etc. The detailed information is listed in Table 1.
Summary of the data sets
Summary of the data sets
Australian Sign Language (ASL) consists of 95 kinds of meanings, such as alive, maybe, when, etc. Each hand was described by 11 variables: 6 variables record the position of the hand, and 5 variables measure 5 fingers’ bend.
ECG contains the measurements of cardiac electrical activity. Each sample was labelled as normal or abnormal.
EEG was obtained from 64 electrodes placed on subjects’ scalps. The subjects were divided into two groups: alcoholic and control. We choose 22 samples from the first 2 subjects (co2a0000364 and co2c0000337) as our experimental data.
Japanese Vowels were collected from 9 male speakers uttering 2 Japanese vowels successively. Each utterance was described by 12 variables.
Libras contains 15 classes with 24 instances per class. Each class refers to a hand movement in Brazilian signal language.
Pen Digits (short for Pen-Based Recognition of Handwritten Digits Data Set) were collected from a WACOM PL-100V pressure sensitive tablet with an integrated LCD display and a cordless stylus.
LP1 contains torque and force measurements on a robot after failure detection.
We use leave-one-out cross-validation to evaluate the classification accuracy of different methods. We choose a sequence X from a data set containing n sequences. The procedure of the experiment can be described as follows: Find the k nearest neighbors of X in the data set; From its k nearest neighbors, count the number of the series falling into the same class with X, labelled as n0. Calculate the classification accuracy:
The classification accuracy of the other sequences in the data set is calculated. Then, the average classification accuracy is obtained:
Euclidean distance can only measure multivariate time series of equal length. So we compare the effectiveness of our proposed method with Eros and DTW, without considering Euclidean distance.
The experimental results on ASL are illustrated in Table 2. In IP-DTW, MaxSegError=0.05; Eros and DTW are parameter-free. For each k (k=1, 5, 10), 2565 queries are conducted. Table 2 records the query times under different classification accuracy.
The experimental results on ASL
The experimental results on ASL
We can see, in the region of low classification accuracy (such as e=0 or e=10%), IP-DTW contains fewer query times than the other methods; in the region of high classification accuracy (especially e=100%), IP-DTW contains more query times.
Further, we calculate the average classification accuracy of different methods on ASL, as shown in Table 3. Obviously, IP-DTW obtains higher matching accuracy on ASL.
Average classification accuracy on ASL
In order to compare the matching accuracy more intuitionally, we choose the third sequence of ASL (ASL_3) as the input sample, and find its most similar series with different methods. The results are shown in Fig. 6, which provides two-dimensional and three-dimensional graphics of the multivariate time series.
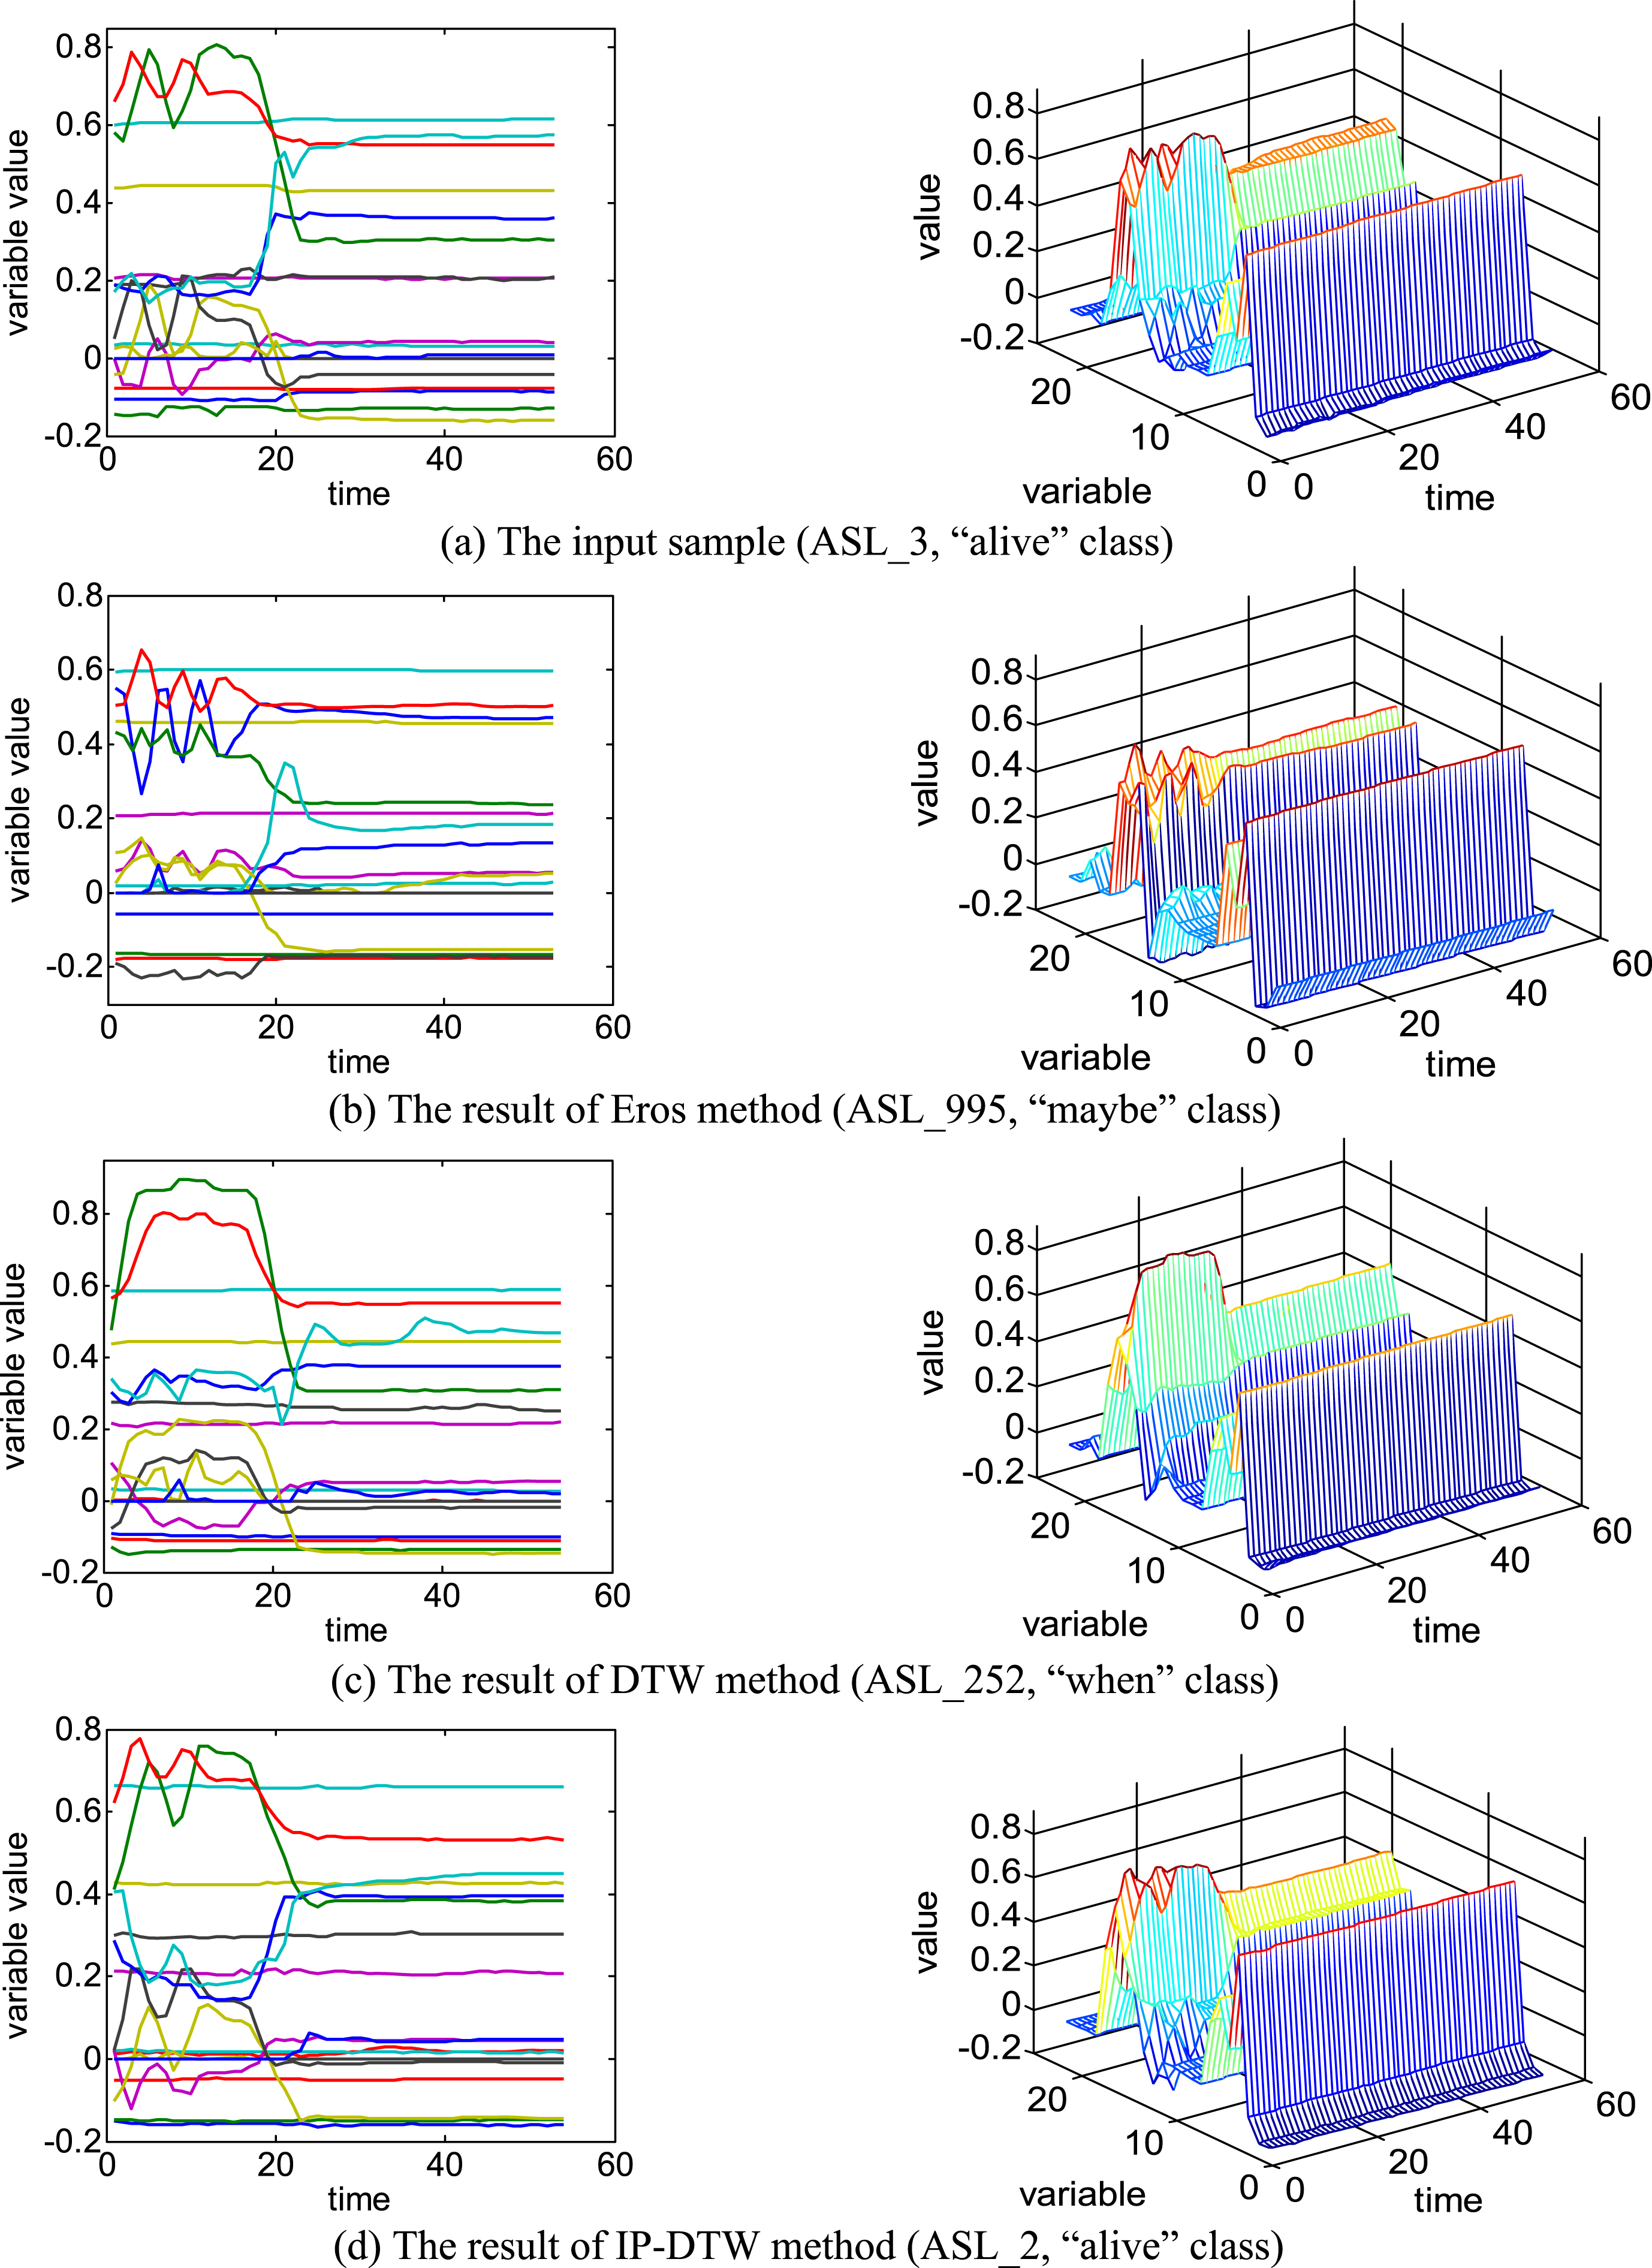
The results of finding the most similar series on ASL.
We can see that the most similar series found by Eros is obviously different from the input sample (ASL_3). The reason is that Eros is unable to describe the order of the observations in a sequence and it cannot avoid the risk of misjudgement. Since DTW and IP-DTW can search an optimal match between two sequences, they get better results.
Moreover, only the series (ASL_2) found by IP-DTW falls into the same class with ASL_3. This shows that the features of the input sample can effectively describe the original series.
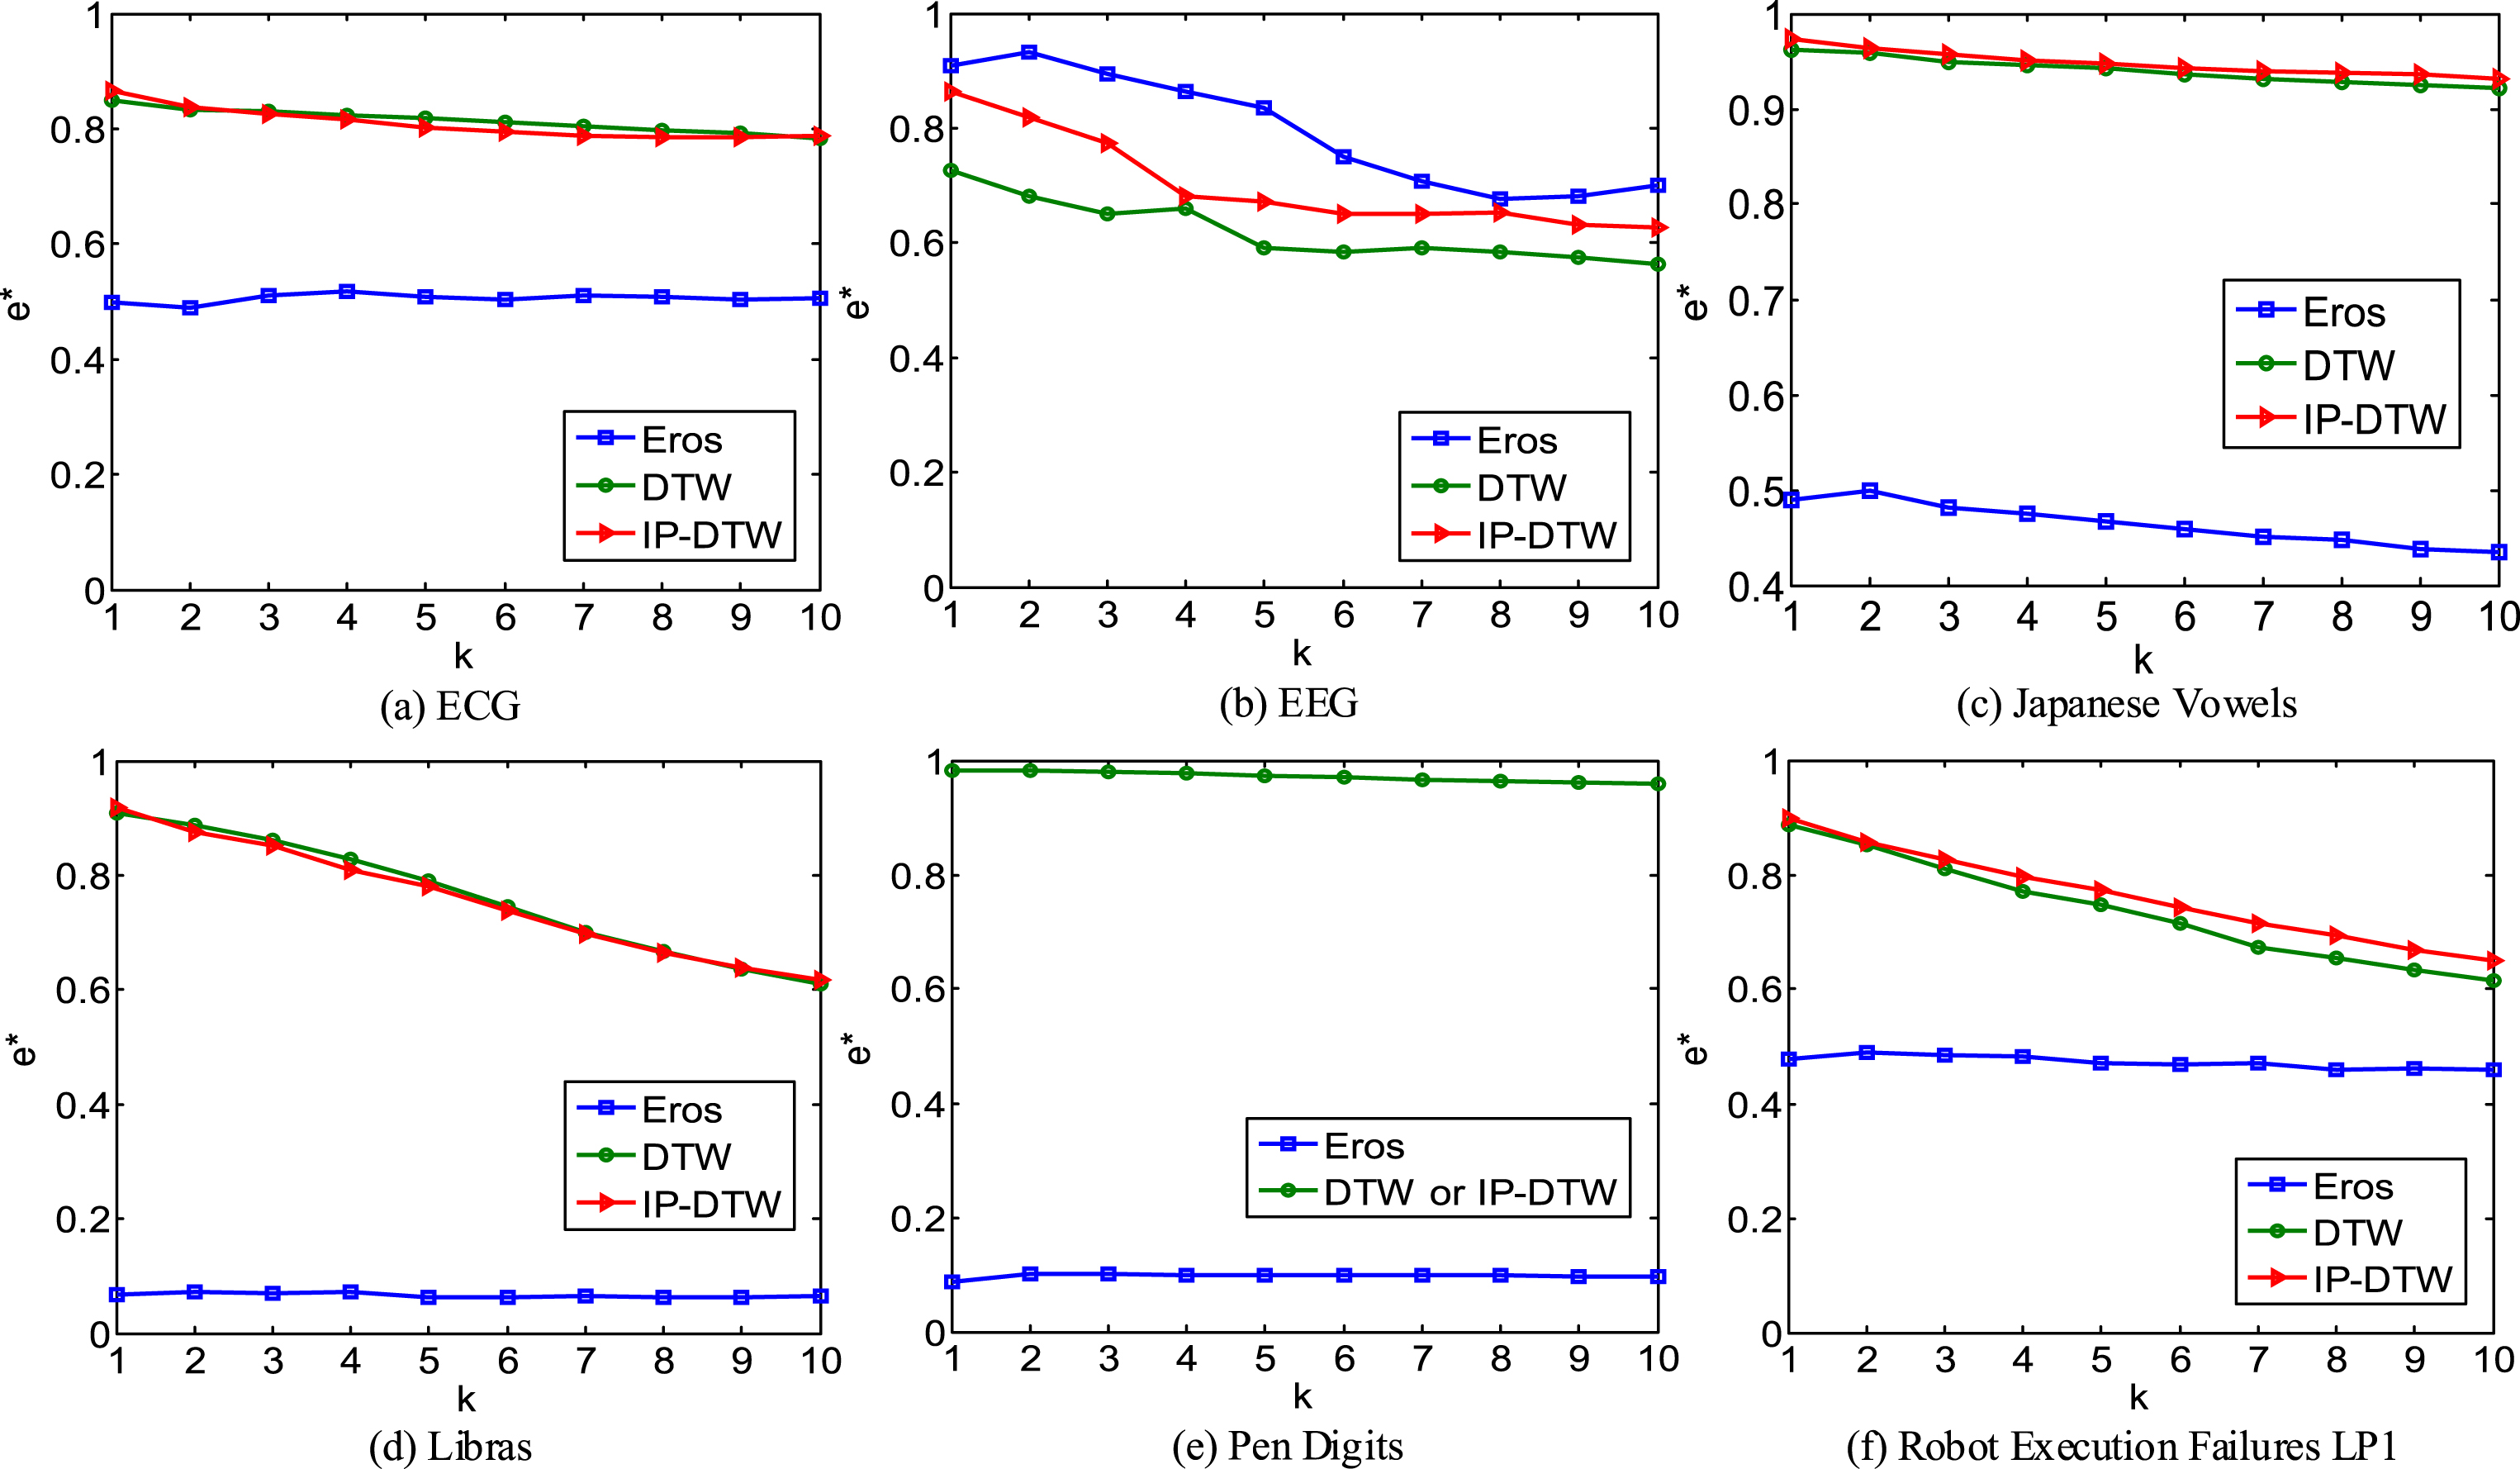
Furthermore, we extend the experiments from ASL to the other data sets. The experimental results are illustrated in Fig. 7. The relevant parameter settings in IP-DTW are listed in Table 4.
Average classification accuracy on diverse data sets.
Parameter settings in IP-DTW method
The average classification accuracy of Eros on most data sets is much lower than the results of the other methods. The results are almost consistent under different k values in general.
But on EEG, Eros achieves higher accuracy than the other two competing methods. Because there are few sequences on EEG with similar observations but different order, and the risk of misjudgement rarely occurs.
IP-DTW achieves a little higher average classification accuracy than DTW on most data sets. It provides an experimental evidence that IP-DTW not only effectively reduces the dimensions of multivariate time series, but also obtains higher matching accuracy than DTW.
On Pen Digits, DTW and IP-DTW get exactly the same results. The reason is that the lengths of the series on Pen Digits are short, as shown in Table 1. The original series are their own features by setting MaxSegError = 0 in IP-DTW method, as illustrated in Table 4. In this case, IP-DTW degrades to DTW. Therefore, DTW can be seen as a special case of IP-DTW by setting MaxSegError = 0.
The experiments above evidence that IP-DTW can obtain acceptable matching accuracy. Next we analyze its computational complexity.
In this section, we compare the computational complexity of DTW and IP-DTW according to Eq. (9).
Since leave-one-out cross-validation is used in our experiments, there is no need to calculate the ratio r of every pair of sequences. For a data set, the average lengths of the original sequences and the segmented sequences are calculated respectively, labelled as
The comparison results of computational cost on 7 real-world data sets are illustrated in Table 5. On most data sets except for Pen Digits, IP-DTW can effectively reduce the dimensions of multivariate time series. Compared with DTW, the computational cost of IP-DTW decreases a lot, even less than a quarter of that of DTW.
Comparison of computational complexity with DTW
Furthermore, we record the average computation time of IP-DTW and DTW respectively, and use the ratio to compare their computational complexity. The results are shown in Fig. 8, which are consistent with the theoretical analysis.
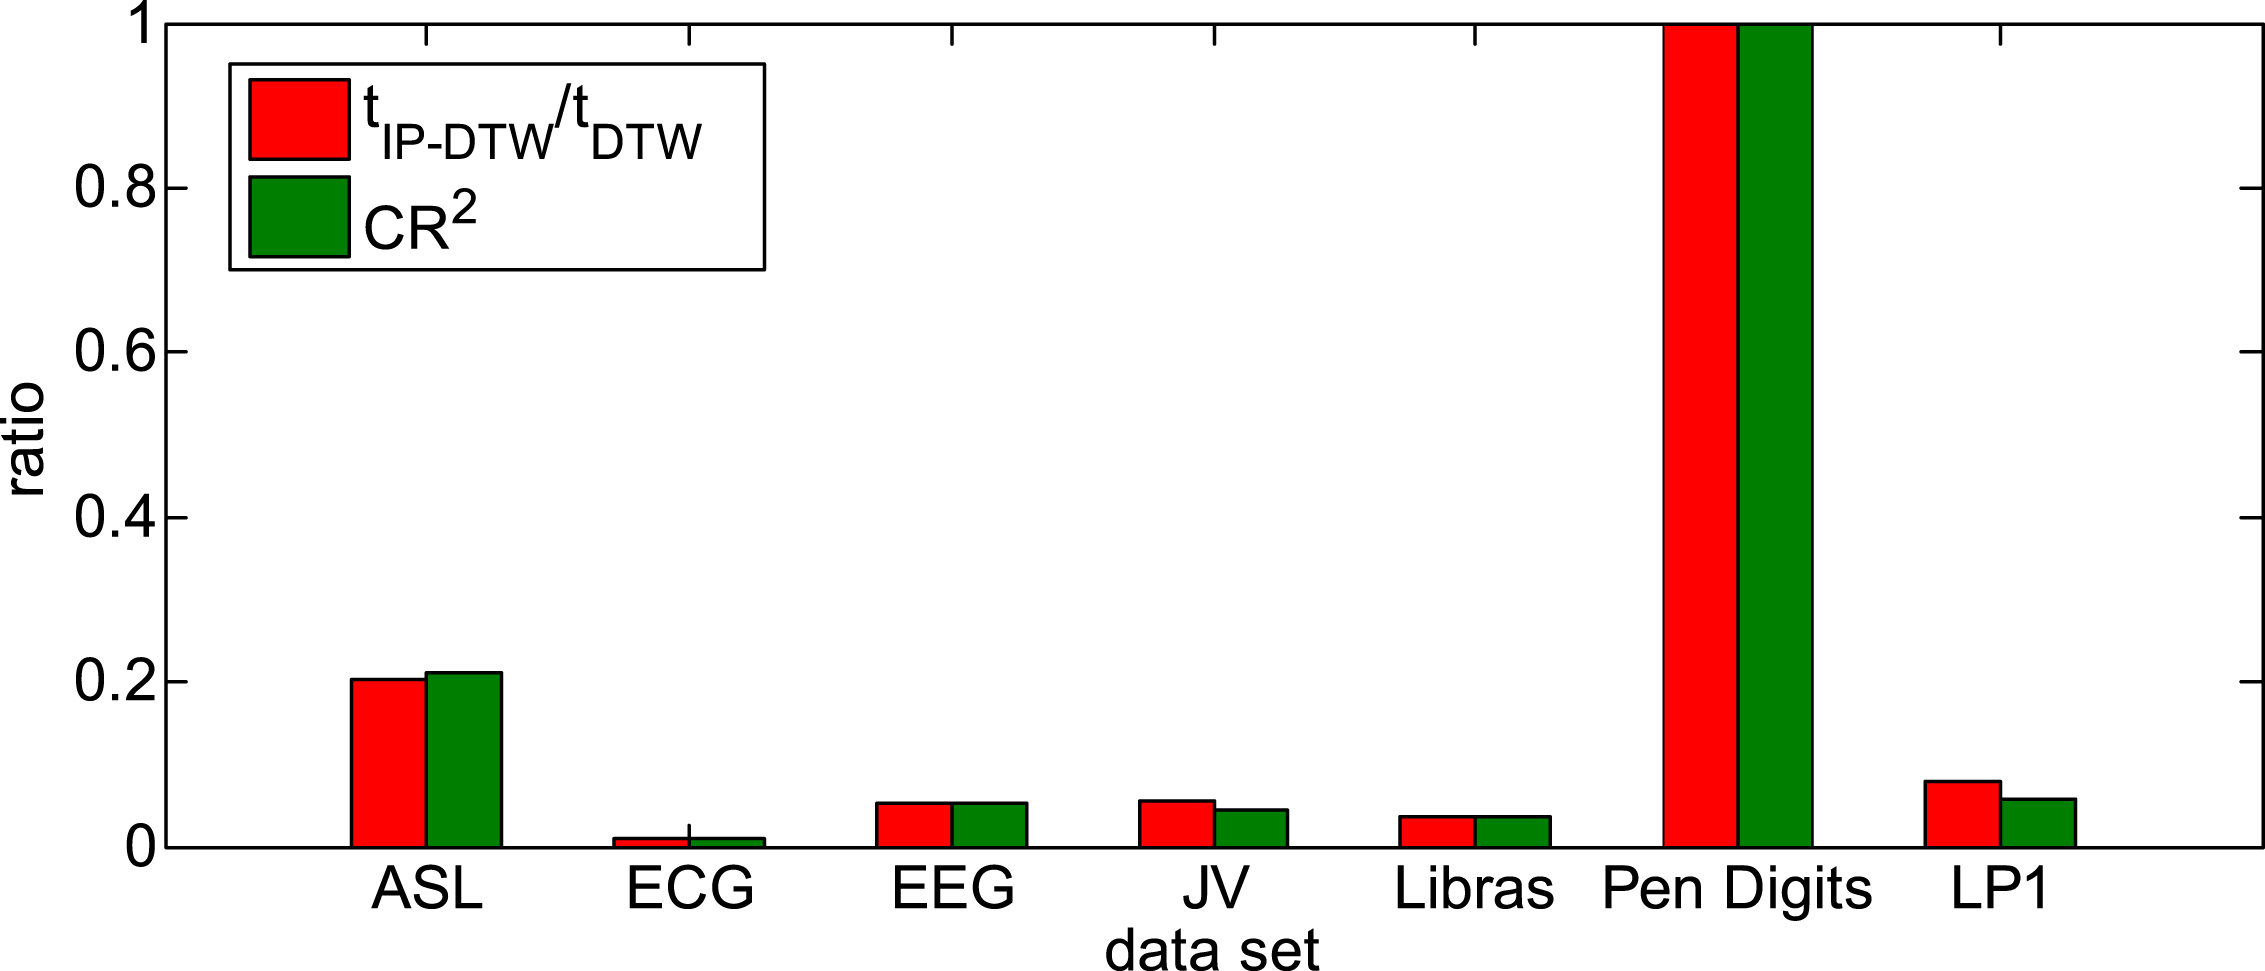
Computational complexity on diverse data sets.
The experimental results in Section 4.2 and Section 4.3 indicate that IP-DTW can speed up dynamic time warping of multivariate time series, and can achieve satisfactory matching accuracy.
In this paper, we proposed a novel approach to speed up dynamic time warping of multivariate time series. Theoretically, the computational complexity of the proposed method was analysed. Extensive experiments were also conducted on real-world data sets. The experimental results indicate that the proposed method can effectively improve the efficiency of dynamic time warping for multivariate time series, and obtain satisfactory matching accuracy.
Furthermore, the proposed method can be naturally extended from multivariate time series to univariate time series. Several aspects still need to be studied further, for example, how to quickly find the optimal threshold MaxSegError, how to exploit the proposed method in similarity search on massive data sets, etc.
Footnotes
Acknowledgments
Thanks to the donors of the UCR time series repository. We would like to sincerely thank Eamonn Keogh, Chotirat (Ann) Ratanamahatana, etc. for their inspiring work in this field. The research is supported by the National Natural Science Foundation of China under Grant No. 61502521 and 71771094.