
Abstract
Environmental governance cost prediction is an essential process in environmental protection. However, the existing environmental governance cost prediction methods are facing two challenges: First, the principal components of environmental indicator information must be accurately extracted without considering the independence of environmental indicators. Second, the higher interpretability and the lower complexity must be taken into account with the desired accuracy for improving the cost prediction of environmental governance. Therefore, the fuzzy rule based system (FRBS) and feature extraction are introduced to propose a new environmental governance cost prediction method, named FRBS-FE, in which the feature extraction is used to extract the principal components of environmental indicator information firstly, and then all these principal components are applied to generate a FRBS-FE for better environmental governance cost prediction. A case study involving 29 provinces of China is carried out to demonstrate the effectiveness of the FRBS-FE. The results showed that the FRBS-FE not only can accurately predict different kinds of environmental governance costs, but also have superior performance in comparison with previous cost prediction methods.
Introduction
Along with the development of economic and urbanization, environmental pollution has caused serious damages to human health and well being, which also resulted in a high pressure for environmental governance. Environmental problems, including pollution emission, climate change, and undesirable use of ecosystem service, require urgent policy measures to address such problems on sustainable development [1]. To realize this promise, the government must set up an effective investment planning for environmental governance to avoid the unsatisfactory effects [2–4]. Scientific environmental governance cost usually involves the design of integrated methods that are capable of addressing environmental protection and pollution emission [2], which is also conductive to energy conservation, the utilization rate of resources and the waste reduction [5]. By promoting an optimal environmental investment scheme, the predicted costs will benefit to social sustainability by a balanced resource distribution and waste discharge [6, 7].
With the purpose of improving effectiveness for pollution reduction and environmental protection, the researches on environmental governance investments have attracted considerable attentions, and these researches mainly focused on the theory of input-output relationship [8], energy saving of production system [9], and the impact of technological innovation on environmental investment [10], along with some commonly used methods for environmental governance cost prediction, such as the grey model (GM(1.1)) [11], inverse data envelopment analysis (DEA) [12], and adaptive neuro-fuzzy inference system (ANFIS) [13]. The detailed literature review can be found in Section 2.1
However, previous methods for environmental governance cost prediction have two challenges: (1) neglecting the principal components extraction from indicator information. Most previous studies relied on indicator selection or indicator integration to ensure the integrity of indicator information [14, 15], however, the indicator selection will result in information loss for cost prediction since the most indicator selection models relied on experts’ experience, and the indicator integration have strong requirements for the independence of each indicator, but it is difficult to distinguish and validate the independence of all indicators in indicator integration; (2) Environmental governance cost prediction has a high requirement in the complexity and interpretability of cost prediction methods. However, most previous studies ignored the high interpretability and low complexity in constructing cost prediction methods. For example, the GM (1.1) model ignored the interpretability of environmental input and output indicators, the ANFIS model has certain requirements for the size of environmental data and boundary of predicted values, resulted to a high complexity in cost prediction [16, 17].
To overcome aforementioned two challenges, the fuzzy rule based system (FRBS) with feature extraction is introduced to propose a new cost prediction of environmental governance method, named FRBS-FE. Note that the FRBS was first proposed by Zadeh [18] and has been successfully applied in various fields, including, but not limited to, intrusion detection systems [19, 20], credit classification [21], large data analysis [22], anomaly detection and prediction of company investment and non-investment grade [23]. But for all these fields, it is still a rare case for the application of the FRBS on cost prediction of environmental governance. By analyzing the existing methods, the proposed environmental governance cost prediction method has following advantages: The FRBS-FE utilizes indicator extraction in environmental governance cost prediction to improve the accuracy of the original FRBS. Due to the feature extraction, the FRBS-FE not only ensures the principal components of environmental indicator information considered in the process of cost prediction, but also eliminates decision-making errors caused by redundant and irrelevant indicators. Therefore, the FRBS-FE is able to overcome the first challenge of previous methods for environmental governance cost prediction. The FRBS-FE is an extension of the previous FRBS which is based on fuzzy partition to combine fuzzy rule base and has interpretable calculation processes. Hence, it is clear that the FRBS-FE not only can ensure a desired interpretability, but also maintain the number of fuzzy rules to implement a low complexity in the environmental governance cost prediction. In other words, the FRBS-FE is also able to solve the second challenge of previous methods for environmental governance cost prediction.
To demonstrate the effectiveness of the proposed method, the environmental data in China 29 provinces are introduced to carry out a case study. The experimental results reveal that the FRBS-FE can be scientifically applied in the cost prediction of environmental governance. In addition, the superiority of the FRBS-FE is further verified by comparing with other previous environmental governance cost prediction methods.
The rest of this paper is organized as follows. Section 2 is the overview of environmental governance cost prediction. The generation of the FRBS for environmental governance cost prediction is introduced in Section 3. Section 4 provides the details of the proposed method based on the FRBS and feature extraction. Section 5 shows the empirical study of the proposed method. Finally, the conclusions are given in Section 6.
Overview and challenges of environmental governance cost prediction
In this section, previous studies of environmental governance cost prediction are reviewed firstly, followed by the introduction of the challenges of proposing a new method for environmental governance cost prediction.
Review of previous studies on environmental governance cost prediction
Previous studies for environmental governance cost prediction were of three types. For the first type, its research goal is to predict costs based on the input-output theory, which is the start of the environmental governance cost prediction. The relevant cost prediction methods have been proposed and applied to environmental governance [24]. For example, Liang et al. [25] used the input-output theory in the analysis of industrial benefits growth and discussed the input of industrial in environmental governance. Lam et al. [26] were based on the input-output analysis of energy usage to study the direct and indirect influence of energy input to the industry final commodities. Pang et al. [27] constructed the input-output approach to analyze the linkages between production activities and ecosystem degradation in China, which showed that the output of industrial products has placed huge pressure on China’s ecosystem. Apparently, all these researches regarding the first type indicated that environmental governance not only depends on environmental investments and energy consumptions, but also needs strategies to make a scientific investment scheme for the sustainable development of industrial output and ecosystem.
For the second type, the research goal is to predict costs based on the prediction models. To date, the models used for environmental governance cost prediction include grey forecasting model [11], autoregressive moving average method [28] and the inverse DEA model [2] and so on. For example, Chen et al. [2] was based on the inverse DEA model to provide the input-output relationship of environmental governance in the next 10 years of China for sustainable development. Ye et al. [14] proposed a new ANFIS model for environmental governance cost prediction by considering the improvement of environmental governance efficiency. Based on the indicator integration, Ye et al. [15] also applied the GP model to predict environmental governance costs with the risk preference of decision maker. It is worth noting that the above studies for cost prediction were mainly based on indicator selection or indicator synthesis to select the necessity indicators, but both of them sometime fail to extract the principal component and avoid indicator information redundancy of data.
For the third type, the research goal is to investigate the significance of environmental investment for environmental protection and environmental technology innovation. For example, Yu et al. [9] predicted the project investment of coal mining solution using a dynamic programming method, but it is difficult to explain the superiority of the method because of lack of comparative analyses. Costa et al. [10] pointed out that the environmental R&D has become a key factor in environmental governance, but it still is a disputed question that how much the specific R&D investment is optimal. Some attempts devoted in the environmental investment with corresponding policies in 22 manufacturing sectors, but they mainly studied from the perspective of environmental technology innovation, which ignored the specific prediction of future investment in environmental governance [24, 25].
Challenges of proposing new environmental governance cost prediction method
According to the previous studies on environmental governance cost prediction, two challenges can be summarized for proposing a new environmental governance cost prediction method: Proposing new environmental governance cost prediction method requires the consideration of feature extraction.
For the previous studies on environmental governance cost prediction, indicator selection and indicator integration are two commonly used approaches to address the problem that too many indicators have to be considered for environmental governance cost prediction. However, the indicator selection usually fails to accurately retain the principal components of environmental indicator information and the indicator integration must depend on the independence of all indicators. Hence, the feature extraction can be a better choice for environmental governance cost prediction because it aims at extracting principal components of environmental indicator information without considering the independence of each indicator. Proposing new environmental governance cost prediction method requires high interpretability and low complexity.
The improvement of accuracy is the main purpose in the previous studies on environmental governance cost prediction. However, to make the predicted costs more acceptable for environmental governance, it is necessary to consider the interpretability and complexity of cost prediction process. This is because the environmental governance cost prediction not only needs a method to accurately predict costs for environmental governance, but also requires much higher interpretability and lower complexity in the cost prediction process so that the decision-makers of environmental governance are confident enough to design an investment plan based on the predicted costs.
The above two challenges clearly indicate the necessary conditions of proposing new environmental governance cost prediction methods. Hence, in the coming section, the FRBS with feature extraction is introduced to propose a new method for overcoming the above two challenges.
Generating FRBS for environmental governance cost prediction
The FRBS is a well-known fuzzy logic and it has many advantages, such as satisfactory accuracy, high interpretability, and low complexity. For this reason, the FRBS has been successfully used in a great many real-world problems, including credit classification [29], stock investment prediction [30], health care estimation [19], and risk assessment [22]. However, to best of our knowledge, the environmental governance cost prediction is still a rare case in the existing applications of the FRBS. Hence, according to one of famous FRBSs shown in [31], the following four steps are provided to show the process of generating a FRBS for environmental governance cost prediction.
Suppose the environmental governance cost prediction is a multi-input single-output problem that includes M input indicators x
i
(i = 1,…, M) and one output indicator y. The value ranges of these indicators are [

Fuzzy regions and the corresponding membership functions.
Suppose there are a set of input-output data pairs (
Considering that each input-output data pair can generate one rule, it is inevitable that there are many rules with different importance in the generated rules. Thus, the following strategy is used to calculate a weight for each rule:
Taking the rule shown in Equation (1) for example, the weight of R t can be calculated as follows:
After generating all fuzzy rules from all input-output data pairs, it is highly probable that some rules have identical fuzzy labels in all input and output indicators with different weights. For this situation, the fuzzy rule with maximum weight is selected as the representative rule. Finally, all representative rules are regarded as a combined fuzzy rule base.
In this section, a feature extraction method based on principal component analysis is firstly proposed to improve the FRBS. Next, a description of constructing the improved FRBS and predicting environmental governance costs are given.
Feature extraction for improving FRBS
In the case of environmental governance cost prediction, it usually involves a large number of input indicators, leading to the dilemma that excessive fuzzy rules have to be generated. Actually, not all of the information implied in those input indicators is necessary in the generation of FRBS because of the curse of dimensionality [32]. Hence, one of famous feature extraction methods, named principal component analysis, is introduced to improve the generation of FRBS, in which feature extraction basically gives a new representation for original dataset so that the data in the new representation has some useful properties, i.e. each indicator in the new representation is associated with the amount of variance.
Correspondingly, the detailed steps of the feature extraction used to improve FRBS are shown as follows:
Suppose there are M input indicators x
i
(i = 1,…, M), whose values related with the tth (t = 1,…, T) data are denoted by
Suppose there are M eigenvalues and eigenvectors, denoted as λ
j
(j = 1, . . . , M) and u
j
= (uj,1, . . . , uj,M)
T
. According to the matrix manipulation, the eigenvalues and eigenvectors can be calculated by:
According to the principal component analysis, the accumulative contribution ratio of the top M’ (M’< M) principal components are computed by:
Basically, it is required that ACR≥ 90 % in determining how many principal components should be used for generate a FRBS. Once the principal components are determined, the original data of all input indicators can be transformed into new data by using the following equation:
Based on the improved FRBS using feature extraction method shown in Section 4.1, a new environmental governance cost prediction method, named FRBS-FE, is proposed in this section. The theoretical framework is shown in Fig. 2.

Framework of new environmental governance cost prediction method.
According to Fig. 2, the specific steps of the FRBS-FE are as follows:
Suppose that the historical data of environmental governance cost prediction have M input indicators (x1, …, x
M
) and one output indicator y, and each input-output data is (
On the basis of the T new data (
For a new environmental pollution data (
To verify the proposed FRBS-FE, the regional environmental governance data from 29 provinces in the mainland of China are utilized to perform a case study, followed by the comparative analysis on some existing cost prediction methods.
Data source and variable definition
Based on the previous studies [2, 9], the environmental pollutions include three types, namely, waste air, waste water, and solid waste, and details of these three types are usually related with ten input indicators. Meanwhile, the environmental governance cost has three output indicators. The corresponding data can be obtained from China Statistical Yearbook 2006 to 2016, China Statistical Yearbook on Environment 2006 to 2016. The descriptive statistics of these data are summarized in Table 1. It can be found that the pollutants emission of waste air, waste water, and solid waste have different standard deviations, in which the emission water is much higher than other pollutants. In other words, the effect of wastewater treatment in China is not significant, and the pollution of wastewater is still serious. For the statistical analysis of environmental governance cost, the standard deviation of capital input is greater than that of labor input and energy consumption, it indicated that the regional difference and time change of capital input are obvious.
Statistical analysis of the input and output indicator from 2006 to 2016
Statistical analysis of the input and output indicator from 2006 to 2016
Additionally, the previous studies [2, 15] were mainly based on the data of 2006-2016 to establish environmental governance cost prediction methods, thus the data of 2006-2015 are taken as the training data of environmental governance to construct cost prediction methods, and the remaining data is as the testing data.
To validate the proposed FRBS-FE, each input and output indicators is set as two triangular fuzzy labels. Additionally, the correlation coefficient (R), mean absolute percentage error (MAPE), and mean absolute error (MAE) are adopted to evaluate the performance of different cost prediction methods:
Based on the details of the FRBS-FE shown in Section 4.2, the development process of the FRBS-FE is discussed in this section. The detailed steps are provided as follows:
Firstly, according to Step 1 in the FRBS-FE, the principal components of the environmental data shown in Table 1 should be calculated to extract the feature of input indicators. Taking the labor data of Beijing as an example to illustrate the process of feature extraction, the corresponding eigenvalues and cumulative contribution rates are shown in Table 2. For convenient, the ten principal components of the labor data are abbreviated as PC1 to PC10. It is clear from Table 2 that the contribution rate of PC1, PC2, PC3, and PC4 is 54.91%, 18%, 10.12%, and 9.03%, respectively, and total of contribution rate of these four principal components is 92.06%, which is greater than 90%. Hence, the PC1, PC2, PC3, and PC4 are regarded as the principal components to generate fuzzy rules for the FRBS-FE.
Eigenvalues and contribution rates of Beijing in labor prediction
Eigenvalues and contribution rates of Beijing in labor prediction
Secondly, according to Step 2 in the FRBS-FE, the fuzzy rules for the FRBS-FE are obtained. Taking the labor input in Beijing as example, the triangular fuzzy labels used in fuzzy rules is showed in Table 3 and the fuzzy rules for labor input prediction is showed in Table 4. It is worth noting that there are several negative values used to denote triangular fuzzy labels because all data should be transformed into new data with a useful representation. Moreover, the total number of fuzzy rules is five which is less than the total number of training data. This is because the fuzzy rule which has the same triangular fuzzy label in PC1, PC2, PC3, PC4, and Labor should be combined for a single one.
Triangular fuzzy labels for generating fuzzy rules
Fuzzy rules for labor input prediction in Beijing
Finally, based on Step 3 in the FRBS-FE, the predicted cost can be obtained by the FRBS-FE when new environmental pollution data is provided. Figure 3 shows the comparative results between actual cost and the predicted cost of the FRBS-FE in the case of labor in Beijing. From Fig. 3, the predicted cost of the FRBS-FE is closely equal to the actual cost, which demonstrates the effectiveness of the FRBS-FE for the environmental governance cost prediction.
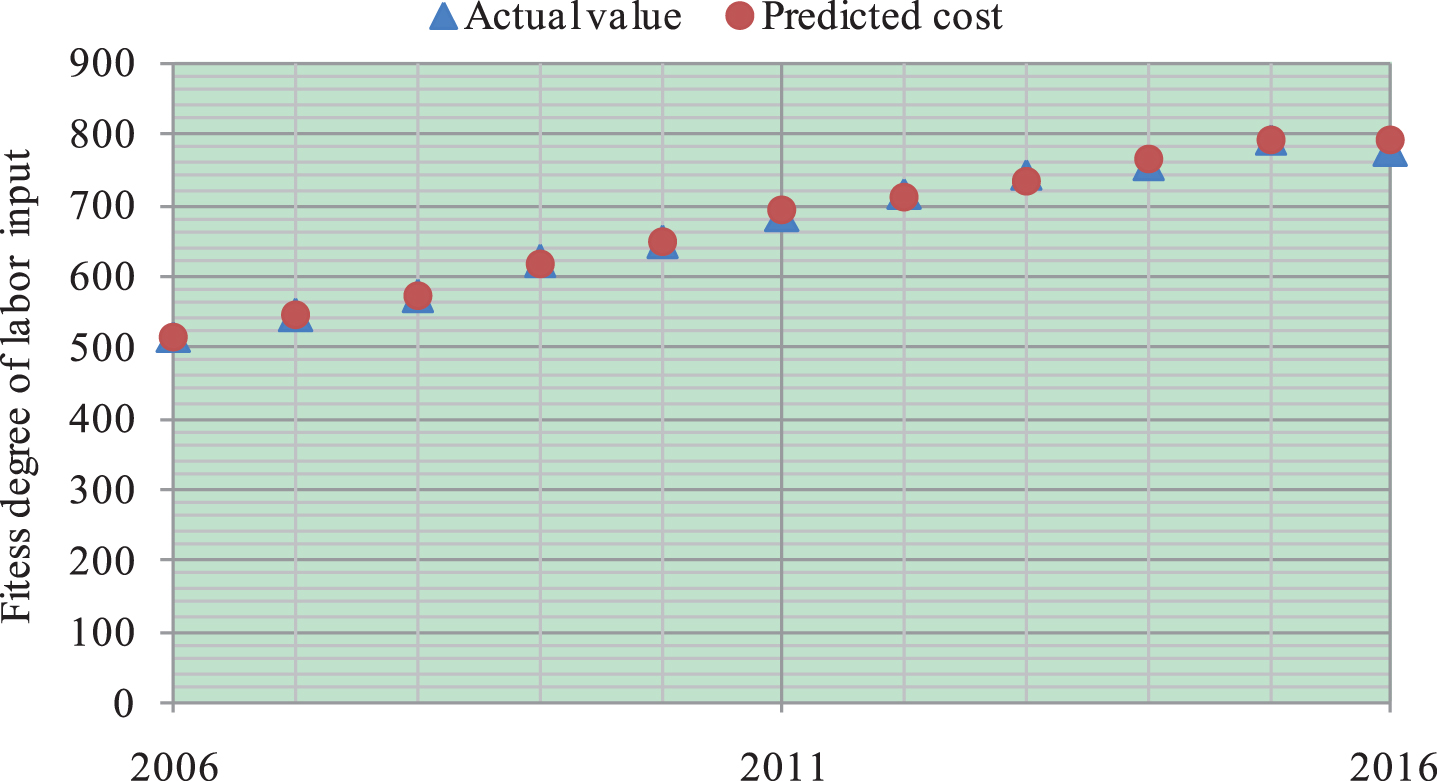
Actual and predicted environmental governance cost in Beijing.
To further verify the effectiveness of the FRBS-FE, the comparative analysis of cost prediction based on the actual environmental governance costs is showed in Section 5.3.1, and the comparative analysis of the FRBS-FE, GM (1.1), and ANFIS model is proposed in Section 5.3.2.
Comparative analysis of FRBS-FE and actual value
From the view of cost spatial distribution predicted by the FRBS-FE, the predicted energy in 2006 and 2016 are taken as an example to analyze its spatial distribution comparing to actual energy data. The predicted results in Fig. 4 indicate that the predicted results of energy distribution is in accordance with the real capital distribution in 2006 and 2016 of China 29 provinces, and apart from the prediction results in Xinjiang and Neimenggu provinces, Fig. 4 also shows that the FRBS-FE has high prediction accuracy. The most energy investment areas are mainly in eastern China, owing to the growth of population, rapid economic development. Most western provinces have low energy investment in China. The backward situation in the western of China is the result of geographic and policies’ allocation. It is important to analyze the difference in regional cost investment in order to promote economic development and ecosystem balance in the western of China.

Regional capital distribution in 2006. (a) Actual energy distribution in 2006, (b) Predicted energy in 2006.
Apart from the prediction results in Xinjiang, Neimenggu and Sichuang provinces, Fig. 5 also shows that the FRBS-FE has high prediction accuracy in most provinces. At the same time, compared with the energy consumption situation in 2006, energy consumption in provinces increased significantly in 2016. Among them, the promotion in the central and western regions is most significant. The main reasons are as follows: firstly, the high pollution and energy consumption industries in the eastern region are transferring to the central and Western regions; secondly, the rapid economic development in recent years has brought about an increase in energy demand; thirdly, energy conservation and new energy development in most provinces are still in the initial stage.

Regional capital distribution in 2016. (a) Actual energy distribution in 2016, (b) Predicted energy in 2016.
Table 5 presents the performance comparison of different methods in cost prediction, where the three methods are trained using the same training dataset and validated by the same testing dataset. From Table 5, the results of FRBS-FE are closer to the actual cost values better than the ANFIS and GM (1.1) methods. Moreover, the FRBS-FE produces satisfactory results in terms of average MAE, MAPE, and R, which are 3423, 22.1, and 0.880, respectively, and the average MAE, MAPE, and R based on the ANFIS are 115989, 1305, and 0.590, respectively. The average predicted error based on ANFIS is 10 times than the FRBS-FE method. Although the predicted error based on GM(1.1) method is closed to the FRBS-FE, the average MAE, MAPE, and R of environmental governance cost are 7920, 66, and 0.410, which shows that the predicted results obtained by FRBS-FE are more closer to the actual environmental investment than GM(1.1). GM(1.1) is mainly based on the changing law of cost value in the previous environmental governance, which does not take into account the input-output relationship of environmental governance or the selection of relevant input indicators. Therefore, it will lead to increasing or decreasing of cost input and the predicted cost value deviation from the actual situation. The environmental governance costs predicted by ANFIS are only based on the previous range of environmental governance costs, and it is difficult to deal with the extremum problem. Thus, by considering the input-output relationship and feature extraction, the prediction results of FRBS-FE is much close to the actual value.
Comparison of performances of different methods
Comparison of performances of different methods
In summary, the comparison results obtained from three environmental governance costs have demonstrated the effectiveness of the FRBS-FE. Additionally, compared with the two classical prediction methods, the FRBS-FE showed an absolute competitiveness for handling environmental governance cost prediction problems.
In order to further compare the predicted cost and actual cost in different provinces of China, the same process of developing the FRBS-FE is performed for different output indicators, including labor, capital, and energy. Robustness test of prediction model has significant effects on the accuracy of prediction results, for the reason that by verifying the stability of the model structure and its cost prediction, it can be found that some data deviate from the actual environmental governance cost seriously because of the model structure or data structure. Robustness test is also an important measure to verify whether the prediction results are in line with the actual situation. Thus, we have obtained 319 sets of predicted environmental governance cost and actual cost from 2006 to 2016 in 29 provinces to verify the robustness of the prediction results based on the FRBS-FE, which were showed in Figs. 6–8.

Comparison of predicted labor and actual labor value of 29 provinces from 2006 to 2016.

Comparison of predicted capital and actual capital value of 29 provinces from 2006 to 2016.

Comparison of predicted energy and actual energy value of 29 provinces from 2006 to 2016.
From Fig. 6, it is clear that the predicted labor value of FRBS-FE is close to the actual labor value, which shows that the predicted results based on the FRBS-FE are significantly precise. Apart from the predicted error in 51-61 sets of data, most predicted labor value is close to the actual labor investment. At the same time, we can find that the predicted labor error is small and the overall result is stable. From the change trend of labor input, the predicted labor based on FRBS-FE is basically the same as the actual cost. In 319 sets of predicted data, the difference between the maximum predicted value of labor input and the actual value is basically controlled within 100, which shows that the predicted labor and the actual labor basically fit, and the predicted results do not appear extreme value, the results are relatively stable.
For the results in Fig. 7, it is obvious that the difference between the predicted capital value and actual capital value of 29 provinces from 2006 to 2016 is small. The predicted results based on the FRBS-FE are closer to the actual capital value comparing. In terms of specific regional differences, the predicted capital value of FRBS-FE has a certain small predicted error comparing to the actual capital value, which indicates that the 319 sets of predicted capital value based on the fuzzy rule based system is precise and stable of 29 provinces from 2006 to 2016. Compared with labor input, the scale of capital input is larger, and the predicted value basically controlled within 10000. From the overall change range of 319 sets of data, the predicted capital input is also consistent with the actual value.
According to the comparison of predicted energy and actual energy value in Fig. 8, the predicted energy values based on FRBS-FE have a little difference to the actual energy values. It is has a best fitting degree between the predicted energy value based on FRBS-FE with feature extraction and actual energy value in most data sets. At the same time, it can be found that the energy prediction error is small and the overall result is stable. Furthermore, apart from the predicted errors in some data sets, the errors fluctuate slightly, and the overall variation range of prediction errors is small. The overall predicted energy value and the actual energy value fluctuate in the same direction.
In this section, the prediction robustness of FRBS-FE is analyzed when the leave-one-out cross validation is used to generate training and testing dataset. Moreover, the t-test is also applied to determine whether significant differences exist among all of mean error. In addition, the robustness of the cost prediction methods is measured by the p value, which is obtained from t-test to verify whether there has significant difference in average predicted error of each year. The results obtained from the leave-one-out cross validation are shown in Table 6. According to the t-test, there is no significant difference between the annual data and the average prediction error because of p = 0.991 > 0.05. Results show that the three predicted environmental governance costs based on FRBS-FE are closed to actual costs.
Leave-one-out cross validation of FRBS-FE for environmental governance cost prediction
In this study, a new environmental governance cost prediction method, called FRBS-FE, was proposed to predict three kinds of environmental governance costs, and the case study of China 29 provinces with the real data from 2006 to 2016 illustrated the process of predicting environmental governance cost by using the FRBS-FE. The main contributions and conclusions of this study are further summarized as three aspects: Previous cost prediction methods ignored the feature extraction in environmental governance, the proposed FRBS- FE not only avoid the redundant indicator information and irrelevant indicator selection, but also search for the principal components of environmental indicator information to improve the accuracy of cost prediction. Based on the input-output relationship of environmental governance, the predicted costs from the FRBS-FE is close to the actual costs. The FRBS-FE was generated from the input-output data of environmental governance, in which the fuzzy rule base are divided to different regions to decrease its complexity. Furthermore, the prediction process of environmental governance costs in the FRBS-FE is interpretable, so that it is convenient for decision makers to make a clear cost prediction scheme according to the input-output data of environmental governance and improve the accuracy of cost prediction. The case study in China 29 provinces from 2006 to 2016 verified several advantages of the proposed method: 1) the FRBS-FE is more reasonable than other cost prediction methods from comparative analysis; 2) the FRBS-FE has a high accuracy in environmental governance cost prediction from robustness analysis; 3) the prediction cost obtained by the FRBS-FE is stable and reliable according to the leave-one-out cross validation.
For the future research initiatives, it can devote on the efficiency assessment of pollutants management using the predicted costs. At the same time, few studies focused on the cost prediction with interval data in the field of environmental governance, future research can also devote in environmental governance cost prediction with interval uncertainty.
Footnotes
Acknowledgments
This research is supported by the National Natural Science Foundation of China (Nos. 61773123, 71371053, 71701050, 71801050and 71501047), the Humanities and Social Science Foundation of the Ministry of Education under Grant (No. 14YJC630056), the Natural Science Foundation of Fujian Province, China (No. 2015J01248) and the Social Science Foundation of Fujian Province, China (No. FJ2018C014).